Vision and Feature Norms: Improving automatic feature norm learning
through cross-modal maps
Luana Bulat, Douwe Kiela and Stephen Clark
Computer Laboratory University of Cambridge
ltf24,douwe.kiela,[email protected]
Abstract
Property norms have the potential to aid a wide range of semantic tasks, provided that they can be obtained for large numbers of concepts. Recent work has focused on text as the main source of information for auto-matic property extraction. In this paper we ex-amine property norm prediction from visual, rather than textual, data, using cross-modal maps learnt between property norm and visual spaces. We also investigate the importance of having a complete feature norm dataset, for both training and testing. Finally, we evalu-ate how these datasets and cross-modal maps can be used in an image retrieval task.
1 Introduction
Many cognitive theories of conceptual organisation assume that concepts are distributed representations over semantic primitives, often referred to as fea-tures or properties1(Tyler et al., 2000; Randall et al.,
2004). That is, we can understand the meaning of a concept through its properties. For example, under-standing the meaning ofBANANAis closely related
to understanding that it has properties such asis a fruit, is yellow, is long,is sweet, and knowing how these properties overlap with or differ from the prop-erties of other concepts.
A number of property norm datasets, where hu-mans were asked to list attributes of given concepts, have been collected to test this hypothesis (McRae et al., 2005; Vinson and Vigliocco, 2008; Devereux
1Throughout the paper we will be using the termsproperties,
features normsandattributesinterchangeably.
et al., 2013). After having been used to test mod-els of conceptual representation in cognitive science for decades (Randall et al., 2004; Cree et al., 2006), these datasets have proved to be useful in a wide range of semantic NLP tasks as well, including text simplification for limited vocabulary groups. More recently, property norms have been used as a proxy for perceptual information in a number of studies on multi-modal semantics (Andrews et al., 2009; Ri-ordan and Jones, 2011; Silberer and Lapata, 2012; Roller and Im Walde, 2013; Hill and Korhonen, 2014). Such models aim to addres the grounding problem (Harnad, 1990) that distributional semantic models of language (Turney and Pantel, 2010; Clark, 2015) suffer from.
Property norms are a valuable source of seman-tic information, and can potentially be applied to a variety of NLP tasks, but are expensive to obtain because they involve intensive human annotation. The largest property norm dataset to date consists of just 638 concepts (Devereux et al., 2013), and the most widely cited one presents properties for only 541 concepts (McRae et al., 2005). If we are to use these datasets in large-scale semantic tasks, we would need to extend the currently available prop-erty norms by obtaining annotations for more than just a few hundred words.
The alternative to collecting more data through human annotation is to increase the coverage of property norms datasets by automatically inferring properties of concepts from easily accessible re-sources, such as textual data. Considering the fact that concepts, as well as their properties, are in lin-guistic form, the task then becomes a bootstrapping
one where we take advantage of the abundance of freely available textual corpora.
There are two strands of research that attempt to automatically obtain property norm data for new concepts. One approach is to automatically generate feature norms from text corpora by mining text data for a set of generalised property patterns (Kelly et al., 2014; Baroni et al., 2010; Barbu, 2008). An-other avenue of research is inspired by Lazaridou et al. (2014) and Mikolov et al. (2013b) and tries to increase the coverage of feature norms through cross-modal mapping from linguistic information (Fagarasan et al., 2015).
Here, we follow recent trends in multi-modal se-mantics and explore automatic property norm ex-traction from visual, rather than textual, data. Ob-taining property norms from visual information makes intuitive sense: information contained in the property norm datasets can often be attributed to extra-linguistic modalities—a large proportion of relevant properties are visual, auditory or tactile, rather than linguistic (e.g. is round, makes noise, is yellow).
We show that such conceptual properties can be more accurately predicted through cross-modal mappings from raw perceptual information (i.e. im-age data) or multi-modal models (i.e. text and imim-age data combined) rather than from purely textual in-formation (Section 3). Furthermore, we analyse the quality of human collected property norm datasets and conclude that these are sparse and incomplete, meaning that there will be a lot of property annota-tions missing for a given concept (e.g. has legs is not listed as a property ofTORTOISE). We show that
having a complete dataset can drastically increase the performance of automatic feature prediction, re-sulting in a truer evaluation (Section 3.5). Lastly, we demonstrate how property norm datasets could be used in an image retrieval task (Section 4), which opens up intriguing possibilities for retrieving con-cepts based on their visual properties.
2 Property norms
Property norming studies are set up in the following way: participants are asked to freely write down a list of properties for a given concept, whilst being encouraged to consider different kinds of properties
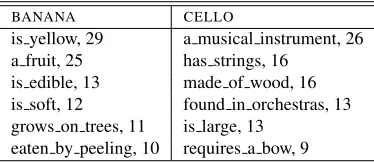
BANANA CELLO
is yellow, 29 a musical instrument, 26 a fruit, 25 has strings, 16
is edible, 13 made of wood, 16 is soft, 12 found in orchestras, 13 grows on trees, 11 is large, 13
[image:2.612.333.520.60.141.2]eaten by peeling, 10 requires a bow, 9
Table 1: Examples of features together with their production frequencies fromMCRAE
(how the concept feels, smells, what it is used for
etc).
Besides collecting lists of properties for the con-cepts of interest, a number of useful property statis-tics are also collected during these studies. For ex-ample, the number of participants that have pro-duced the same property for a given concept (also calledproduction frequency) and the number of con-cepts for which a particular property is listed in the dataset (number ofconcepts per feature) have been proposed as fundamental organising principles of cognitive models (Cree et al., 2006).
One of the most widely used property norm datasets is the one collected by McRae et al. (2005), henceforthMCRAE. It contains feature norms for a
set of 541 concrete nouns. Each concept was seen by 30 participants and only features that were listed by at least 5 participants were recorded. The pub-lished dataset contains a total of 2526 features, with a mean of 13.7 features per concept. The numbers of features registered for a given concept range be-tween 6 (for concepts likeCOLANDERorHARMON -ICA) and 26 (forFAWN). Table 1 lists some
exam-ples of properties that have been produced for BA -NANAandCELLO, taken from theMCRAEdataset.
The largest feature norm dataset published to date was developed by the Cambridge Centre for Speech, Language and Brain (Devereux et al., 2013). It contains semantic properties for 638 concrete con-cepts, with 415 of these also appearing in MCRAE.
The data collection experiment was done similarly to McRae et al. (2005), using a production frequency cutoff of 5. The final dataset lists a total of 4359 fea-tures for the 638 concepts, with an average of 2.15 features per concept more than MCRAE. Although
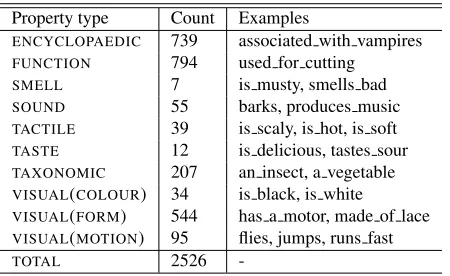
Property type Count Examples
ENCYCLOPAEDIC 739 associated with vampires FUNCTION 794 used for cutting
SMELL 7 is musty, smells bad SOUND 55 barks, produces music
TACTILE 39 is scaly, is hot, is soft TASTE 12 is delicious, tastes sour
TAXONOMIC 207 an insect, a vegetable VISUAL(COLOUR) 34 is black, is white
VISUAL(FORM) 544 has a motor, made of lace
VISUAL(MOTION) 95 flies, jumps, runs fast TOTAL 2526
-Table 2: Property types and associated examples fromMCRAE
(2008) also include verbs in their study.
All the experiments presented in this paper were conducted on MCRAE. Our choice is motivated by
the fact that this dataset has also been used in pre-vious work on automated property norm prediction (Kelly et al., 2014; Fagarasan et al., 2015), besides being one of the largest publicly-available property norm datasets.
One aspect of feature norms that previous work (Kelly et al., 2014; Baroni et al., 2010; Barbu, 2008; Fagarasan et al., 2015) fails to capture is their multi-modal nature. Even though the attributes are elicited in a linguistic form, and some properties (e.g. what things look like) are easier to verbalise than others (e.g. what things smell like), these datasets contain a variety of property types, ranging from visual and auditory to encyclopaedic and behavioural. Table 2 shows some examples for each of the 10 property types as defined and annotated in MCRAE. More
than 25% of all features are visual (e.g. is yellow, is round, made of metal); hence a natural question that follows is whether images can be used in the property norm prediction task and how their per-formance compares to that of predicting properties from text.
3 Predicting feature norms from images through cross-modal mapping
Cross-modal maps represent a formalisation of the reference problem. For example, by inducing cross-modal maps between visual vectors and linguistic ones we can learn which images (represented as vi-sual vectors) refer to which concepts (represented as
is yellow a fruit is edible is soft
BANANA 29 25 13 12
APPLE 7 24 0 0
[image:3.612.75.300.59.197.2]BED 0 0 0 13
Table 3: Subspace of PROPNORM. Important to
note thatMCRAEis not complete, meaning that even
though some properties are true of a given concept, they have not been produced by the human partic-ipants (e.g. the is edibleproperty for APPLE holds
the value 0).
text-based distributional vectors) (Lazaridou et al., 2014). This represents an extension of the object recognition problem, since we want to associate im-ages with semantic representations of their depicted objects, rather than just with their label (Frome et al., 2013; Socher et al., 2014).
The benefit of this approach lies in its generali-sation power: once a function between the two se-mantic spaces is learnt, it can be used to see how an unseen concept relates to other concepts, just by looking at an image of that concept. This is referred to as the zero-shot learning task (Palatucci et al., 2009; Lazaridou et al., 2014). Our task is to increase the coverage of the property norm datasets, meaning that we want to predict properties for new (unseen) concepts. For example, the conceptWOLFis not
in-cluded inMCRAE, but it would be desirable to know
which of the properties in the dataset apply to it (e.g.
is animal, has 4 legs) and which don’t (e.g. a bird, made of metal).
3.1 Building modality-specific representations We obtain distributed representations of concepts in the property-norm semantic space (henceforth
PROPNORM) by simply treating MCRAE as a bag
of 2526 properties, with the production frequencies representing the “co-occurrence counts” (Table 3).
Our visual space (henceforthVISUAL) consists of
visual representations for all the 541 concepts in
MCRAE, built as follows. First, we retrieve 10
im-ages per concept from Google Imim-ages,2 following
previous work (Bergsma and Goebel, 2011; Kiela and Bottou, 2014). The image representations are then obtained by extracting the pre-softmax layer
[image:3.612.324.529.61.108.2]from a forward pass in a convolutional neural net-work that has been trained on the ImageNet classifi-cation task using Caffe (Jia et al., 2014). We aggre-gate images associated with a concept into an overall visually grounded representation by taking the mean of the individual image representations. The dimen-sionality of the visual vectors is 4096.
We also build three linguistic spaces (DISTRIB, SVD and EMBED), along the lines of Fagarasan
et al. (2015). DISTRIB is a 10K-dimensional
“vanilla” distributional semantic space, where the contexts are the top 10K most frequent lemmatised words (excluding stopwords) from the October 2013 Wikipedia dump. We use raw frequency counts with context windows being defined as sentence bound-aries. SVDis a 300-dimensional SVD-reduced
ver-sion of DISTRIB where PPMI has been applied to
the raw counts. EMBED stands for the
continu-ous vector representations from the log-linear skip-gram model of Mikolov et al. (2013a). We used the publicly-available3representations that were trained
on part of the Google News dataset (about 100 bil-lion words).
We will also employ three multi-modal seman-tic spaces (VISUAL+DISTRIB, VISUAL+SVD, VI -SUAL+EMBED), in which the visual (VISUAL) and
respective linguistic representations (DISTRIB,SVD, EMBED) are combined into a multi-modal
rep-resentation by concatenating their respective L2-normalized representations.
3.2 Method and evaluation
Following previous work (Fagarasan et al., 2015; Kiela et al., 2015) we use partial least squares re-gression (PLSR)4 to learn cross-modal maps to the
property-norm space (PROPNORM) from the visual
(VISUAL), linguistic (DISTRIB, SVD, EMBED) and
multi-modal semantic spaces (VISUAL+DISTRIB, VISUAL+SVD, VISUAL+EMBED). At training time,
we take advantage of the fact that we possess both visual/linguistic/multi-modal and property norm in-formation for the concepts in MCRAE. Let’s
con-sider theVISUAL→PROPNORM setting as an
exam-ple. We use this cross-modal vocabulary to learn a mapping function between VISUAL and PROP
-3https://code.google.com/p/word2vec/ 4The number of components in the linear regression was set to 100 for all experiments.
NORM: this function will learn to map visual
dimen-sions to property dimendimen-sions. During testing, we use the learnt function to map the visual informa-tion of a previously unseen concept (e.g.CAT) to the
property norm space and obtain a predicted prop-erty vector for that concept. Ideally, we want this predicted property vector to be closer to the gold-standard property vector for CAT than to any other
property vector (i.e. the label of its nearest neigh-bour inPROPNORMto beCAT).
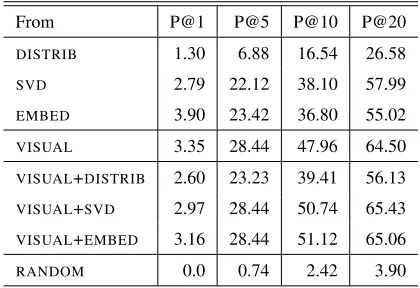
We use the standard evaluation metric for this task: average percentage correct at N (P@N) (Fa-garasan et al., 2015; Lazaridou et al., 2014; Kiela et al., 2015). This measures how many of the test in-stances were ranked within the topNhighest ranked nearest neighbors (using the cosine measure). All the results reported in Table 4 use the zero-shot learning procedure—for each of the 541 concepts in MCRAE, we train a mapping on the remaining
540 concepts and record whether the correct label is retrieved among the top N neighbours—and are averaged over the entire dataset. We also compare to a random baseline, for which a concept’s nearest neighbours list is obtained by randomly ranking the list of target words.
Since the cross-modal map allows us to obtain property vectors for any concept, we were also able to evaluate these semantic representations on a stan-dard NLP task, such as the well known conceptual similarity and relatedness task. The MEN test col-lection (Bruni et al., 2014) contains human similar-ity ratings for 3000 concept pairs. Performance on this dataset is usually measured by computing the Spearman ρs correlation between the ranking pro-duced by the similarity scores of the learnt property vectors and that produced by the human-annotated concept similarity scores. Similarity between con-cept pairs is calculated using cosine similarity.
For each of the semantic spaces presented in Table 5 we learn a cross-modal map toPROPNORM using
all the concepts in MCRAE at training time.
Dur-ing testDur-ing, we predict property vectors for all con-cepts inMEN-NOUNS, a subset of the MEN dataset
consisting of 1285 noun pairs that don’t occur in
MCRAE. Table 5 reports the Spearman ρs correla-tion of the predicted property vectors and the gold-standard relatedness scores on MEN-NOUNS
From P@1 P@5 P@10 P@20
DISTRIB 1.30 6.88 16.54 26.58
SVD 2.79 22.12 38.10 57.99
EMBED 3.90 23.42 36.80 55.02
VISUAL 3.35 28.44 47.96 64.50 VISUAL+DISTRIB 2.60 23.23 39.41 56.13
VISUAL+SVD 2.97 28.44 50.74 65.43
VISUAL+EMBED 3.16 28.44 51.12 65.06
[image:5.612.80.290.60.204.2]RANDOM 0.0 0.74 2.42 3.90
Table 4: Zero-shot learning performance when map-ping to the property-norm space (PROPNORM)
Semantic space (SS) SS →PROPNORM
Linguistic
DISTRIB 0.68 0.42
SVD 0.68 0.58
EMBED 0.75 0.69
Visual VISUAL 0.56 0.60
Multi-modal
DISTRIB+VISUAL 0.56 0.45 SVD+VISAL 0.57 0.60 EMBED+VISUAL 0.56 0.60 Table 5: Performance (Spearmanρscorrelation) of various uni-modal and multi-modal semantic spaces (columnSS), together with that of the property
vec-tors they predict (column →PROPNORM) on a
se-mantic relatedness task (MEN-NOUNS)
original semantic spaces (e.g. DISTRIBorSVD) and
the gold standard scores (columnSS).
3.3 Quantitative results
The results presented in Table 4 show that visual in-formation is a overall better predictor of a concept’s properties than linguistic information. The cross-modal maps from the visual space VISUAL
outper-form all those from linguistic spacesDISTRIB,SVD, EMBED, and the addition of linguistic information
to the visual one (maps fromVISUAL+DISTRIB,VI -SUAL+SVD,VISUAL+EMBED) seem to only slightly
improve the performance.
It is also important to point out that, even though the P@1 numbers may appear small, similar results have been reported for other zero-shot cross-modal maps (Lazaridou et al., 2014; Kiela et al., 2015). Overall results are good for higher values of N and
the qualitative results (Table 6) demonstrate how well the mapping is performing.
A model will achieve a perfect score on this task if it is able to predict, for a given concept, exactly those features (and associated production frequen-cies) listed in MCRAE. However, close-to-perfect
performance in this task is impossible, since almost 30% of the features only occur with one concept, and hence can’t be reconstructed for that particular concept. Consider the case of thea baby deer prop-erty: this only occurs in the MCRAE dataset as an
attribute of FAWN. When predicting properties of FAWN as part of the zero-shot learning procedure,
the a baby deerproperty can’t be learned, since it doesn’t occur with any other concept.
Columns SS and →PROPNORM in Table 5
re-port correlations with theMEN-NOUNSratings. The
predicted property vectors obtain a high correlation with the MEN scores, showing that the property vec-tors do capture lexical similarity well, although not as well as the linguistic vectors, which was expected (Bruni et al., 2012). An useful finding is that in some cases, the predicted property vectors obtain a better correlation with the MEN scores than their predic-tors (i.e. theVISUALand multi-modal vectors). This
shows a potential strength of the attribute-centric se-mantic representations: their capability to perform better on some lexical similarity/relatedness tasks than representations that contain raw perceptual in-formation.
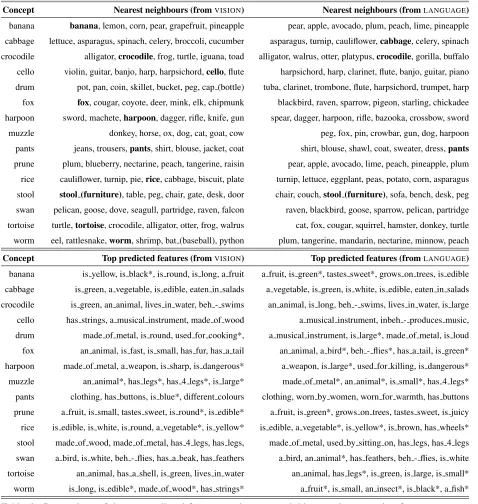
3.4 Qualitative results
In order to gain more insight into the differences be-tween thefrom visionandfrom languagemappings, we performed two types of qualitative analysis: we looked at the differences in nearest neighbours of the predicted property-norm representations (Table 6), as well as the top predicted properties of a concept (Table 6). In thefrom language setting we learned the mapping using the EMBED space, as it was the
in-Concept Nearest neighbours (fromVISION) Nearest neighbours (fromLANGUAGE)
banana banana, lemon, corn, pear, grapefruit, pineapple pear, apple, avocado, plum, peach, lime, pineapple cabbage lettuce, asparagus, spinach, celery, broccoli, cucumber asparagus, turnip, cauliflower,cabbage, celery, spinach crocodile alligator,crocodile, frog, turtle, iguana, toad alligator, walrus, otter, platypus,crocodile, gorilla, buffalo cello violin, guitar, banjo, harp, harpsichord,cello, flute harpsichord, harp, clarinet, flute, banjo, guitar, piano drum pot, pan, coin, skillet, bucket, peg, cap (bottle) tuba, clarinet, trombone, flute, harpsichord, trumpet, harp fox fox, cougar, coyote, deer, mink, elk, chipmunk blackbird, raven, sparrow, pigeon, starling, chickadee harpoon sword, machete,harpoon, dagger, rifle, knife, gun spear, dagger, harpoon, rifle, bazooka, crossbow, sword muzzle donkey, horse, ox, dog, cat, goat, cow peg, fox, pin, crowbar, gun, dog, harpoon pants jeans, trousers,pants, shirt, blouse, jacket, coat shirt, blouse, shawl, coat, sweater, dress,pants
prune plum, blueberry, nectarine, peach, tangerine, raisin pear, apple, avocado, lime, peach, pineapple, plum rice cauliflower, turnip, pie,rice, cabbage, biscuit, plate turnip, lettuce, eggplant, peas, potato, corn, asparagus stool stool (furniture), table, peg, chair, gate, desk, door chair, couch,stool (furniture), sofa, bench, desk, peg swan pelican, goose, dove, seagull, partridge, raven, falcon raven, blackbird, goose, sparrow, pelican, partridge tortoise turtle,tortoise, crocodile, alligator, otter, frog, walrus cat, fox, cougar, squirrel, hamster, donkey, turtle worm eel, rattlesnake,worm, shrimp, bat (baseball), python plum, tangerine, mandarin, nectarine, minnow, peach
Concept Top predicted features (fromVISION) Top predicted features (fromLANGUAGE)
[image:6.612.71.549.61.565.2]banana is yellow, is black*, is round, is long, a fruit a fruit, is green*, tastes sweet*, grows on trees, is edible cabbage is green, a vegetable, is edible, eaten in salads a vegetable, is green, is white, is edible, eaten in salads crocodile is green, an animal, lives in water, beh - swims an animal, is long, beh - swims, lives in water, is large cello has strings, a musical instrument, made of wood a musical instrument, inbeh - produces music, drum made of metal, is round, used for cooking*, a musical instrument, is large*, made of metal, is loud fox an animal, is fast, is small, has fur, has a tail an animal, a bird*, beh - flies*, has a tail, is green* harpoon made of metal, a weapon, is sharp, is dangerous* a weapon, is large*, used for killing, is dangerous* muzzle an animal*, has legs*, has 4 legs*, is large* made of metal*, an animal*, is small*, has 4 legs* pants clothing, has buttons, is blue*, different colours clothing, worn by women, worn for warmth, has buttons prune a fruit, is small, tastes sweet, is round*, is edible* a fruit, is green*, grows on trees, tastes sweet, is juicy rice is edible, is white, is round, a vegetable*, is yellow* is edible, a vegetable*, is yellow*, is brown, has wheels* stool made of wood, made of metal, has 4 legs, has legs, made of metal, used by sitting on, has legs, has 4 legs swan a bird, is white, beh - flies, has a beak, has feathers a bird, an animal*, has feathers, beh - flies, is white tortoise an animal, has a shell, is green, lives in water an animal, has legs*, is green, is large, is small* worm is long, is edible*, made of wood*, has strings* a fruit*, is small, an insect*, is black*, a fish*
Table 6: Comparison of the top predicted features and nearest neighbours when mapping from VISIONor
fromLANGUAGE. Properties marked with * don’t appear as attributes of the associated concept inMCRAE.
specting the nearest neighbour predictions, we can check where the unseen concept is mapped to (e.g.
BANANA is mapped close to yellow fruits). In
or-der to retrieve the top predicted properties of a con-cept, we rank the dimensions ofPROPNORM
accord-ing to the weights in the predicted property vector (e.g. the predicted property vector forBANANAhas
high weights for a fruit and is green when mapped from language).
con-cepts that are semantically related or denoted by words that occur in the same context as the target concept (e.g. worms are found in plums and nec-tarines).
A notable result is that when mapping from vi-sion, the top neighbours tend to share the same colour (top neighbours for BANANA are yellow
fruits, for SWAN are white birds) or shape as the
target concept (top neighbours for WORM are long
things with no legs). One possible clue as to why vision is better at predicting a concept’s properties is given by the fact that it obtains better results on concepts such as PANTS orSTOOL, where the only
difference to very similar concepts like TROUSERS
or CHAIR are visual (a STOOL has no backrest as
opposed to aCHAIR).
However, there are cases in which the visual at-tributes of an object are not very useful in predicting its most important features: e.g. DRUM is mapped
into a subspace of round objects (from vision), and not instruments (from language).
Besides the difference in top predicted features, Table 6 also indicates a shortcoming of MCRAE,
specifically that this is not complete, meaning that not all properties that apply to a given concept were produced by the human annotators. Most of the top predicted attributes that don’t occur in the dataset (those marked with * in Table 6) are highly plausi-ble properties for the given concepts: tastes sweet
for BANANA orhas legs for TORTOISE. This also
means that the model is being unfairly penalised. In order to obtain acompleteversion of MCRAE,
every possible (CONCEPT, property) pair would
have to be checked for validity and annotated ac-cordingly depending on whetherpropertyis a valid attribute ofCONCEPT.
3.5 Importance of complete data
We were interested in measuring the impact that a complete dataset of features would have on the performance of the cross-modal zero-shot learning task. Silberer et al. (2013) conducted a study using a subset of the concepts and properties in MCRAE,
whereby every property was annotated if it was a plausible attribute of the concept.
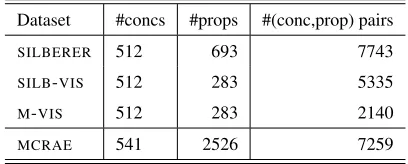
The published dataset (SILBERER) consists of
vi-sual attribute annotations for 512 concepts (that also occur inMCRAE) and 693 visual properties. The
an-Dataset #concs #props #(conc,prop) pairs
SILBERER 512 693 7743
SILB-VIS 512 283 5335
M-VIS 512 283 2140
[image:7.612.324.528.61.143.2]MCRAE 541 2526 7259
Table 7: Comparison of various datasets, according to the number of concepts and properties covered, as well as the pairs of (CONCEPT,property) contained
Train Test P@1 P@5 P@10 P@20
M-VIS M-VIS 0.59 7.91 15.02 19.97
M-VIS SILB-VIS 7.11 27.67 43.68 56.92
SILB-VIS SILB-VIS 5.93 35.77 54.74 71.54
Table 8: Zeroshot learning performance for the vi-sion to norms cross-modal map on different training and test sets
notation was done on a per-concept basis by looking at 10 images retrieved from ImageNet (Deng et al., 2009) and selecting all the attributes that were con-sidered to be generally true for the given concept, even if not depicted in the images. For example,
has a pitis a valid visual attribute for PLUM, even
though not all retrieved images of plums show the pit.
Since not all of the 693 visual properties covered inSILBERERcan be found inMCRAE, we will only
be concerned with the subset of SILBERER which
contains only those visual properties that also occur inMCRAE, henceforthSILB-VIS. These datasets are complete, since they were exhaustively annotated as explained above.
Let us also defineM-VISas the subset ofMCRAE
that contains the 512 concepts listed in SILBERER
and the 283 properties that are common to SIL -BERER and MCRAE, together with their
produc-tion frequencies as in MCRAE. This will act as
ourincomplete dataset. Table 7 lists all the afore-mentioned datasets, together with statistics related to their number of concepts, features and concept-feature pairs. It also demonstrates the sparsity of
MCRAE: it contains fewer (CONCEPT, property)
pairs than SILBERER, even though it contains 4
times more properties.
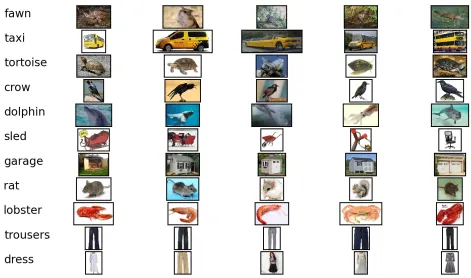
Figure 1: Nearest neighbours of the predicted visual vectors
datasets are listed in Table 8. These are identical in methodology to the zero-shot cross-modal maps fromVISUALtoPROPNORM; the only difference
be-ing the datasets that these are run on.
The row (train:M-VIS, test:M-VIS) represents the
setting where the cross-modal map learning and test-ing are both done on the incomplete set of data, just like we would do using MCRAE. We notice a huge
improvement in performance by using the complete data only at test-time (row (train:M-VIS, test:SILB -VIS)). Note that, in this scenario, the learning is
carried out in the same way, but the model can’t be penalised for ranking plausible features near the top during test time, since we are testing against a complete dataset. This new setting provides a truer evaluation scenario and demonstrates the weakness in usingMCRAEas a test set.
Performance improves even more if the complete dataset is used at training time as well (the row (train:SILB-VIS, test:SILB-VIS)), showing the
bene-fit of also learning the mapping from complete data, as well as evaluating on it.
From P@1 P@5 P@10 P@20 P@50
PROPNORM 6.13 36.43 54.46 68.40 81.97 DISTRIB 4.08 10.78 17.29 26.21 40.89
SVD 7.81 34.57 47.77 60.60 79.00
[image:8.612.80.551.62.340.2]EMBED 9.48 31.60 47.21 62.08 78.81
Table 9: Zero-shot learning performance when map-ping to the visual space (VISUAL)
4 Property based query engine
An interesting question follows from the good per-formance of the cross-modal mapping in Section 3, and that is whether we can reliably predict what con-cepts look like based on their semantic properties. For example, does something that flies, has wings and a beak look like a bird?
This task could be formalised as a property-based query engine, where we can train the cross-modal mapping to learn which concepts refer to which im-ages. We follow the same experimental setup as detailed in Section 3.2 in order to learn a cross-modal map from PROPNORM toVISUAL. We also
(DISTRIB, SVD, EMBED) toVISUALin order to see
whether conceptual properties or linguistic input are better at predicting visual information.
Table 9 shows the results of our quantitative eval-uation: the average precentage of correctly retrieved mean visual representations at N.
A qualitative analysis of the PROPNORM to VI -SUAL cross-modal map is shown in Figure 1.
Be-cause there are no images associated with the predicted mean visual representation, we retrieve and display the top neighbouring images. These images look surprisingly good, considering that the representation for TAXI in PROPNORM is a
sparse vector where only the features is yellow, requires drivers, used for transportation, a car, requires money, found in New York, is expensive, used for passengers, a cab, is fastare activated.
5 Conclusions
We have studied the automatic prediction of prop-erty norms for unseen concepts, through learning the cross-modal mapping from image data. Following previous work, we evaluated on a zero-shot learning task and show that raw visual information (images) is a better predictor for conceptual properties than linguistic input (text). We also presented a short case study demonstrating the importance of having com-plete annotations in the property norm datasets, for both testing and training. Lastly, we demonstrated a possible use case for property norm datasets in an image retrieval task.
Our contributions are two-fold: first, we show that property norms can be successfully predicted from non-linguistic modalities and secondly, we quantify the need to have complete property norm datasets, where a production frequency of 0 for a (CONCEPT, property) pair can always be interpreted as “property
is not true ofCONCEPT”.
Acknowledgments
LB is supported by an EPSRC Doctoral Train-ing Grant. DK is supported by EPSRC grant EP/I037512/1. SC is supported by ERC Start-ing Grant DisCoTex (306920) and EPSRC grant EP/I037512/1. We thank the anonymous review-ers for their helpful comments. A link to the data used for the experiments in this paper is available at
http://www.cl.cam.ac.uk/˜ltf24/.
References
Mark Andrews, Gabriella Vigliocco, and David Vinson. 2009. Integrating experiential and distributional data to learn semantic representations. Psychological re-view, 116(3):463.
Eduard Barbu. 2008. Combining methods to learn feature-norm-like concept descriptions. In Proceed-ings of the ESSLLI Workshop on Distributional Lexical Semantics, pages 9–16.
Marco Baroni, Brian Murphy, Eduard Barbu, and Mas-simo Poesio. 2010. Strudel: A corpus-based semantic model based on properties and types. Cognitive Sci-ence, 34(2):222–254.
Shane Bergsma and Randy Goebel. 2011. Using visual information to predict lexical preference. InRANLP, pages 399–405.
Elia Bruni, Gemma Boleda, Marco Baroni, and Nam-Khanh Tran. 2012. Distributional semantics in tech-nicolor. In Proceedings of the 50th Annual Meet-ing of the Association for Computational LMeet-inguistics: Long Papers-Volume 1, pages 136–145. Association for Computational Linguistics.
Elia Bruni, Nam-Khanh Tran, and Marco Baroni. 2014. Multimodal distributional semantics. J. Artif. Intell. Res.(JAIR), 49(1-47).
Stephen Clark. 2015. Vector space models of lexi-cal meaning. Handbook of Contemporary Semantics– second edition. Wiley-Blackwell.
George S Cree, Chris McNorgan, and Ken McRae. 2006. Distinctive features hold a privileged status in the com-putation of word meaning: Implications for theories of semantic memory. Journal of Experimental Psychol-ogy: Learning, Memory, and Cognition, 32(4):643. Jia Deng, Wei Dong, Richard Socher, Li-Jia Li, Kai Li,
and Li Fei-Fei. 2009. Imagenet: A large-scale hier-archical image database. InComputer Vision and Pat-tern Recognition, 2009. CVPR 2009. IEEE Conference on, pages 248–255. IEEE.
Barry J Devereux, Lorraine K Tyler, Jeroen Geertzen, and Billi Randall. 2013. The centre for speech, language and the brain (cslb) concept property norms.Behavior research methods, pages 1–9.
Andrea Frome, Greg S Corrado, Jon Shlens, Samy Ben-gio, Jeff Dean, Tomas Mikolov, et al. 2013. De-vise: A deep visual-semantic embedding model. In
Advances in Neural Information Processing Systems, pages 2121–2129.
Stevan Harnad. 1990. The symbol grounding problem.
Physica D: Nonlinear Phenomena, 42(1):335–346. Felix Hill and Anna Korhonen. 2014. Learning abstract
concept embeddings from multi-modal data: Since you probably cant see what i mean. Proceedings of EMNLP. ACL.
Yangqing Jia, Evan Shelhamer, Jeff Donahue, Sergey Karayev, Jonathan Long, Ross Girshick, Sergio Guadarrama, and Trevor Darrell. 2014. Caffe: Con-volutional architecture for fast feature embedding. In
Proceedings of the ACM International Conference on Multimedia, pages 675–678. ACM.
Colin Kelly, Barry Devereux, and Anna Korhonen. 2014. Automatic extraction of property norm-like data from large text corpora.Cognitive Science, 38(4):638–682. Douwe Kiela and L´eon Bottou. 2014. Learning image embeddings using convolutional neural networks for improved multi-modal semantics. In Proceedings of EMNLP, volume 2014.
Douwe Kiela, Luana Bulat, and Stephen Clark. 2015. Grounding semantics in olfactory perception. In Pro-ceedings of ACL, volume 2, pages 231–6.
Angeliki Lazaridou, Elia Bruni, and Marco Baroni. 2014. Is this a wampimuk? Cross-modal mapping between distributional semantics and the visual world. In
Proceedings of the 52nd Annual Meeting of the As-sociation for Computational Linguistics (Volume 1: Long Papers), pages 1403–1414, Baltimore, Mary-land, June. Association for Computational Linguistics. Ken McRae, George S Cree, Mark S Seidenberg, and Chris McNorgan. 2005. Semantic feature production norms for a large set of living and nonliving things.
Behavior research methods, 37(4):547–559.
Tomas Mikolov, Kai Chen, Greg Corrado, and Jeffrey Dean. 2013a. Efficient estimation of word representa-tions in vector space. arXiv preprint arXiv:1301.3781. Tomas Mikolov, Quoc V Le, and Ilya Sutskever. 2013b. Exploiting similarities among languages for machine translation. arXiv preprint arXiv:1309.4168.
Mark Palatucci, Dean Pomerleau, Geoffrey E Hinton, and Tom M Mitchell. 2009. Zero-shot learning with se-mantic output codes. InAdvances in neural informa-tion processing systems, pages 1410–1418.
Billi Randall, Helen E Moss, Jennifer M Rodd, Mike Greer, and Lorraine K Tyler. 2004. Distinctive-ness and correlation in conceptual structure: behav-ioral and computational studies. Journal of Experi-mental Psychology: Learning, Memory, and Cogni-tion, 30(2):393.
Brian Riordan and Michael N Jones. 2011. Redun-dancy in perceptual and linguistic experience: Com-paring feature-based and distributional models of se-mantic representation. Topics in Cognitive Science, 3(2):303–345.
Stephen Roller and Sabine Schulte Im Walde. 2013. A multimodal lda model integrating textual, cogni-tive and visual modalities. Seattle, Washington, USA, pages 1146–1157.
Carina Silberer and Mirella Lapata. 2012. Grounded models of semantic representation. In Proceedings of the 2012 Joint Conference on Empirical Methods in Natural Language Processing and Computational Natural Language Learning, pages 1423–1433. Asso-ciation for Computational Linguistics.
Carina Silberer, Vittorio Ferrari, and Mirella Lapata. 2013. Models of semantic representation with visual attributes. InACL (1), pages 572–582.
Richard Socher, Andrej Karpathy, Quoc V Le, Christo-pher D Manning, and Andrew Y Ng. 2014. Grounded compositional semantics for finding and describing images with sentences. Transactions of the Associa-tion for ComputaAssocia-tional Linguistics, 2:207–218. Peter D Turney and Patrick Pantel. 2010. From
fre-quency to meaning: Vector space models of semantics.
Journal of artificial intelligence research, 37(1):141– 188.
Lorraine K Tyler, HE Moss, MR Durrant-Peatfield, and JP Levy. 2000. Conceptual structure and the structure of concepts: A distributed account of category-specific deficits.Brain and language, 75(2):195–231.