Nuggeteer: Automatic Nugget-Based Evaluation
using Descriptions and Judgements
Gregory Marton Alexey Radul
Infolab Group, MIT CSAIL Cambridge, MA 02139 {gremio,axch}@mit.edu
Abstract
The TREC Definition and Relationship questions are evaluated on the basis of in-formation nuggets that may be contained in system responses. Human evalua-tors provide informal descriptions of each nugget, and judgements (assignments of nuggets to responses) for each response submitted by participants. While human evaluation is the most accurate way to compare systems, approximate automatic evaluation becomes critical during system development.
We present Nuggeteer, a new automatic evaluation tool for nugget-based tasks. Like the first such tool, Pourpre, Nugge-teer uses words in common between can-didate answer and answer key to approx-imate human judgements. Unlike Pour-pre, but like human assessors, Nuggeteer creates a judgement for each candidate-nugget pair, and can use existing judge-ments instead of guessing. This cre-ates a more readily interpretable aggregate score, and allows developers to track in-dividual nuggets through the variants of their system. Nuggeteer is quantitatively comparable in performance to Pourpre, and provides qualitatively better feedback to developers.
1 Introduction
The TREC Definition and Relationship questions are evaluated on the basis of information nuggets, abstract pieces of knowledge that, taken together, comprise an answer. Nuggets are described infor-mally, with abbreviations, misspellings, etc., and each is associated with an importance judgement: ‘vital’ or ‘okay’.1 In some sense, nuggets are like WordNet synsets, and their descriptions are like glosses. Responses may contain more than one nugget—when they contain more than one piece of knowledge from the answer. The median scores of today’s systems are frequently zero; most responses contain no nuggets (Voorhees, 2005).
Human assessors decide what nuggets make up an answer based on some initial research and on pools of top system responses for each question. Answer keys list, for each nugget, its id, importance, and description; two example answer keys are shown in Figures 1 and 2. Assessors make binary deci-sions about each response, whether it contains each nugget. When multiple responses contain a nugget, the assessor gives credit only to the (subjectively) best response.
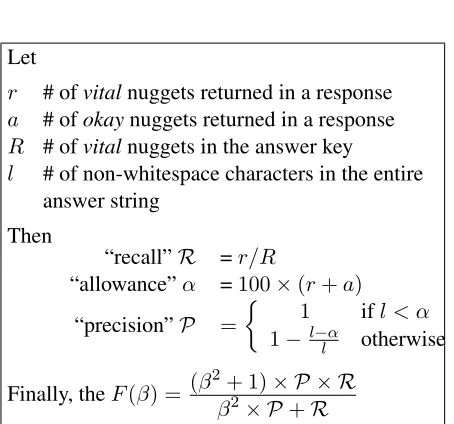
Using the judgements of the assessors, the fi-nal score combines the recall of the available vi-tal nuggets, and the length (discounting whitespace) of the system response as a proxy for precision. Nuggets valued ‘okay’ contribute to precision by in-creasing the length allowance, but do not contribute to recall. The scoring formula is shown in Figure 3.
1Nuggeteer implements the pyramidscoring system from (Lin and Demner-Fushman, 2006), designed to soften the
Qid 87.8: ’other’ question for target Enrico Fermi
1 vital belived in partical’s existence and named it neutrino 2 vital Called the atomic Bomb an evil thing
3 okay Achieved the first controlled nuclear chain reaction 4 vital Designed and built the first nuclear reactor
5 okay Concluded that the atmosphere was in no real danger before Trinity test 6 okay co-developer of the atomic bomb
7 okay pointed out that the galaxy is 100,000 light years across
Figure 1: The “answer key” to an “other” question from 2005.
The analyst is looking for links between Colombian businessmen and paramilitary forces. Specif-ically, the analyst would like to know of evidence that business interests in Colombia are still funding the AUC paramilitary organization.
1 vital Commander of the national paramilitary umbrella organization claimed his group enjoys growing support from local and international businesses
2 vital Columbia’s Chief prosecutor said he had a list of businessmen who supported right-wing paramilitary squads and warned that financing outlawed groups is a criminal offense 3 okay some landowners support AUC for protections services
4 vital Rightist militias waging a dirty war against suspected leftists in Colombia enjoy growing support from private businessmen
5 okay The AUC makes money by taxing Colombia’s drug trade
[image:2.612.74.301.459.671.2]6 okay The ACU is estimated to have 6000 combatants and has links to government security forces. 7 okay Many ACU fighters are former government soldiers
Figure 2: The “answer key” to a relationship question.
Let
r # ofvitalnuggets returned in a response a # ofokaynuggets returned in a response R # ofvitalnuggets in the answer key
l # of non-whitespace characters in the entire
answer string Then
“recall”R =r/R
“allowance”α =100×(r+a)
“precision”P =
! 1
ifl < α
1−l−lα otherwise
Finally, theF(β) = (β
2+ 1)× P × R
β2× P+R
Figure 3: Official definition of F-measure.
Automatic evaluation of systems is highly desir-able. Developers need to know whether one sys-tem performs better or worse than another. Ideally, they would like to know which nuggets were lost or gained. Because there is no exhaustive list of snip-pets from the document collection that contain each nugget, an exact automatic solution is out of reach. Manual evaluation of system responses is too time consuming to be effective for a development cycle.
The Qaviar system first described an approximate automatic evaluation technique using keywords, and Pourpre was the first publicly available implemen-tation for these nugget-based tasks. (Breck et al., 2000; Lin and Demner-Fushman, 2005). Pourpre calculates anidf- or count-based, stemmed, unigram similarity between each nugget description and each
candidate system response. If this similarity passes a threshold, then it uses this similarity to assign a par-tial value for recall and a parpar-tial length allowance, reflecting the uncertainty of the automatic judge-ment. Importantly, it yields a ranking of systems very similar to the official ranking (See Table 2).
Nuggeteer offers three important improvements:
• interpretability of the scores, as compared to official scores,
• use of known judgements for exact information about some responses, and
• information about individual nuggets, for de-tailed error analysis.
Nuggeteer makes scores interpretable by making binary decisions about each nugget and each system response, just as assessors do, and then calculating the final score in the usual way. We will show that Nuggeteer’s absolute error is comparable to human error, and that the 95% confidence intervals Nugge-teer reports are correct around 95% of the time.
Nuggeteer assumes that if a system response was ever judged by a human assessor to contain a partic-ular nugget, then other identical responses also con-tain that nugget. When this is not true among the hu-man judgements, we claim it is due to annotator er-ror. This assumption allows developers to add their own judgements and have the responses they’ve ad-judicated scored “exactly” by Nuggeteer.
These features empower developers to track not only the numeric value of a change to their system, but also its effect on retrieval of each nugget.
2 Approach
Nuggeteer builds one binary classifier per nugget for each question, based on n-grams (up to trigrams)
in the description and optionally in any provided judgement files. The classifiers use a weight for each n-gram, an informativeness measure for each n-gram, and a threshold for accepting a response as bearing the nugget.
2.1 N-gram weight
Theidf-based weight for ann-gramw1...wnis the sum of unigram idf counts from the AQUAINT corpus of English newspaper text, the corpus from
which responses for the TREC tasks are drawn. We did not explore usingn-gramidfs. Atfcomponent is not meaningful because the data are so sparse.
2.2 Informativeness
Let G be the set of nuggets for some question. Infor-mativeness of ann-gram for a nuggetgis calculated based on how many other nuggets in that question (∈G) contain then-gram. Let
i(g, w1...wn) =
!
1 ifcount(g, w1..wn)>0
0 otherwise
(1) where count(g, w1...wn) is the number of occur-rences of the n-gram in responses containing the
nuggetg.
Then informativeness is:
I(g, w1...wn) = 1−
"
g!∈Gi(g#, w1...wn) |G| (2)
This captures the Bayesian intuition that the more outcomes a piece of evidence is associated with, the less confidence we can have in predicting the out-come based on that evidence.
2.3 Judgement
Nuggeteer does not guess on responses which have been judged by a human to contain a nugget, or those which have unambiguously judged not to, but as-signs the known judgement.2
For unseen responses, we determine the n-gram recall for each nugget g and candidate response w1...wlby breaking the candidate inton-grams and finding the sum of scores:
Recall(g, w1...wl) = (3) n−1
#
k=0
l−k
#
i=0
W(g, wi...wi+k)∗I(g, wi...wi+k)
way, we build ann-gram language model for each
nugget, and assign those nuggets whose predicted likelihood exceeds a threshold.
When several responses contain a nugget, Nugge-teer picks thefirst (instead of the best, as assessors can) for purposes of scoring.
2.4 Parameter Estimation
We explored a number of parameters in the scor-ing function: stemmscor-ing, n-gram size, idf weights vs. count weights, and the effect of removing stop-words. We tested all 24 combinations, and for each experiment, we cross-validated by leaving out one submitted system, or where possible, one submitting institution (to avoid training and testing on poten-tially very similar systems).3
Each experiment was performed using a range of thresholds for Equation 3 above, and we se-lected the best performing threshold for each data set.4 Because the threshold was selected after cross-validation, it is exposed to overtraining. We used a single global threshold to minimize this risk, but we have no reason to think that the thresholds for differ-ent nuggets are related.
Selecting thresholds as part of the training process can maximize accuracy while eliminating overtrain-ing. We therefore explored Bayesian models for au-tomatic threshold selection. We model assignment of nuggets to responses as caused by the scores ac-cording to a noisy threshold function, with separate false positive and false negative error rates. We var-ied thresholds and error rates by entire dataset, by question, or by individual nugget, evaluating them using Bayesian model selection.
3 The Data
For our experiments, we used the definition ques-tions from TREC2003, the ‘other’ quesques-tions from TREC2004 and TREC2005, and the relation-ship questions from TREC2005. (Voorhees, 2003; Voorhees, 2004; Voorhees, 2005) The distribution of nuggets and questions is shown for each data set in Table 1. The number of nuggets by number of 3For TREC2003 and TREC2004, the run-tags indicate the submitting institution. For TREC2005 we did not run the non-anonymized data in time for this submission. In the TREC2005 Relationship task, RUN-1 was withdrawn.
4Thresholds for Pourpre were also selected this way.
0 0.05 0.1 0.15 0.2 0.25 0.3
0 2 4 6 8 10 12 14 16 18 20 22 24 26 28 !30
[image:4.612.322.548.68.243.2]D2003 / 54 O2004 / 63 O2005 / 72 R2005 / 10
Figure 4: Percents of nuggets, binned by the number of systems that found each nugget.
system responses assigned that nugget (difficulty of nuggets, in a sense) is shown in Figure 4. More than a quarter of relationship nuggets were not found by any system. Among all data sets, many nuggets were found in none or just a few responses.
4 Results
We report correlation (R2), and Kendall’sτb, follow-ing Lin and Demner-Fushman. Nuggeteer’s scores are in the same range as real system scores, so we also report average root mean squared error from the official results. We ‘corrected’ the official judge-ments by assigning a nugget to a response if that response was judged to contain that nugget in any assessment for any system.
4.1 Comparison with Pourpre
(Lin et al., 2005) report Pourpre and Rouge perfor-mance with Pourpre optimal thresholds for TREC definition questions, as reproduced in Table 2. Nuggeteer’s results are shown in the last column.5
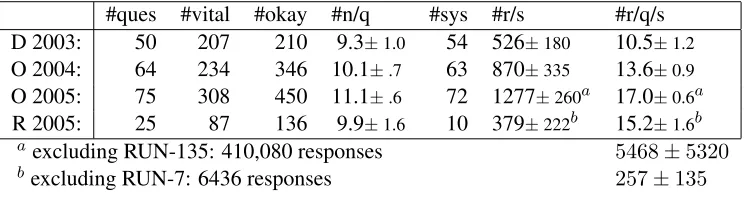
#ques #vital #okay #n/q #sys #r/s #r/q/s D 2003: 50 207 210 9.3±1.0 54 526±180 10.5±1.2
O 2004: 64 234 346 10.1±.7 63 870±335 13.6±0.9
O 2005: 75 308 450 11.1±.6 72 1277±260a 17.0±0.6a
R 2005: 25 87 136 9.9±1.6 10 379±222b 15.2±1.6b
aexcluding RUN-135: 410,080 responses 5468±5320
[image:5.612.121.493.60.159.2]bexcluding RUN-7: 6436 responses 257±135
Table 1: For each data set (D=“definition”, O=“other”, R=“relationship”), the number of questions, the numbers of vital and okay nuggets, the average total number of nuggets per question, the number of par-ticipating systems, the average number of responses per system, and the average number of responses per question over all systems.
POURPRE ROUGE NUGGETEER
Run micro, cnt macro, cnt micro,idf macro,idf default stop nostem, bigram,micro,
idf
D 2003 (β = 3) 0.846 0.886 0.848 0.876 0.780 0.816 0.879
D 2003 (β = 5) 0.890 0.878 0.859 0.875 0.807 0.843 0.849
O 2004 (β = 3) 0.785 0.833 0.806 0.812 0.780 0.786 0.898
O 2005 (β = 3) 0.598 0.709 0.679 0.698 0.662 0.670 0.858
[image:5.612.75.297.416.514.2]R 2005 (β = 3) 0.697 1
Table 2: Kendall’sτ correlation between rankings generated by POURPRE/ROUGE/NUGGETEERand
offi-cial scores, for each data set (D=“definition”, O=“other”, R=“relationship”). τ=1 means same order,τ=-1
means reverse order. Pourpre and Rouge scores reproduced from (Lin and Demner-Fushman, 2005).
POURPRE NUGGETEER
Run R2 R2 √mse
D 2003 (β= 3) 0.963 0.966 0.067 D 2003 (β= 5) 0.965 0.971 0.077
O 2004 (β= 3) 0.929 0.982 0.026
O 2005 (β= 3) 0.916 0.952 0.026 R 2005 (β = 3) 0.764 0.993 0.009
Table 3: Correlation (R2) and Root Mean Squared
Error (√mse) between scores generated by
Pour-pre/Nuggeteer and official scores, for the same set-tings as theτ comparison above.
pected from the Kendall’sτ comparisons, Pourpre’s
correlation is about the same or higher in 2003, but fares progressively worse in the subsequent tasks.
To ensure that Pourpre scores correlated suf-ficiently with official scores, Lin and Demner-Fushman used the difference in official score be-tween runs whose ranks Pourpre had swapped, and showed that the majority of swaps were between
runs whose official scores were less than the 0.1 apart, a threshold for assessor agreement reported in (Voorhees, 2003).
Nuggeteer scores are not only correlated with, but actually meant to approximate, the assessment scores; thus we can use a stronger evaluation: root mean squared error of Nuggeteer scores against of-ficial scores. This estimates the average difference between the Nuggeteer score and the official score, and at 0.077, the estimate is below the 0.1 thresh-old. This evaluation is meant to show that the scores are “good enough” for experimental evalua-tion, and in Section 4.4 we will substantiate Lin and Demner-Fushman’s observation that higher correla-tion scores may reflect overtraining rather than ac-tual improvement.
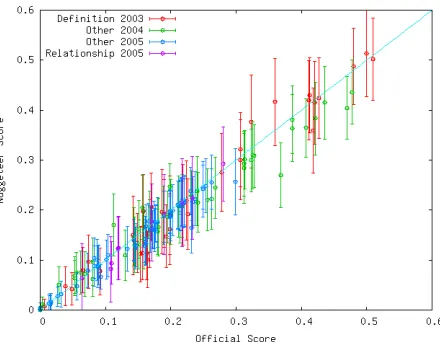
Accordingly, rather than reporting the best Nuggeteer scores (Kendall’s τ and R2) above, we
par-Figure 5: Scatter graph of official scores plot-ted against Nuggeteer scores (idf term weighting, no stemming, bigrams) for each data set (all F-measures have β = 3), with the Nuggeteer 95%
confidence intervals on the score. Across the four datasets, 6 systems (3%) have an official score out-side Nuggeteer’s 95% confidence interval.
ticular thresholds for each year are experimentally optimized. A scatter plot of Nuggeteer performance on the definition tasks is shown in Figure 5.
4.2 N-gram size and stemming
A hypothesis advanced with Pourpre is that bigrams, trigrams, and longern-grams will primarily account for the fluency of an answer, rather than its semantic content, and thus not aid the scoring process. We included the option to use longer n-grams within Nuggeteer, and have found that using bigrams can yield very slightly better results than using uni-grams. From inspection, bigrams sometimes capture named entity and grammatical order features.
Experiments with Pourpre showed that stemming hurt slightly at peak performances. Nuggeteer has the same tendency at alln-gram sizes.
Figure 6 compares Kendall’s τ over the possi-ble thresholds,n-gram lengths, and stemming. The
choice of threshold matters by far the most.
4.3 Term weighting and stopwords
[image:6.612.318.532.58.224.2]Removing stopwords or giving unit weight to all terms rather than anidf-based weight made no sub-stantial difference in Nuggeteer’s performance.
Figure 6: Fixed thresholds vs. Kendall’sτ for uni-grams, biuni-grams, or trigrams averaged over the three years of definition data usingF(β = 3).
Model log10P(Data|Model)
optimally biased coin -2780
global threshold -2239
per-question thresholds -1977 per-nugget thresholds -1546
[image:6.612.78.298.62.233.2]per-nugget errors and thr. -1595
Table 4: The probabilities of the data given several models: a baseline coin, three models of different granularity with globally specified false positive and negative error rates, and a model with too many pa-rameters, where even the error rates have per-nugget granularity. We select the most probable model, the per-nugget threshold model.
4.4 Thresholds
We experimented with Bayesian models for auto-matic threshold selection. In the models, a system response contains or does not contain each nugget as a function of the response’s Nuggeteer score plus noise. Table 4 shows that, as expected, the best mod-els do not make assumptions about thresholds be-ing equal within a question or dataset. It is interest-ing to note that Bayesian inference catches the over-parametrization of the model where error rates vary per-nugget as well. In essence, we do not need those additional parameters to explain the variation in the data.
[image:6.612.318.537.291.377.2]nugget and global errors is 0.837 (√mse=0.037).
We have indeed overtrained the best threshold for this dataset (compareτ=0.879,√mse=0.067 in
Ta-bles 2 and 3), suggesting that the numeric differ-ences in Kendall’s Tau shown between the Nugge-teer, Pourpre, and Rouge systems are not indicative of true performance. The Bayesian model promises settings free of overtraining, and thus more accurate judgements in terms of√mseand individual nugget
classification accuracy.
4.5 Training on System Responses
Intuitively, if a fact is expressed by a system re-sponse, then another response with similarn-grams
may also contain the same fact. To test this intuition, we tried expanding our judgement method (Equa-tion 3) to select the maximum judgement score from among those of the nugget description and each of the system responses judged to contain that nugget.
Unfortunately, the assessors did not mark which portionof a response expresses a nugget, so we also find spurious similarity, as shown in Figure 7. The fi-nal results are not conclusively better or worse over-all, and the process is far more expensive.
We are currently exploring the same extension for multiple “nugget descriptions” generated by manu-ally selecting the appropriate portions of system re-sponses containing each nugget.
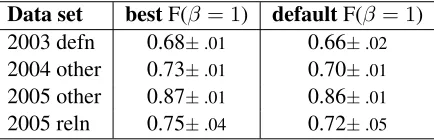
4.6 Judgment Precision and Recall
Because Nuggeteer makes a nugget classification for each system response, we can report precision and recall on the nugget assignments. Table 5 shows Nuggeteer’s agreement rate with assessors on whether each response contains a nugget.6
4.7 Novel Judgements
Approximate evaluation will tend to undervalue new results, simply because they may not have keyword overlap with existing nugget descriptions. We are therefore creating tools to help developers manually assess their system outputs.
As a proof of concept, we ran Nuggeteer on the best 2005 “other” system (not giving Nuggeteer 6Unlike human assessors, Nuggeteer is not able to pick the “best” response containing a nugget if multiple responses have it, and will instead pick thefirst, so these values are artifactually low. However, 2005 results may be high because these results reflect anonymized runs.
Data set bestF(β = 1) defaultF(β = 1)
2003 defn 0.68±.01 0.66±.02
2004 other 0.73±.01 0.70±.01
2005 other 0.87±.01 0.86±.01
[image:7.612.319.536.60.130.2]2005 reln 0.75±.04 0.72±.05
Table 5: Nuggeteer agreement with official judge-ments, under best settings for each year, and under the default settings.
the official judgements), and manualy corrected its guesses.7 Assessment took about 6 hours, and our judgements had precision of 78% and recall of 90%, for F-measure 0.803±0.065(compare Table 5). The
official score of .299 was still within the confidence interval, but now on the high side rather than the low (.257±.07), because we found the answers quite
good. In fact, we were often tempted to add new nuggets! We later learned that it was a manual run, produced by a student at the University of Maryland.
5 Discussion
Pourpre pioneered automatic nugget-based assess-ment for definition questions, and thus enabled a rapid experimental cycle of system development. Nuggeteer improves on that functionality, and crit-ically adds:
• an interpretable score, comparable to official scores, with near-human error rates,
• a reliable confidence interval on the estimated score,
• scoring known responses exactly,
• support for improving the accuracy of the score through additional annotation, and
• a more robust training process
We have shown that Nuggeteer evaluates the def-inition and relationship tasks with comparable rank swap rates to Pourpre. We explored the effects of stemming, term weighting, n-gram size, stopword
question id 1901,response rank2,response score0.14
response text: best american classical music bears its stamp: witness
aaron copland, whose "american-sounding" music was composed by a
(the response was a sentence fragment) assigned nugget description: born brooklyn ny 1900
bigram matches: “american classical”, “american-sounding music”, “best american”, “whose american-sounding”, “witness aaron”, “copland whose”, “stamp witness”, ...
response containing the nugget: Even the best American classical music bears its stamp: witness Aaron Copland, whose ‘‘American-sounding’’ music was composed by a Brooklyn-born Jew of Russian lineage who studied in France and salted his scores with jazz-derived syncopations, Mexican folk tunes and cowboy ballads.
NYT19981210.0106
Figure 7: This answer to the definition question on Aaron Copeland is assigned the nugget “born brooklyn ny 1900” at a recall score well above that of the background, despite containing none of those words.
briefly described a promising way to select finer-grained thresholds automatically.
Our experiences in using judgements of system responses point to the need for a better annotation of nugget content. It is possible to give Nuggeteer multiple nugget descriptions for each nugget. Man-ually extracting the relevant portions of correctly-judged system responses may not be an overly ardu-ous task, and may offer higher accuracy. It would be ideal if the community—including the assessors— were able to create and promulgate a gold-standard set of nugget descriptions for previous years.
Nuggeteer currently supports evaluation for the TREC definition, ‘other’, and relationship tasks, for the AQUAINT opinion pilot 8, and is under devel-opment for the DARPA GALE task9.
6 Acknowledgements
We would like to thank Jimmy Lin and Dina Demner-Fushman for valuable discussions, for Fig-ure 3, and Table 2, and for creating Pourpre. Thanks to Ozlem Uzuner and Sue Felshin for valuable com-ments on earlier drafts of this paper and to Boris Katz for his inspiration and support.
8http://www-24.nist.gov/projects/aquaint/opinion.html 9http://www.darpa.mil/ipto/programs/gale
References
Eric J. Breck, John D. Burger, Lisa Ferro, Lynette Hirschman, David House, Marc Light, and Inderjeet Mani. 2000. How to evaluate your question answer-ing system every day ... and still get real work done. InProceedings of the second international conference on Language Res ources and Evaluation (LREC2000).
Jimmy Lin and Dina Demner-Fushman. 2005. Automat-ically evaluating answers to definition questions. In
Proceedings of HLT-EMNLP.
Jimmy Lin and Dina Demner-Fushman. 2006. Will pyra-mids built of nuggets topple over? InProceedings of HLT-NAACL.
Jimmy Lin, Eileen Abels, Dina Demner-Fushman, Dou-glas W. Oard, Philip Wu, and Yejun Wu. 2005. A menagerie of tracks at maryland: HARD, Enterprise, QA, and Genomics, oh my! InProceedings of TREC.
Ellen Voorhees. 2003. Overview of the TREC 2003 question answering track.
Ellen Voorhees. 2004. Overview of the TREC 2004 question answering track.