Evaluating the Evaluation:
A Case Study Using the TREC 2002 Question Answering Track
Ellen M. Voorhees
National Institute of Standards and Technology
Gaithersburg, MD 20899
[email protected]
Abstract
Evaluating competing technologies on a com-mon problem set is a powerful way to improve the state of the art and hasten technology trans-fer. Yet poorly designed evaluations can waste research effort or even mislead researchers with faulty conclusions. Thus it is important to ex-amine the quality of a new evaluation task to es-tablish its reliability. This paper provides an ex-ample of one such assessment by analyzing the task within the TREC 2002 question answer-ing track. The analysis demonstrates that com-parative results from the new task are stable, and empirically estimates the size of the dif-ference required between scores to confidently conclude that two runs are different.
Metric-based evaluations of human language technol-ogy such as MUC and TREC and DUC continue to pro-liferate (Sparck Jones, 2001). This proliferation is not difficult to understand: evaluations can forge communi-ties, accelerate technology transfer, and advance the state of the art. Yet evaluations are not without their costs. In addition to the financial resources required to support the evaluation, there are also the costs of researcher time and focus. Since a poorly defined evaluation task wastes re-search effort, it is important to examine the validity of an evaluation task. In this paper, we assess the quality of the new question answering task that was the focus of the TREC 2002 question answering track.
TREC is a workshop series designed to encourage re-search on text retrieval for realistic applications by pro-viding large test collections, uniform scoring procedures, and a forum for organizations interested in comparing results. The conference has focused primarily on the traditional information retrieval problem of retrieving a ranked list of documents in response to a statement of information need, but also includes other tasks, called
tracks, that focus on new areas or particularly difficult aspects of information retrieval. A question answering (QA) track was started in TREC in 1999 (TREC-8) to ad-dress the problem of returning answers, rather than doc-ument lists, in response to a question.
The task for each of the first three years of the QA track was essentially the same. Participants received a large corpus of newswire documents and a set of factoid ques-tions such as How many calories are in a Big Mac? and Who invented the paper clip?. Systems were required to return a ranked list of up to five [document-id, answer-string] pairs per question such that each answer string was believed to contain an answer to the question. Hu-man assessors read each string and decided whether the string actually did contain an answer to the question. An individual question received a score equal to the recip-rocal of the rank at which the first correct response was returned, or zero if none of the five responses contained a correct answer. The score for a submission was then the mean of the individual questions’ reciprocal ranks. Analysis of the TREC-8 track confirmed the reliability of this evaluation task (Voorhees and Tice, 2000): the asses-sors understood and could do their assessing job; relative scores between systems were stable despite differences of opinion by assessors; and intuitively better systems re-ceived better scores.
tion summarizes the findings, and outlines shortcomings of the evaluation that remain to be addressed.
1
The TREC 2002 QA Track
The goal of the question answering track is to foster re-search on systems that retrieve answers rather than docu-ments, with particular emphasis on systems that function in unrestricted domains. To date the track has consid-ered only a very restricted version of the general ques-tion answering problem, finding answers to closed-class questions in a large corpus of newspaper articles. Kupiec defined a closed-class question as “a question stated in natural language, which assumes some definite answer typified by a noun phrase rather than a procedural an-swer” (Kupiec, 1993). The TREC 2002 track continued to use closed-class questions, but made two major de-partures from the task as defined in earlier years. The first difference was that systems were to return exact an-swers rather than the text snippets containing an answer that were accepted previously. The second difference was that systems were required to return exactly one response per question and the questions were to be ranked by the system’s confidence in the answer it had found.
The change to exact answers was motivated by the be-lief that a system’s ability to recognize the precise extent of the answer is crucial to improving question answering technology. The problems with using text snippets as re-sponses were illustrated in the TREC 2001 track. Each of the answer strings shown in Figure 1 was judged correct for the question What river in the US is known as the Big Muddy?, yet earlier responses are clearly better than later ones. Accepting only exact answers as correct forces sys-tems to demonstrate that they know precisely where the answer lies in the snippets.
The second change, ranking questions by confidence in the answer, tested a system’s ability to recognize when it has found a correct answer. Systems must be able to recognize when they do not know the answer to avoid returning incorrect responses. In many applications re-turning a wrong answer is much worse than rere-turning a “Don’t know” response.
1.1 Task Definition
Incorporating these two changes into the previous QA task resulted in the following task definition. Participants were given a large corpus of newswire articles and a set of 500 closed-class questions. Some of the questions did not have answers in the document collection. A run con-sisted of exactly one response for each question. A re-sponse was either a [document-id, answer-string] pair or the string “NIL”, which was used to indicate that the sys-tem believed there was no correct answer in the collec-tion. Within a run, questions were ordered from most confident response to least confident response. All runs
were required to be produced completely automatically— no manual intervention of any kind was permitted.
The document collection used as the source of answers was the the AQUAINT Corpus of English News Text (LDC catalog number LDC2002T31). The collection is comprised of documents from three different sources: the AP newswire from 1998–2000, the New York Times newswire from 1998–2000, and the (English portion of the) Xinhua News Agency from 1996–2000. There are approximately 1,033,000 documents and 3 gigabytes of text in the collection.
The test set of questions were drawn from MSNSearch and AskJeeves logs. NIST assessors searched the docu-ment collection for answers to candidate questions from the logs. NIST staff selected the final test set from among the candidates that had answers, keeping some questions for which the assessors found no answer. NIST corrected the spelling, punctuation, and grammar of the questions in the logs1, but left the content as it was. NIST did
not include any definition questions (Who is Duke Elling-ton? What are polymers?) in the test set, but otherwise made no attempt to control the relative number of differ-ent types of questions in the test set.
A system response consisting of an [document-id, answer-string] pair was assigned exactly one judgment by a human assessor as follows:
wrong: the answer string does not contain a correct
an-swer or the anan-swer is not responsive;
not supported: the answer string contains a correct
an-swer but the document returned does not support that answer;
not exact: the answer string contains a correct answer
and the document supports that answer, but the string contains more than just the answer (or is miss-ing bits of the answer);
right: the answer string consists of exactly a correct
an-swer and that anan-swer is supported by the document returned.
Only responses judged right were counted as correct in the final scoring. A NIL response was counted as correct if there is no known answer in the document collection for that question (i.e., the assessors did not find an an-swer during the candidate selection phase and no system returned a right response for it). Forty-six questions have no known answer in the collection.
The scoring metric used, called the confidence-weighted score, was chosen to emphasize the system’s ability to correctly rank its responses. The metric is
1
the Mississippi
Known as Big Muddy, the Mississippi is the longest as Big Muddy , the Mississippi is the longest messed with . Known as Big Muddy , the Mississip Mississippi is the longest river in the US
the Mississippi is the longest river in the US, the Mississippi is the longest river(Mississippi) has brought the Mississippi to its lowest
ipes.In Life on the Mississippi, Mark Twain wrote t Southeast;Mississippi;Mark Twain;officials began Known; Mississippi; US,; Minnesota;Gulf Mexico Mud Island,;Mississippi;"The;-- history,;Memphis
Figure 1: Correct text snippets for What river in the US is known as the Big Muddy?
an analog of document retrieval’s uninterpolated average precision in that it rewards a system for a correct answer early in the ranking more than it rewards for a correct an-swer later in the ranking. More formally, if there are questions in the test set, the confidence-weighted score is defined to be
number correct in first ranks
1.2 Track Results
Table 1 gives evaluation results for a subset of the runs submitted to the TREC 2002 QA track. The table in-cludes one run each from the ten groups who submitted the top-scoring runs. The run shown in the table is the run with the best confidence-weighted score (“Score”). Also given in the table are the percentage of questions answered correctly, and the precision and recall for rec-ognizing when there is no correct answer in the document collection (“NIL Accuracy”). Precision of recognizing no answer is the ratio of the number of times NIL was re-turned and correct to the number of times it was rere-turned; recall is the ratio of the number of times NIL was returned and correct to the number of times it was correct (46).
QA systems have become increasingly complex over the four years of the TREC track such that there is now lit-tle in common across all systems. Generally a system will classify an incoming question according to an ontology of question types (which varies from small sets of broad cat-egories to highly-detailed hierarchical schemes) and then perform type-specific processing. Many TREC 2002 sys-tems used specific data sources such as name lists and gazetteers, which were searched when the system deter-mined the question to be of an appropriate type. The web was used as a data source by most systems, though it was used in different ways. For some systems the web was the primary source of an answer that the system then mapped to a document in the corpus to return as a response. Other
% NIL Accuracy Run Tag Score Correct Prec Recall LCCmain2002 exactanswer pris2002 IRST02D1 IBMPQSQACYC uwmtB3 BBN2002C isi02 limsiQalir2 ali2002b
Table 1: Evaluation scores for a subset of the TREC 2002 QA track runs.
systems did the reverse: used the corpus as the primary source of answers and then verified candidate answers on the web. Still other systems used the web as one of sev-eral sources whose combined evidence selected the final response.
systems used NIL as an indicator that the system couldn’t find an answer (rather than the system was sure there was no answer), so ranked NIL responses last. With the ex-ception of the top-scoring LCCmain2002 run, though, the NIL accuracy scores are low, indicating that systems had trouble recognizing when there was no answer in the doc-ument collection.
2
Judging Responses
The TREC QA track is a comparative evaluation. In a comparative evaluation, each of two methods is used to solve a common sample set of problems, and the meth-ods’ output is scored using some evaluation metric. The method whose output produces a better evaluation score is assumed to be the more effective method. An important feature of a comparative evaluation is that only relative scores are required. In other words, the only requirement of the evaluation methodology for a comparative evalua-tion is that it reliably rank better methods ahead of worse methods.
The remainder of this paper examines the question of whether the QA task defined above reliably ranks sys-tems. The first aspect of the investigation examines whether human assessors can recognize exact answers. The evidence suggests that they can, though the differ-ences of opinion as to correctness observed in earlier QA tracks remain. The second part of the investigation looks at the effect the differences of opinion have on rankings of systems given that there is only response per question and the evaluation metric emphasizes the systems’ ranking of questions by confidence. The final aspect of the investi-gation addresses the sensitivity of the evaluation. While evaluation scores can be computed to an arbitrary number of decimal places, not all differences are meaningful. The sensitivity analysis empirically determines the minimum difference in scores required to have a small probability of error in concluding that one system is better than the other.
While the idea of an exact answer is intuitively obvi-ous, it is very difficult to formally define. As with correct-ness, exactness is essentially a personal opinion. Thus whether or not an answer is exact is ultimately up to the assessor. NIST did provide guidelines to the assessors regarding exactness. The guidelines stated that exact an-swers need not be the most minimal response possible. For example, “Mississippi river” should be accepted as exact for the Big Muddy question despite the fact that “river” is redundant since all correct responses must be a river. The guidelines also suggested that ungrammatical responses are generally not exact; a location question can have “in Mississippi” as an exact answer, but not “Mis-sissippi in”. The guidelines also emphasized that even “quality” responses—strings that contained both a cor-rect answer and justification for that answer—were to be
Counts Counts Judged # % Judged # %
WWR 174 WXX 86
WWU 151 RRU 141
WWX 141 RRX 418
WRR 167 RUU 87
WRU 32 RUX 36
WRX 93 RXX 201
WUU 81 UUX 23
[image:4.612.338.518.69.173.2]WUX 34 UXX 21
Table 2: Distribution of disagreements in assessor judg-ments.
considered inexact for the purposes of this evaluation.
To test whether assessors consistently recognize ex-act answers, each question was independently judged by three different assessors. Of the 15,948 [document-id, answer-string] response pairs across all 500 questions, 1886 pairs (11.8 %) had some disagreement among the three assessors as to which of the four judgments should be assigned to the pair. Note, however, that there were only 3725 pairs that had at least one judge assign a judg-ment that was something other than ‘wrong’. Thus, there was some disagreement among the judges for half of all responses that were not obviously wrong.
Table 2 shows the distribution of the assessors’ dis-agreements. Each response pair is associated with a triple of judgments according to the three judgments assigned by the different assessors. In the table the judgments are denoted by W for wrong, R for right, U for unsupported, and X for inexact. The table shows the number of pairs that are associated with each triple, plus the percentage of the total number of disagreements that that triple rep-resents.
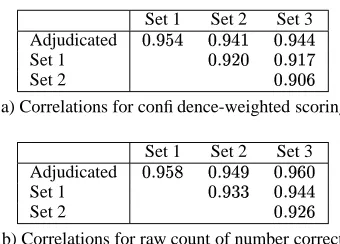
Set 1 Set 2 Set 3 Adjudicated
Set 1
Set 2
a) Correlations for confidence-weighted scoring
Set 1 Set 2 Set 3 Adjudicated
Set 1
Set 2
[image:5.612.99.269.67.189.2]b) Correlations for raw count of number correct
Table 3: Kendall
correlations for system rankings based on different judgment sets and different measures.
3
Stability of Comparative Results
The TREC-8 track demonstrated that QA evaluation re-sults based on text snippets and mean reciprocal rank scoring is stable despite differences in assessor opin-ions (Voorhees and Tice, 2000). Given that the exact an-swer judgments reflect these same differences of opinion, are confidence-weighted scores computed over only one response per question also stable? We repeat the test for stability used in TREC-8 to answer this question.
The three assessors who judged a question were arbi-trarily assigned as assessor 1, assessor 2, or assessor 3. The assessor 1 judgments for all questions were gathered into judgment set 1, the assessor 2 judgments into judg-ment set 2, and the assessor 3 judgjudg-ments into judgjudg-ment set 3. These three judgment sets were combined through adjudication into a final judgment set, which is the judg-ment set used to produce the official TREC 2002 scores.
Each run was scored using each of the four judgment sets. For each judgment set, the runs were ranked in or-der from most effective to least effective using either the confidence-weighted score or the raw number of correctly answered questions. The distance between two rankings of runs was computed using a correlation measure based on Kendall’s
(Stuart, 1983). Kendall’s
computes the distance between two rankings as the minimum number of pairwise adjacent swaps to turn one ranking into the other. The distance is normalized by the number of items being ranked such that two identical rankings produce a correlation of
, the correlation between a ranking and its perfect inverse is
, and the expected correlation of two rankings chosen at random is . Table 3 gives the correlations between all pairs of rankings for both evalu-ation metrics.
The average
correlation with the adjudicated ranking for the TREC-8 results was 0.956; for TREC 2001, where two assessors judged each question, the average correla-tion was 0.967. The correlacorrela-tions for the exact answer case are somewhat smaller: the average correlation is 0.930
for the confidence-weighted score and 0.945 for the raw count of number correct. Correlations are slightly higher for the adjudicated judgment set, probably because the adjudicated set has a very small incidence of errors. The higher correlation for the raw count measure likely re-flects the fact that the confidence-weighted score is much more sensitive to differences in judgments for questions at small (close to one) ranks.
Smaller correlations between system rankings indicate that comparative results are less stable. It is not surprising that an evaluation based on one response per question is less stable than an evaluation based on five responses per question—there is inherently less information included in the evaluation. At issue is whether the rankings are sta-ble enough to have confidence in the evaluation results. It would be nice to have a critical value for
such that cor-relations greater than the critical value guarantee a quality evaluation. Unfortunately, no such value can exist since values depend on the set of runs being compared. In prac-tice, we have considered correlations greater than 0.9 to be acceptable (Voorhees, 2001), so both evaluating using the confidence-weighted score and evaluating using the raw count of number correct are sufficiently stable.
The vast majority of “swaps” (pairs of run such that one member of the pair evaluates as better under one eval-uation condition while the other evaluates as better under the alternate condition) that occur when using different human assessors involve systems whose scores are very similar. There is a total of 177 swaps that occur when the three one-judge rankings are compared with the adjudi-cated ranking when using the confidence-weighted score. Only 4 of the 177 swaps involve pairs of runs whose dif-ference in scores,
, is at least 0.05 as computed using the adjudicated judgment set, and there are no swaps when
is at least 0.07. As will be shown in the next section, runs with scores that are this similar should be assumed to be equally effective, so some swapping is to be expected.
4
Sensitivity Analysis
Human judgments are not the only source of variability when evaluating QA systems. As is true with document retrieval systems, QA system effectiveness depends on the questions that are asked, so the particular set of ques-tions included in a test set will affect evaluation results. Since the test set of questions is assumed to be a ran-dom sample of the universe of possible questions, there is always some chance that a comparison of two systems using any given test set will lead to the wrong conclusion. The probability of an error can be made arbitrarily small by using arbitrarily many questions, but there are practi-cal limits to the number of questions that can be included in an evaluation.
submitted to the QA track to empirically determine the relationship between the number of questions in a test set, the observed difference in scores (
), and the likelihood that a single comparison of two QA runs leads to the cor-rect conclusion. Once established, the relationship can be used to derive the minimum difference in scores required for a certain level of confidence in the results given there are 500 questions in the test set.
The core of the procedure is comparing the effective-ness of a pair runs on two disjoint question sets of equal size to see if the two sets disagree as to which of the runs is better. We define the error rate as the percentage of comparisons that result in a swap. Since the QA track used 500 questions, we can directly compute the error rate for question set sizes up to 250 questions. By fitting curves to the values observed for question set sizes up to 250, we can extrapolate the error rates to question sets up to 500 questions.
When calculating the error rate, the difference between two runs’ confidence-weighted scores is categorized into one of 21 bins based on the size of the difference. The first bin contains runs with a difference of less than 0.01 (including no difference at all). The next bin contains runs whose difference is at least 0.01 but less than 0.02. The limits for the remaining bins increase by increments of 0.01, with the last bin containing all runs with a differ-ence of at least 0.2.
The requirement that the question sets be disjoint en-sures that the comparisons are made on independent sam-ples of the space of questions. That is, we assume a uni-verse of all possible closed-class questions, and an (un-known) probability distribution of the scores for each of the two runs. We also assume that the set of questions used in the TREC 2002 QA track is a random sample of the universe of questions. A random selection from the TREC question set gives a random, paired selection from each of the runs’ confidence-weighted score distributions. We take one random sample as a base case, and a differ-ent random sample (the disjoint sets) as the test case to see if the results agree.
Each question set size from 1 to 250 is treated as a sep-arate experiment. Within an experiment, we randomly se-lect two disjoint sets of questions of the required size. We compute the confidence-weighted score over both ques-tion sets for all runs, then count the number of times we see a swap for all pairs of runs using the bins to segre-gate the counts by size of the difference in scores. The entire procedure is repeated 10 times (i.e., we perform 10 trials), with the counts of the number of swaps kept as running totals over all trials2. The ratio of the number of
2
While the two question sets used within any one trial are disjoint, and thus independent samples, the question sets across trials are drawn from the same initial set of 500 questions and thus overlap. Because the question sets among the different
swaps to the total number of cases that land in a bin is the error rate for that bin.
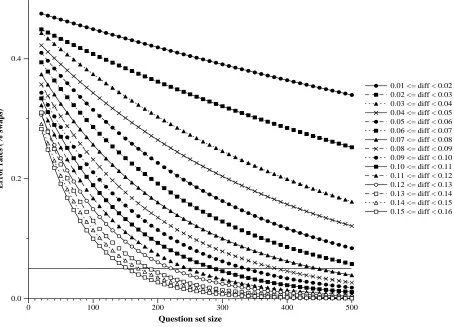
The error rates computed from this procedure are then used to fit curves of the form
where
and
are parameters to be estimated and is the size of the question set. A different curve is fit for each different bin. The input to the curve-fitting proce-dure used only question set sizes greater than 20 since smaller question set sizes are both uninteresting and very noisy. Curves could not be fit for the first bin (differences less than .01), for the same reason, or for bins where dif-ferences were greater than 0.16. Curves could not be fit for large differences because too much of the curve is in the long flat tail.
The resulting extrapolated error rate curves are plot-ted in Figure 2. In the figure, the question set size is plotted on the x-axis and the error rate is plotted on the y-axis. The error rate for 500 questions when a differ-ence of 0.05 in confiddiffer-ence-weighted scores is observed is approximately 8 %. That is, if we know nothing about two systems except their scores which differ by 0.05, and if we repeat the experiment on 100 different sets of 500 questions, then on average we can expect 8 out of those 100 sets to favor one system while the remaining 92 to favor the other.
The horizontal line in the graph in Figure 2 is drawn at an error rate of 5 %, a level of confidence commonly used in experimental designs. For question set sizes of 500 questions, there needs to be an absolute difference of at least 0.07 in confidence-weighted scores before the error rate is less than 5 %. Using the 5 % error rate standard, the pris2002, IRST02D1, and IBMPQSQACYC runs from Table 1 should be considered equivalently effective, as should the uwmtB3, BBN2002C, isi02, limsiQalir2, and ali2002b runs.
5
Conclusion
Evaluating natural language processing technology is critical to advancing the state of the art, but also con-sumes significant resources. It is therefore important to validate new evaluation tasks and to establish the bound-aries of what can legitimately be concluded from the eval-uation. This paper presented an assessment of the task in the TREC 2002 QA track.
While the task in earlier QA tracks had already been validated, changes to the 2002 task were significant enough to warrant further examination. In particular, the 2002 task required systems to return exact answers, to re-turn one response per question, and to rank questions by
0 100 200 300 400 500
Question set size 0.0
0.2 0.4
Error rates (% swaps)
[image:7.612.75.529.74.401.2]0.01 <= diff < 0.02 0.02 <= diff < 0.03 0.03 <= diff < 0.04 0.04 <= diff < 0.05 0.05 <= diff < 0.06 0.06 <= diff < 0.07 0.07 <= diff < 0.08 0.08 <= diff < 0.09 0.09 <= diff < 0.10 0.10 <= diff < 0.11 0.11 <= diff < 0.12 0.12 <= diff < 0.13 0.13 <= diff < 0.14 0.14 <= diff < 0.15 0.15 <= diff < 0.16
Figure 2: Error rates extrapolated to test sets of 500 questions.
confidence in the response; the evaluation metric empha-sized the ranking. Each of these changes could increase the variability in the evaluation as compared to the earlier task. Examination of the track results did show some in-crease in variability, but also confirmed that system com-parisons are sufficiently stable for an effective evaluation. Human assessors do not always agree as to whether an an-swer is exact, but the differences reflect the well-known differences in opinion as to correctness rather than inher-ent difficulty in recognizing whether an answer is exact. The confidence-weighted score is sensitive to changes in judgments for questions that are ranked highly, and there-fore is a less stable measure than a raw count of num-ber correct. Nonetheless, all of the observed inversions in confidence-weighted scores when systems were evalu-ated using different judgment sets were between systems whose scores differed by less than 0.07, the smallest dif-ference for which the error rate of concluding two runs are different is less than 5 % for test sets of 500 ques-tions.
A major part of the cost an evaluation is building the necessary evaluation infrastructure such as training mate-rials, scoring procedures, and judgment sets. The net cost
of an evaluation is greatly reduced if such infrastructure is reusable since the initial costs are amortized over many additional users. Reusable infrastructure also accelerates the pace of technological advancement since it allows re-searchers to run their own experiments and receive rapid feedback as to the quality of alternative methods. Un-fortunately, neither the initial task within the TREC QA track nor the TREC 2002 task produces a reusable QA test collection. That is, it is not currently possible to use the judgment set produced during TREC to accu-rately evaluate a QA run that uses the same document and question sets as the TREC runs but was not judged by the human assessors. Methods for approximating evalua-tion scores exist (Breck et al., 2000; Voorhees and Tice, 2000), but they are not completely reliable. A key area for future work is to devise a truly reusable QA evalua-tion infrastructure.
Acknowledgements
References
Eric Breck, John Burger, Lisa Ferro, Lynette Hirschman, David House, Marc Light, and Inderjeet Mani. 2000. How to evaluate your question answering system ev-ery day . . . and still get real work done. In Proceed-ings of the Second International Conference on Lan-guage Resources and Evaluation (LREC-2000), vol-ume 3, pages 1495–1500.
Julian Kupiec. 1993. MURAX: A robust linguistic ap-proach for question answering using an on-line ency-clopedia. In Proceedings of the Sixteenth Annual In-ternational ACM SIGIR Conference on Research and Development in Information Retrieval, pages 181–190.
Martin-Daniel Lacasse. 1993. FUDGIT A multi-purpose data-processing and fitting program user’s manual ver-sion 2.31. Technical report, Center for the Physics of Materials and Department of Physics, Montreal, Canada, April.
Karen Sparck Jones. 2001. Automatic language and in-formation processing: Rethinking evaluation. Natural Language Engineering, 7(1):29–46.
Alan Stuart. 1983. Kendall’s tau. In Samuel Kotz and Norman L. Johnson, editors, Encyclopedia of Statisti-cal Sciences, volume 4, pages 367–369. John Wiley & Sons.
Ellen M. Voorhees and Chris Buckley. 2002. The effect of topic set size on retrieval experiment error. In Pro-ceedings of the 25th Annual International ACM SIGIR Conference on Research and Development in Informa-tion Retrieval, pages 316–323.
Ellen M. Voorhees and Dawn M. Tice. 2000. Building a question answering test collection. In Proceedings of the Twenty-Third Annual International ACM SIGIR Conference on Research and Development in Informa-tion Retrieval, pages 200–207, July.