Evaluating Content Selection in Summarization: The Pyramid Method
Ani Nenkova and Rebecca Passonneau
Columbia University
Computer Science Department
New York, NY 10027
{
ani,becky
}
@cs.columbia.edu
Abstract
We present an empirically grounded method for evaluating content selection in summariza-tion. It incorporates the idea that no single best model summary for a collection of documents exists. Our method quantifies the relative im-portance of facts to be conveyed. We argue that it is reliable, predictive and diagnostic, thus im-proves considerably over the shortcomings of the human evaluation method currently used in the Document Understanding Conference.
1
Introduction
Evaluating content selection in summarization has proven to be a difficult problem. Our approach acknowledges the fact that no single best model summary exists, and takes this as a foundation rather than an obstacle. In ma-chine translation, the rankings from the automatic BLEU method (Papineni et al., 2002) have been shown to corre-late well with human evaluation, and it has been widely used since and has even been adapted for summarization (Lin and Hovy, 2003). To show that an automatic method is a reasonable approximation of human judgments, one needs to demonstrate that these can be reliably elicited. However, in contrast to translation, where the evaluation criterion can be defined fairly precisely it is difficult to elicit stable human judgments for summarization (Rath et al., 1961) (Lin and Hovy, 2002).
Our approach tailors the evaluation to observed dis-tributions of content over a pool of human summaries,
rather than to human judgments of summaries. Our
method involves semantic matching of content units to which differential weights are assigned based on their fre-quency in a corpus of summaries. This can lead to more stable, more informative scores, and hence to a meaning-ful content evaluation. We create a weighted inventory of Summary Content Units–a pyramid–that is reliable, pre-dictive and diagnostic, and which constitutes a resource for investigating alternate realizations of the same mean-ing. No other evaluation method predicts sets of equally informative summaries, identifies semantic differences between more and less highly ranked summaries, or con-stitutes a tool that can be applied directly to further anal-ysis of content selection.
In Section 2, we describe the DUC method. In Sec-tion 3 we present an overview of our method, contrast our scores with other methods, and describe the distribu-tion of scores as pyramids grow in size. We compare our approach with previous work in Section 4. In Section 5, we present our conclusions and point to our next step, the feasibility of automating our method. A more detailed account of the work described here, but not including the study of distributional properties of pyramid scores, can be found in (Passonneau and Nenkova, 2003).
2
Current Approach: the Document
Understanding Conference
2.1 DUC
Within DUC, different types of summarization have been studied: the generation of abstracts and extracts of differ-ent lengths, single- and multi-documdiffer-ent summaries, and summaries focused by topic or opinion. Evaluation in-volves comparison of a peer summary (baseline, or pro-duced by human or system) by comparing its content to a gold standard, or model. In 2003 they provided four human summaries for each of the 30 multi-document test sets, any one of which could serve as the model, with no criteria for choosing among possible models.
The four human summaries for each of the 2003 docu-ment sets made our study possible. As described in Sec-tion 3, we used three of these sets, and collected six addi-tional summaries per set, in order to study the distribution of content units across increasingly many summaries.
2.2 DUC evaluation procedure
The procedure used for evaluating summaries in DUC is the following:
1. A human subject reads the entire input set and cre-ates a 100 word summary for it, called a model. 2. The model summary is split into content units,
roughly equal to clauses or elementary discourse units (EDUs). This step is performed automatically
using a tool for EDU annotation developed at ISI.1
3. The summary to be evaluated (a peer) is automat-ically split into sentences. (Thus the content units are of different granularity—EDUs for the model, and sentences for the peer).
1
4. Then a human judge evaluates the peer against the model using the following instructions: For each model content unit:
(a) Find all peer units that express at least some
facts from the model unit and mark them.
(b) After all such peer units are marked, think about
the whole set of marked peer units and answer the question:
(c) “The marked peer units, taken together, express
aboutk% of the meaning expressed by the
cur-rent model unit”, wherekcan be equal to 0, 20,
40, 60, 80 and 100.
The final score is based on the content unit coverage. In the official DUC results tables, the score for the entire summary is the average of the scores of all the content model units, thus a number between 0 and 1. Some par-ticipants use slightly modified versions of the coverage metric, where the proportion of marked peer units to the number of model units is factored in.
The selection of units with the same content is facili-tated by the use of the Summary Evaluation Environment
(SEE)2 developed at ISI, which displays the model and
peer summary side by side and allows the user to make selections by using a mouse.
2.3 Problems with the DUC evaluation
There are numerous problems with the DUC human eval-uation method. The use of a single model summary is one of the surprises – all research in summarization eval-uation has indicated that no single good model exists. Also, since not much agreement is expected between two summaries, many model units will have no counterpart in the peer and thus the expected scores will necessarily be rather low. Additionally, the task of determining the percentage overlap between two text units turns out to be difficult to annotate reliably – (Lin and Hovy, 2002) re-port that humans agreed with their own prior judgment in only 82% of the cases.
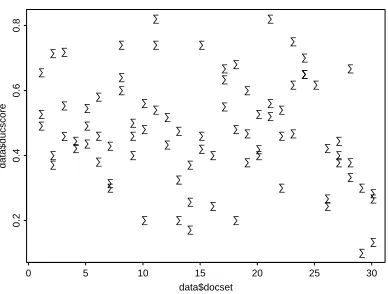
These methodological anomalies lead to unreliable scores. Human-written summaries can score as low as 0.1 while machine summaries can score as high as 0.5. For each of the 30 test sets, three of the four human-written summaries and the machine summaries were scored against the fourth human model summary: each human was scored on ten summaries. Figure 1 shows a scatterplot of human scores for all 30 sets, and illus-trates an apparently random relation of summarizers to each other, and to document sets. This suggests that the DUC scores cannot be used to distinguish a good human summarizer from a bad one. In addition, the DUC method is not powerful enough to distinguish between systems.
2
http://www.isi.edu/∼cyl/SEE.
• • • • • • • • • • • • • • • • • • • • • • • • • • • • • • • • • • • • • • • • • • • • • • • • • • • • • • • • • • • • • • • • • • • • • • • • • • • • • • • • • • • • data$docset data$ducscore
0 5 10 15 20 25 30
0.2
0.4
0.6
[image:2.612.320.514.82.229.2]0.8
Figure 1: Scatterplot for DUC 2003 Human Summaries
3
The Pyramid Approach
Our analysis of summary content is based on Summa-rization Content Units, or SCUs and we will now pro-ceed to define the concept. SCUs emerge from annota-tion of a corpus of summaries and are not bigger than a clause. Rather than attempting to provide a semantic or functional characterisation of what an SCU is, our anno-tation procedure defines how to compare summaries to locate the same or different SCUs.
The following example of the emergence of two SCUs is taken from a DUC 2003 test set. The sentences are indexed by a letter and number combination, the letter showing which summary the sentence came from and the number indicating the position of the sentence within its respective summary.
A1 In 1998 two Libyans indicted in 1991 for the Locker-bie bombing were still in Libya.
B1 Two Libyans were indicted in 1991 for blowing up a Pan Am jumbo jet over Lockerbie, Scotland in 1988. C1 Two Libyans, accused by the United States and Britain of bombing a New York bound Pan Am jet over Lockerbie, Scotland in 1988, killing 270 people, for 10 years were harbored by Libya who claimed the suspects could not get a fair trail in America or Britain.
D2 Two Libyan suspects were indicted in 1991.
The annotation starts with identifying similar sen-tences, like the four above, and then proceeds with finer grained inspection that can lead to identifying
more tightly related subparts. We obtain two SCUs
from the underlined portions of the sentences above. Each SCU has a weight corresponding to the number of summaries it appears in; SCU1 has weight=4 and SCU2
has weight=33:
3
SCU1 (w=4): two Libyans were officially accused of the Lockerbie bombing
A1 [two Libyans]1 [indicted]1 B1 [Two Libyans were indicted]1 C1 [Two Libyans,]1 [accused]1
D2 [Two Libyan suspects were indicted]1
SCU2 (w=3): the indictment of the two Lockerbie
suspects was in 1991 A1 [in 1991]2 B1 [in 1991]2 D2 [in 1991.]2
The remaining parts of the four sentences above end up as contributors to nine different SCUs of different weight and granularity. Though we look at multidocument sum-maries rather than single document ones, SCU annotation otherwise resembles the annotation of factoids in (Hal-teren and Teufel, 2003); as they do with factoids, we find increasing numbers of SCUs as the pool of summaries grows. For our 100 word summaries, we find about 34-40 distinct SCUs across four summaries; with ten sum-maries this number grows to about 60. A more complete comparison of the two approaches follows in section 4.
An SCU consists of a set of contributors that, in their sentential contexts, express the same semantic content. An SCU has a unique index, a weight, and a natural language label. The label, which is subject to revision throughout the annotation process, has three functions. First, it frees the annotation process from dependence on a semantic representation language. Second, it requires the annotator to be conscious of a specific meaning shared by all contributors. Third, because the contributors to an SCU are taken out of context, the label serves as a
re-minder of the full in-context meaning, as in the case of
SCU2 above where the temporal PPs are about a specific event, the time of the indictment.
Our impression from consideration of three SCU in-ventories is that the pattern illustrated here between SCU1 and SCU2 is typical; when two SCUs are seman-tically related, the one with the lower weight is semanti-cally dependent on the other. We have catalogued a vari-ety of such relationships, and note here that we believe it could prove useful to address semantic interdependencies among SCUS in future work that would involve adding a
new annotation layer.4 However, in our approach, SCUs
are treated as independent annotation values, which has the advantage of affording a rigorous analysis of inter-annotator reliability (see following section). We do not attempt to represent the subsumption or implicational
re-4
We are currently investigating the possibility of incorporat-ing narrative relations into SCU pyramids in collaboration with cognitive psychologists.
W=4
W=1 W=2 W=3 W=4
[image:3.612.331.481.74.163.2]W=1 W=2 W=3
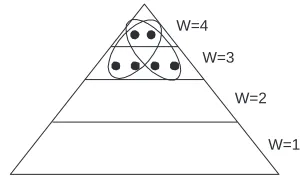
Figure 2: Two of six optimal summaries with 4 SCUs
lations that Halteren and Teufel assign to factoids (Hal-teren and Teufel, 2003).
After the annotation procedure is completed, the final SCUs can be partitioned in a pyramid. The partition is based on the weight of the SCU; each tier contains all and only the SCUs with the same weight. When we use annotations from four summaries, the pyramid will con-tain four tiers. SCUs of weight 4 are placed in the top tier and SCUs of weight 1 on the bottom, reflecting the fact that fewer SCUs are expressed in all summaries, more in three, and so on. For the mid-range tiers, neighbor-ing tiers sometimes have the same number of SCUs. In descending tiers, SCUs become less important informa-tionally since they emerged from fewer summaries.
We use the term “pyramid of ordern” to refer to a
pyra-mid withn tiers. Given a pyramid of ordern, we can
predict the optimal summary content–it should contain all the SCUs from the top tier, if length permits, SCUs from the next tier and so on. In short, an SCU from
tier(n−1)should not be expressed if all the SCUs in
tiernhave not been expressed. This characterization of
optimal content ignores many complicating factors (e.g., ordering, SCU interdependency). However, it is predic-tive: among summaries produced by humans, many seem equally good without having identical content. Figure 2, with two SCUs in the uppermost tier and four in the next, illustrates two of six optimal summaries of size 4 (in SCUs) that this pyramid predicts.
The score we assign is a ratio of the sum of the weights of its SCUs to the sum of the weights of an optimal sum-mary with the same number of SCUs. It ranges from 0 to 1, with higher scores indicating that relatively more of the content is as highly weighted as possible.
The exact formula we use is computed as follows.
Sup-pose the pyramid hasntiers,Ti, with tierTnon top and
T1on the bottom. The weight of SCUs in tierTiwill be
i.5Let|T
i|denote the number of SCUs in tierTi. LetDi
be the number of SCUs in the summary that appear inTi.
SCUs in a summary that do not appear in the pyramid are
assigned weight zero. The total SCU weightDis:
D=Pni=1i×Di
5
The optimal content score for a summary withX SCUs is:
Max=
n
X
i=j+1
i× |Ti|+j×(X− n
X
i=j+1
|Ti|)
wherej= max
i ( n
X
t=i
|Tt| ≥X) (1)
In the equation above, j is equal to the index of the
lowest tier an optimally informative summary will draw from. This tier is the first one top down such that the sum of its cardinality and the cardinalities of tiers above
it is greater than or equal toX (summary size in SCUs).
For example, ifXis less than the cardinality of the most
highly weighted tier, thenj=nand Max is simplyX×n
(the product ofXand the highest weighting factor).
Then the pyramid scoreP is the ratio of D to Max.
BecauseP compares the actual distribution of SCUs to
an empirically determined weighting, it provides a direct correlate of the way human summarizers select informa-tion from source texts.
3.1 Reliability and Robustness
We aimed for an annotation method requiring relatively little training, and with sufficient interannotator reliabil-ity to produce a stable pyramid score. Here we present re-sults indicating good interannotator reliability, and pyra-mid scores that are robust across annotations.
SCU annotation involves two types of choices: extract-ing a contributor from a sentence, and assignextract-ing it to an SCU. In a set of four summaries about the Philippine Air-lines (PAL), two coders (C1 and C2; the co-authors)
dif-fered on the extent of the following contributor:{C1after
{C2the ground crew union turned down a settlement}C1
which}C2. Our approach is to separate syntactic from
se-mantic agreement, as in (Klavans et al., 2003). Because constituent structure is not relevant here, we normalize all contributors before computing reliability.
We treat every word in a summary as a coding unit, and the SCU it was assigned to as the coding value. We re-quire every surface word to be in exactly one contributor, and every contributor to be in exactly one SCU, thus an SCU annotation constitutes a set of equivalence classes. Computing reliability then becomes identical to compar-ing the equivalence classes constitutcompar-ing a set of corefer-ence annotations. In (Passonneau, 2004), we report our method for computing reliability for coreference annota-tions, and the use of a distance metric that allows us to weight disagreements. Applying the same data represen-tation and reliability formula (Krippendorff’s Alpha) as in (Passonneau, 2004), and a distance metric that takes into account relative SCU size, to the two codings C1
and C2 yieldsα = 81. Values above .67 indicate good
reliability (Krippendorff, 1980).
A H C J
C1 .97 .87 .83 .82
C2 .94 .87 .84 .74
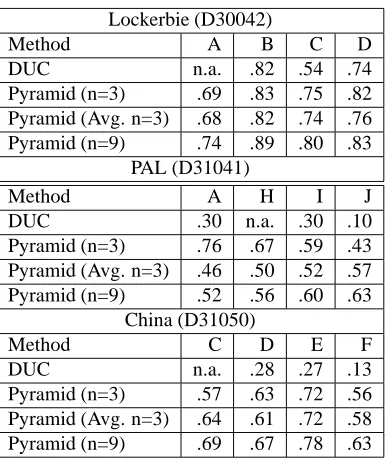
[image:4.612.319.532.69.316.2]Consensus .95 .89 .85 .76
Table 1: Pyramid scores across annotations.
1 (9) 2 (36) 3 (84) 4 (128) 5 (128) 6 (84) 7 (36) 8 (9) 9 (1) 0.3
0.4 0.5 0.6 0.7 0.8 0.9 1
Number of summaries in the pyramid (number of pyramids)
Summary score
[image:4.612.81.301.103.168.2]arv d30042.b min d30042.b max d30042.b arv d30042.q min d30042.q max d30042.q
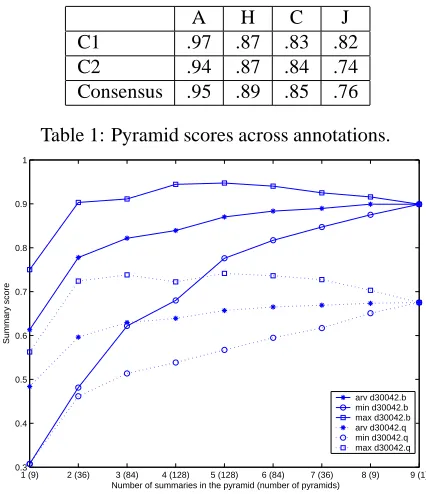
Figure 3: Min, max and average scores for two sum-maries – one better than the other.
More important than interannotator reliability is the ro-bustness of the pyramid metric, given different SCU an-notations. Table 1 gives three sets of pyramid scores for the same set of four PAL summaries. The rows of scores correspond to the original annotations (C1, C2) and a consensus. There is no significant difference in the scores assigned across the three annotations (between subjects ANOVA=0.11, p=0.90).
3.2 Pyramid Scores of Human Summaries
Here we use three DUC 2003 summary sets for which four human summaries were written. In order to provide as broad a comparison as possible for the least annotation effort, we selected the set that received the highest DUC scores (D30042: Lockerbie), and the two that received the lowest (D31041: PAL; D31050: China). For each set, we collected six new summaries from advanced under-graduate and under-graduate students with evidence of superior verbal skills; we gave them the same instructions used by NIST. This turned out to be a large enough corpus to in-vestigate how many summaries a pyramid needs for score stability. Here we first compare pyramid scores of the original summaries with DUC scores. Then we present results demonstrating the need for at least five summaries per pyramid, given this corpus of 100-word summaries.
Lockerbie (D30042)
Method A B C D
DUC n.a. .82 .54 .74
Pyramid (n=3) .69 .83 .75 .82
Pyramid (Avg. n=3) .68 .82 .74 .76
Pyramid (n=9) .74 .89 .80 .83
PAL (D31041)
Method A H I J
DUC .30 n.a. .30 .10
Pyramid (n=3) .76 .67 .59 .43
Pyramid (Avg. n=3) .46 .50 .52 .57
Pyramid (n=9) .52 .56 .60 .63
China (D31050)
Method C D E F
DUC n.a. .28 .27 .13
Pyramid (n=3) .57 .63 .72 .56
Pyramid (Avg. n=3) .64 .61 .72 .58
[image:5.612.74.267.68.299.2]Pyramid (n=9) .69 .67 .78 .63
Table 2: Comparison of DUC and Pyramid scores; capital letters represent distinct human summarizers.
average over all order-3 pyramids (Avg. n=3); the third row of pyramid scores are for the single pyramid of or-der 9 (n=9; note that the 10th summary is the one being scored). Compared to the DUC scores, pyramid scores show all humans performing reasonably well. While the Lockerbie set summaries are better overall, the difference with the PAL and China sets scores is less great than with the DUC method, which accords with our impressions about the relative quality of the summaries. Note that pyramid scores are higher for larger pyramid inventories, which reflects the greater likelihood that more SCUs in the summary appear in the pyramid. For a given order pyramid, the scores for the average and for a specific pyramid can differ significantly, as, for example, PAL A and PAL J do (compare rows n=3 and n=9).
The pyramid rows labelled ”n=3” are the most compa-rable to the DUC scores in terms of the available data. For the DUC scores there was always a single model, and no attempt to evaluate the model.
Pyramid scores are quantitatively diagnostic in that they express what proportion of the content in a summary is relatively highly weighted, or alternatively, what pro-portion of the highly weighted SCUs appear in a sum-mary. The pyramid can also serve as a qualitative diag-nostic tool. To illustrate both points, consider the PAL A summary; its score in the n=3 row of .76 indicates that relatively much of its content is highly weighted. That is, with respect to the original pyramid with only three tiers, it contained a relatively high proportion of the top tier SCUs: 3/4 of the w=3 facts (75%). When we av-erage over all order-3 pyramids (Avg. n=3) or use the
largest pyramid (n=9), the PAL A score goes down to .46 or .52, respectively. Given the nine-tier pyramid, PAL A
contains only 1/3 of the SCUs of w≥6, a much smaller
proportion of the most highly weighted ones. There are four missing highly weighted SCUs and they express the following facts: to deal with its financial crisis, Pal nego-tiated with Cathay Pacific for help; the negotiations col-lapsed; the collapse resulted in part from PAL’s refusal to cut jobs; and finally, President Estrada brokered an agree-ment to end the shutdown strike. These facts were in the original order-3 pyramid with relatively lower weights.
The score variability of PAL A, along with the change in status of SCUs from having low weights to having high ones, demonstrates that to use the pyramid method reli-ably, we need to ask how many summaries are needed to produce rankings across summaries that we can have confidence in. We now turn to this analysis.
3.3 Behavior of Scores as Pyramid Grows
Here we address two questions raised by the data from Table 2, i.e., that scores change as pyramid size increases: 1. How does variability of scores change as pyramid
order increases?
2. At what order pyramid do scores become reliable? To have confidence in relative ranking of summaries by pyramid scores, we need to answer the above questions.
It has often been noted that different people write dif-ferent summaries; we observe that with only a few sum-maries in a pyramid, there is insufficient data for the scores associated with a pyramid generated from one combination of a few summaries to be relatively the same as those using a different combination of a few sum-maries. Empirically, we observed that as pyramids grow larger, and the range between higher weight and lower weight SCUS grows larger, scores stabilize. This makes sense in light of the fact that a score is dominated by the higher weight SCUS that appear in a summary. However, we wanted to study more precisely at what point scores become independent of the choice of models that pop-ulate the pyramid. We conducted three experiments to locate the point at which scores stabilize across our three datasets. Each experiment supports the same conclusion, thus reinforcing the validity of the result.
Our first step in investigating score variability was to examine all pairs of summaries where the difference in scores for an order 9 pyramid was greater than 0.1; there were 68 such pairs out of 135 total. All such pairs ex-hibit the same pattern illustrated in Figure 3 for two sum-maries we call ’b’ and ’q’. The x-axis on the plot shows how many summaries were used in the pyramid and the y-axis shows the min, max and average score scores for
the summaries for a given order of pyramid,6Of the two,
6
’b’ has the higher score for the order 9 pyramid, and is perceivably more informative. Averaging over all order-1 pyramids, the score of ’b’ is higher than ’q’ but some individual order-1 pyramids might yield a higher score for ’q’. The score variability at order-1 is huge: it can be as high as 0.5. With higher order pyramids, scores stabilize. Specifically, in our data, if summaries diverge at some point as in Figure 3, where the minimum score for the better summary is higher than the maximum score for the worse summary, the size of the divergence never decreases as pyramid order increases. For pyramids of
order> 4, the chance that ’b’ and ’q’ reverse ranking
approaches zero.
For all pairs of divergent summaries, the relationship of scores follows the same pattern we see in Figure 3 and the point of divergence where the scores for one summary become consistently higher than those of the othere, was found to be stable – in all pair instances, if summary A gets higher scores than summary B for all pyramids of
ordern, than A gets higher scores for pyramids of order
≥n. We analyzed the score distributions for all 67 pairs
of ”divergent” summaries in order to determine what or-der of pyramid is required to reliably discriminate them. The expected value for the point of divergence of scores, in terms of number of summaries in the pyramid, is 5.5.
We take the scores assigned at order 9 pyramids as be-ing a reliable metric on the assumption that the pattern we have observed in our data is a general one, namely that variance always decreases with increasing orders of pyramid, and that once divergence of scores occurs, the better summary never gets a lower score than the worse for any model of higher order.
We postulate that summaries whose scores differ by less than 0.06 have roughly the same informativeness. The assumption is supported by two facts. First, this cor-responds to the difference in PAL scores (D31041) we find when we use a different one of our three PAL an-notations (see Table 1). Second, the pairs of summaries whose scores never clearly diverged had scores differing by less than 0.06 at pyramid order 9.
Now, for each pair of summaries(sum1, sum2), we
can say whether they are roughly the same when
evalu-ated against a pyramid of ordernand we will denote this
as|sum1|==n |sum2|, (scores differ by less than 0.06
for some pyramid of ordern) or different (scores differ
by more than 0.06 for all pyramids of ordern) and we
will use the notation|sum1|<n |sum2|if the score for
sum2is higher.
When pyramids of lower order are used, the following errors can happen, with the associated probabilities:
E1: |sum1| ==9 |sum2| but |sum1| <n |sum2| or
|sum1|>n |sum2|at some lower ordernpyramid.
The conditional probability of this type of error is
p1=P(|sum1|>n|sum2|||sum1|==9|sum2|).
E2: |sum1| <9 |sum2| but at a lower order
|sum1| ==n |sum2|. This error corresponds to
”losing ability to discern”, which means one can tol-erate it, as long as the goal is not be able to make fine grained distinctions between the summaries. Here,
p2=P(|sum1|==n|sum2|||sum1|<9|sum2|).
E3: |sum1| <9 |sum2| but at lower level
|sum1| >n |sum2| Here, p3 = P(|sum1| >n
|sum2|||sum1| <9 |sum2|) + P(|sum1| <n
|sum2||sum1| >n |sum2|). This is the most
severe kind of mistake and ideally it should never happen–the two summaries appear with scores
opposite to what they really are.7
The probabilitiesp1,p2 andp3 can be computed
di-rectly by counting how many times the particular error
occurs for all possible pyramids of ordern. By taking
each pyramid that does not contain either ofsum1 or
sum2 and comparing the scores they are assigned, the
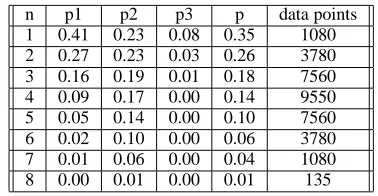
probabilities in Table 3 are obtained. We computed prob-abilities for pairs of summaries for the same set, then summed the counts for error occurrence across sets. The
order of the pyramid is shown in columnn. “Data points”
shows how many pyramids of a given order were exam-ined when computing the probabilities. The total
proba-bility of errorp=p1∗P(|sum1|==9|sum2|) + (p2 +
p3)∗(1−P(|sum1|==9|sum2|))is also in Table 3.
Table 3 shows that for order-4 pyramids, the errors of
type E3are ruled out. At order-5 pyramids, the total
prob-ability of error drops to 0.1 and is mainly due to error E2,
which is the mildest one.
Choosing a desirable order of pyramid involves balanc-ing the two desiderata of havbalanc-ing less data to annotate and score stability. Our data suggest that for this corpus, 4 or 5 summaries provide an optimal balance of annotation ef-fort with reliability. This is reconfirmed by our following analysis of ranking stability.
[image:6.612.331.520.562.660.2]n p1 p2 p3 p data points 1 0.41 0.23 0.08 0.35 1080 2 0.27 0.23 0.03 0.26 3780 3 0.16 0.19 0.01 0.18 7560 4 0.09 0.17 0.00 0.14 9550 5 0.05 0.14 0.00 0.10 7560 6 0.02 0.10 0.00 0.06 3780 7 0.01 0.06 0.00 0.04 1080 8 0.00 0.01 0.00 0.01 135
Table 3: Probabilities of errors E1, E2, E3 and total prob-ability of error
7
In order to study the issue of how the pyramid scores behave when several summarizers are compared, not just two, for each set we randomly selected 5 peer summaries and constructed pyramids consisting of all possible sub-sets of the remaining five. We computed the Spearman rank-correlation coefficient for the ranking of the 5 peer summaries compared to the ranking of the same sum-maries given by the order-9 pyramid. Spearman
coef-ficent rs (Dixon and Massey, 1969) ranges from -1 to
1, and the sign of the coefficent shows whether the two rankings are correlated negatively or positively and its absolute value shows the strength of the correlation. The
statisticrscan be used to test the hypothesis that the two
ways to assign scores leading to the respective rankings are independent. The null hypothesis can be rejected with
one-sided test with level of significanceα= 0.05, given
our sample sizeN= 5, ifrs≥0.85.
Since there are multiple pyramids of ordern≤5, we
computed the average ranking coefficient, as shown in Table 4. Again we can see that in order to have a ranking of the summaries that is reasonably close to the rankings
produces by a pyramid of ordern = 9, 4 or more
sum-maries should be used.
n averagers # pyramids 1 0.41 15 2 0.65 30 3 0.77 30 4 0.87 15
[image:7.612.330.525.141.205.2]5 1.00 3
Table 4: Spearman correlation coefficient average for
pyramids of ordern≤5
3.4 Rank-correlation with unigram overlap scores
Lin and Hovy (2003) have shown that a unigram co-occurrence statistic, computed with stop words ignored, between a summary and a set of models can be used to assign scores for a test suite that highy correlates with the scores assigned by human evaluators at DUC. We have illustrated in Figure 1 above that human scores on human summaries have large variance, and we assume the same holds for machine summaries, so we believe the approach is built on weak assumptions. Also, their approach is not designed to rank individual summaries.
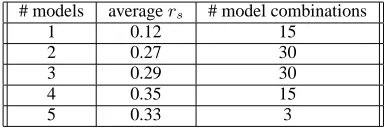
These qualifications aside, we wanted to test whether it is possible to use their approach for assigning scores not for an entire test suite but on a per set basis. We computed
the Spearman rank-coefficentrsfor rankings assigned by
computing unigram overlap and those by pyramid of or-der 9. For computing the scores, Lin’s original system was used, with stop words ignored. Again 5 summaries were chosen at random to be evaluated against models composed of the remaining five summaries. Composite
models were obtained by concatenating different combi-nations of the initial five summaries. Thus scores can be computed using one, two and so on up to five reference
summaries. Table 5 shows the average values ofrsthat
were obtained.
# models averagers # model combinations
1 0.12 15
2 0.27 30
3 0.29 30
4 0.35 15
5 0.33 3
Table 5: Spearman correlation coefficient average for un-igram overlap score assignment
As noted above, in order to consider the two scoring
methods as being substitutable,rsshould be bigger than
0.85, given our sample size. Given the figures shown in Table 5, we don’t have reason to believe that unigram scores are correlated with pyramid scores.
4
Comparison with previous work
The work closest to ours is (Halteren and Teufel, 2003), and we profited from the lessons they derived from an annotation of 50 summaries of a single 600-word docu-ment into content units that they refer to as factoids. They found a total of 256 factoids and note that the increase in factoids with the number of summaries seems to follow a Zipfian distribution.
We identify four important differences between fac-toids and SCUs. First, an SCU is a set of contributors that are largely similar in meaning, thus SCUs differ from each other in both meaning and weight (number of con-tributors). In contrast, factoids are semi-formal expres-sions in a FOPL-style semantics, which are
composition-ally interpreted. We intentioncomposition-ally avoid creating a
rep-resentation language for SCU labels; the function of an SCU label is to focus the annotator’s attention on the shared meaning of the contributors. In contrast to Hal-tern and Teufel, we do not believe it is possible to arrive at the correct representation for a set of summaries; they refer to the observation that the factoids arrived at depend on the summaries one starts with as a disadvantage in that adding a new summary can require adjustments to the set of factoids. Given the different knowledge and goals of different summarizers, we believe there can be no
cor-rect representation of the semantic content of a text or
[image:7.612.120.249.357.422.2]Second, (Halteren and Teufel, 2003) do not make di-rect use of factoid frequency (our weights): to construct a model 100-word summary, they select factoids that oc-cur in at least 30% of summaries, but within the resulting model summary, they do not differentiate between more and less highly weighted factoids. Third, they annotate semantic relations among factoids, such as generalization and implication. Finally, they report reliability of the an-notation using recall and precision, rather than a reliabil-ity metric that factors in chance agreement. In (Passon-neau, 2004), we note that high recall/precision does not preclude low interannotator reliability on a coreference annotation task.
Radev et al. (2003) also exploits relative importance of information. Evaluation data consists of human relevance judgments on a scale from 0 to 10 on for all sentences in the original documents. Again, information is lost rela-tive to the pyramid method because a unique reference summary is produced instead of using all the data. The reference summary consists of the sentences with highest relevance judgements that satisfy the compression con-straints. For multidocument summarization compression rates are high, so even sentences with the highest rele-vance judgments are potentially not used.
Lin and Hovy (2002) and Lin and Hovy (2003) were the first to systematically point out problems with the large scale DUC evaluation and to look to solutions by seeking more robust automatic alternatives. In their stud-ies they found that multiple model summarstud-ies lead to more stable evaluation results. We believe a flaw in their work is that they calibrate the method to the erratic DUC scores. When applied to per set ranking of summaries, no correlation was seen with pyramid scores.
5
Conclusions
There are many open questions about how to parameter-ize a summary for specific goals, making evaluation in itself a significant research question (Jing et al., 1998). Instead of attempting to develop a method to elicit reli-able judgments from humans, we chose to calibrate our method to human summarization behavior.
The strengths of pyramid scores are that they are re-liable, predictive, and diagnostic. The pyramid method not only assigns a score to a summary, but also allows the investigator to find what important information is miss-ing, and thus can be directly used to target improvements of the summarizer. Another diagnostic strength is that it captures the relative difficulty of source texts. This allows for a fair comparison of scores across different input sets, which is not the case with the DUC method.
We hope to address two drawbacks to our method in future work. First, pyramid scores ignore interdependen-cies among content units, including ordering. However, our SCU annotated summaries and correlated pyramids
provide a valuable data resource that will allow us to in-vestigate such questions. Second, creating an initial pyra-mid is laborious so large-scale application of the method would require an automated or semi-automated approach. We have started exploring the feasibility of automation and we are collecting additional data sets.
References
Wilfrid Dixon and Frank Massey. 1969. Introduction to
statistical analysis. McGraw-Hill Book Company.
Hans Halteren and Simone Teufel. 2003. Examining the consensus between human summaries: initial ex-periments with factoid analysis. In HLT-NAACL DUC
Workshop.
Hongyan Jing, Regina Barzilay, Kathleen McKeown, and Michael Elhadad. 1998. Summarization evaluation methods: Experiments and analysis. In AAAI
Sympo-sium on Intelligent Summarization.
Judith Klavans, Sam Popper, and Rebecca J. Passonneau. 2003. Tackling the internet glossary glut: Extraction and evaluation of genus phrases. In SIGIR Workshop:
Semantic Web, Toronto.
Klaus Krippendorff. 1980. Content Analysis: An
Intro-duction to Its Methodology. Sage Publications,
Bev-erly Hills, CA.
Chin-Yew Lin and Eduard Hovy. 2002. Manual and au-tomatic evaluation of summaries. In Proceedings of
the Workshop on Automatic Summarization, post con-ference workshop of ACL 2002.
Chin-Yew Lin and Eduard Hovy. 2003. Automatic eval-uation of summaries using n-gram co-occurance statis-tics. In Proceedings of HLT-NAACL 2003.
Kishore Papineni, Salim Roukos, Todd Ward, and Wei-Jing Zhu. 2002. Bleu: A method for automatic evalu-ation of machine translevalu-ation. In ACL.
Rebecca J. Passonneau and Ani Nenkova. 2003. Evaluat-ing content selection in human- or machine-generated summaries: The pyramid method. Technical Report CUCS-025-03, Columbia University.
Rebecca J. Passonneau. 2004. Computing reliability
for coreference annotation. In Proceedings of the 4th
International Conference on Language Resources and Evaluation (LREC), Lisbon, Portugal.
Dragomir Radev, Simone Teufel, Horacio Saggion, and W. Lam. 2003. Evaluation challenges in large-scale multi-document summarization. In ACL.
G. J. Rath, A. Resnick, and R. Savage. 1961. The for-mation of abstracts by the selection of sentences: Part 1: sentence selection by man and machines. American