57
NATALITY IN DUBLIN IN THE YEARS 1943, 1944 AND 1945.
By STANLEY LYON.
(Read on Friday, 28th May, 1948.)
The population problem is a subject of the greatest importance to every country. The Government of this country has quite recently appointed a Commission to inquire into the level and trend of Population, with a special reference to Emigration, and some members of this Society are serving on the Commission—one of our Honorary Secretaries is Chairman of the Commission. In the Reports on the Censuses of Population it is stated that this is a country of late marriages but of high fertility, notwith-standing which we are fast becoming a country of elderly people. * The statistics of the age structure of the Population in 1936, particularly at . the younger ages as compared with 10 years earlier, attracted much attention. Similar figures for ages and conjugal condition were com-piled for 1941 from the Register of Population and are available in the Report compiled from particulars obtained from the Register. This Register, it will be remembered, was taken for the special purpose of the issuing of Ration Books during the Emergency period of the World War. Under existing legislation the birth of each child must not only bo
registered with the Local Registrar of Births, Marriages and Deaths
within a period of three months from date of birth under the Registra-tion of Births and Deaths Act, 1863, but must also be notified within thirty-six hours in accordance with the requirements of the Notification of Births Acts, 1905 and 1917, to the Medical Officer of Health for the area in which the birth takes place by the doctor, midwife or other person present at the birth.
Through the courtesy of Dr. Matthew Russell, Medical Officer of Health for the City of Dublin, I was given access to the actual Notification of Birth returns for the County Borough of Dublin. I have classified and summarised the particulars contained on these records and am able to present some interesting statistics compiled from these Notification of
Birth returns concerning births in Dublin during the three years period
from January, 1943, to December, 1945, inclusive. In a paper read before this Society—May, 1943—I gave corresponding figures for each of the years 1941 and 1942. The main purpose of this paper is to con-tinue the tables contained therein. For comparison some of the Statistics for those earlier years are repeated in some of the tables in this paper. Some tables on the other hand for reasons of space contain the figures for one year only (»1945) and others for only two years (1944 and 1945).
The following particulars which had not previously been asked for on the Notification of Births return, were now included on the form :—(1) order of birth of child to mother, (2) age of mother at birth of child, (3) date of present marriage of mother, and, where necessary, of former marriage, and (4) occupation of father. The responsible authorities of the three large Maternity Hospitals in the city, viz., Rotunda Hospital, Coombe Lying-in Hospital, and the National Maternity Hospital, Holies Street, agreed to ascertain and to record these further details. Accordingly y
Maternity Nursing Homes and those used by doctors and midwives in the case of private individuals, were revised. Later, in order to provide better statistics, the actual date (day, month and year) and not the year only of marriage has been obtained. This enables accurate statistics to be computed dealing with " duration of marriage " and " age of mother at marriage."
In practically all cases the particulars asked for were furnished on the returns. In the very few cases where^there were omissions it was possible from the context to fill in the bknk* with approximate figures or dates, and accordingly none of the tables which follow includes a " Not Stated " column or line.
Comparison with the Registrar-General's Figures
The figures for births published in the official vital statistics of the various countries are not always strictly comparable because of different definitions of " births." In France, for instance, all births live and still are recorded, counting multiple births as one; in Germany, all births live and still are recorded but each individual born is counted separately;
in Switzerland, only live births are included, counting each individual
born. Italy records births by each of these methods as well as by live births only, counting multiple births as one. In England and Wales all births whether live or still are included, counting each individual born. In Eire the method adopted is the same as in Switzerland, viz., taking account of live births only and counting each individual born. There are also other countries in which the births are not recorded unless, and until, the child shall have lived at least a week. Each of these methods has its own particular purpose depending on whether the object is the compilation of statistics for population purposes only or whether the figures are also to be used for a study relating to fertility.
The figures for births published by the Registrar-General in this country are for live births only, whereas the figures derivable from the
Notification of Births returns include still-births as well as live births.
Accordingly in the following comparison between the Registrar-General's Birth Statistics and the Notification of Births figures still-births have been excluded from the latter.
Year
1941 1942 1943 1944 1945
Registrar-General's Figures 13,669 15,146 15,014 15,109 15,479
Notification of Birth Returns. Live Births only
14,286 14,904 15,223 15,153 15,437
Difference
+ 617 —242 + 209 + 44 — 42
59
Considering that there is a permissive interval of three months from the date of birth bsfore registration is compulsory, as compared with thirty-six hours in the case of notification of birth, and that there has always been a time-lag of probably the same duration operating as regards registrations at the beginning and end of the year, it is satisfactory to find such a close correspondence between the two sets of figures com-piled from different sources.
Maternities and Births—Month of Occurrence
It may be convenient to refer here to some of the limitations of the figures which are included in the tables in this papsr, particularly if the statistics are used in connection with any study of Fertility. First, they refer to births in Dublin City only, an urban area housing over one-sixth of the total population of Eire, whereas the rest of the country is much more rural in type, and even Cork, the next largest City, had a population in 1946 of only 75,361 compared with 506,635 in the City of Dublin. Secondly, they refer only to those mothers who gave birth to a child in the period under review and take no account either of childless married women or of mothers who had given birth to a child in any earlier year. Thirdly, and this is important from the fertility point of view, no cognis-ance is taken of miscarriages or abortions, but premature births, i.e., where the foetus is at least of seven month's gestation, are included.
The subject of this paper is divided into the following sub-heads:—
Maternities and Births by months of occurrence. Birth by age of Mother and by Parity (birth order).
Nuptial Birth by age of Mother at marriage and by order of births. First Birth (Nuptial) by duration of marriage of the Mother. Multiple Births. ,
Ex-Nuptial Births.
Births by Occupation of Father.
Births according to place of residence of Parents. Births in hospitals, nursing homes or own homes.
The first of the summaries presented is Table I showing for each month in each case of the five years 1941 to 1945 (a) the number of maternities, setting out separately those which produced multiple births, and (b) the number of children born, classified according to sex, order of birth, whether live or still-born and whether they were nuptial or ex-nuptial births. A " maternity " is the event of giving birth to one or more children alive or still-born and is for statistical purposes synonymous with confinement; whereas a " birth " relates to the individual child whether live or still-born.
The figures for total children born show a very fair degree of corres-pondence, month by month. When the numbers are reduced to an average per day, as the number of days in the several months vary, we find that in 1945 the numbers were over 45 per day in four of the months, between 40 and 44 in other four months, and under 40 in the remainder. The averages are :
1945 1945 1945
January-February March April
39-3 40-9 44-8 43-6
May June July August
47'2 47-2 46-6 43-0
September October November December
47-7 44-4 39-7 30-6
593 587 685 802 687 630
847 786 1,122 915 936 985
1,308 1,252 1,395 1,541 1,335 1,415
727 867 874 783 921 1,038
3,475 3,492 4,070 4,041 3,829 4,068 The figures for the five months March to July are probably a reflection of the greater number of marriages in Dublin in the third quarter of the previous year, as it is shown later on that the interval between marriage and first maternity was less than one year in the case of approximately 45 per cent, of all first births. The numbers of marriages in Dublin, aceoiding to the Registrar-General's returns, in each quarter in each of the seven years 1940 to 1946 were as follows :
Marriages in City of Dublin.
Year 1st Quarter 2nd Quarter 3rd Quarter 4th Quarter Total 1940
1941 1942 1943 1944 1945
1946 . . 792 939 1,423 939 4,093 While these figures may offer some explanation, not much weight should be given to any deductions from them as it must be remembered that many people resident elsewhere get married in Dublin, and vice versa, and that the marriages are registered in the place where they are solemnised. They show a greater number of marriages in the third quarters of each year.
The remarkable similarity between the figures for the five years as shown in Table I is most striking. This is best seen by comparing the percentages, whether it be order of birth of children, numbers of ex-nuptial births or the multiple maternities.
The numbers of births of each sex show a slight excess of males. The male children born alive were 50*3 percent, of all nuptial births compared with 46*5 nuptial females in the year 1945. The total figures for children in percentages by order of birth are extraordinarily close in the five years. The number of still-born (nuptial) recorded was 486 in 1945, repre-senting 3*2 per cent, of all births.
Age of Mother at Birth of Child
TABLE I.
Births by Month of Occurrence and Order of Birth.
MONTH AND Y E A R
J a n u a r y 1941 1942 . . 1943 . . 1944 . . 1945 .. February 1941 . . 1942 . . 1943 . . 1944 . . 1945 . . March 1941
1942 . . 1943 . . 1944 . . 1945 . . April 1941 . . 1942 . . 1943 . . 1944 . . 1945 . . May 1941 . . 1942 . . 1943 . . 1944 . . 1945 . . J u n e 1941 . . 1!)42 . . 1943 . . 1944 . . 1945 . . J u l y 1941 . . 1842 .. 1044 .. 1945 . . August 1941 . . 1942 . . 1943 . . 1944 . . 1945 . . September 11)41 . . 1942 . . 1943 . . 1944 . . 1945 . . October 1941 . . 1942 . . 1943 . . 1944 . .
int.-, ..
November 1941 . . 1942 . . 1!I43 . . 1944 . . 1045 . . December 1941 . . 1942 . . 1943 . . 1944 . . 1945 .. TOTALS 1941 . . 1942 . . 1943 .. 1944 . . 1945 . . Percentages of
totals
(Cols.) 1941 . . 1942 . . 1043 . . 1944 . . 1945 . .
MATEHNIT Total 1,157 1,168 1,274 1,267 1,190 1,078 1,035 1,124 1,241 1,125 1,303 1,300 1,334 1,263 1,372 1,250 1,335 1,238 1,331 1,289 1,330 1,383 1,438 1,411 1,441 1,299 1,329 1,231 1,314 1,399 1,328 1.312
1 •(( i7
I , . H W
1.21)0 1,410 1,207 1,205 1,223 1,201 1,304 1,127 1,317 1,381 1,275 1,388 1,095 1.21)3 1,183 1,207 1,352 1.023 ,077 1.1.">'> 1.111 1.175 I.I 01 1.179 1.181 1.162 1,230 14,298 14.843 15.069 15,043 15.693 IOu-0 100-C-100-0 1001) 100-0 Single 1,145 1,152 1,245 1,251 1,174 1,061 1,022 1.111 1,217 1,105 1,289 1,285 1,313 1,241 1,356 1,233 1,310 1,217 1,309 1,271 1,298 1,302 1,420 1,392 1,419 1,283 1,304 1,212 1,295 1,384 1,308 1,293 1,240 1,389 1,192 1,189 1,205 1,187 1,278 1,108 1,295 1.361 1,250 1,364 1,088 1,189 1,160 1,181 1,329 1,008 1,053 1.140 1,092 1.159 1.093 1,16" 1.147 1.145 1,215 14,11.6 14.621 14,821 14.800 15,443 98-7 98-5 98-4 9S-4 98-4 IES Mult pie (See Foot notei 12 16 29 16 2'* 17 13 13 . 24 20 14 15 21f 22 16 17 25 21 22 18 32 21 18 19 **2 10 25 19 19* 15* 20 19 20* 27 15* 10 18 14 26 19* 22 20 25 24 7* 14 17 26 23J 15 24* 15t 19 16* 8 12 34* 17 21 192 248 243 250 1-3 I "•") 115 1-6
±IL
i-Total 1,106 1,13b 1,237 1,224 1,160 1,052 1,008 1,086 1,213 1,094 1,267 1,256 1,295 1,215 1,327 1,231 1,309 1.211 1,313 1,249 1,294 1,342 1,411 1.377 1,403 ,265 1,294 1,204 1,274 1,358 1.300 1,288-1 , -1 N • >
1.23(1 1.399 1,178 1,174 1,199 1,161 1,289 1,113 1,293 1,354 1,257 1.365 1.054 1,105 1,156 1,186 1,330 1,004 1.064 1.115 1.082 1,147 ,062 1,138 1,153 .133 ,214 13.926 14,467 14.706 14.674 15.335 1 00-0 O0-II 100-0 1O0-0 1(10-0 Males Alive 523 563 628 618 586 498 " 499 530 617 555 616 620 651 577 083 599 062 59S 648 638 660 643 723 670 090 622 636 599 623 078 090 610
1 1 1 i
61 :i 093 575 585 002 002 048 509 650 681 670 670 509 603 555 598 680 522 517 508 541 586 543 549 566 577 604 6,926 7.137 7,328 7,360 7,711 49-7 49-3 49-8 50-1 50 -3 Still Bori 3 3 13 20 16 18 24 2 3 10 25 19 17 26 2 3 31 22 25 29 22 24 16 16 28 24 34 14 30 19 19 32 3 3 23 21 (_ 32 24 32 17 20 20 22 2 3 17 20 20 28 19 15 20 20 24 20 20 20 17 18 21 16 14 21 284 274 230 281 258 2-0 1-9 1-6 1-9 1-7 Sex Females l Alive 524 543 574 573 537 507 4 6 8 534 550 504 001 579 604 590 598 589 594 578 620 574 593 655 642 651 671 583 619 568 603 625 565 637
I l l " 585 659 552 546 562 524 593 502 601 641 552 655 497 523 571 550 619 446 509 512 502 530 485 545 551 531 573 6,444 6.819 6,947 6,831 7,138 46-3 47-1 47-2 46-6 46-5 1 Still Born 26 17 15 17 19 23 18 12 21 16 33 31 17 17 24 18 24 13 21 21 25 16 22 16 28 30 20 18 16 22 22 20 -*i 10 15 27 11 18 15 22 20 19 15 15 20 20 20 15 18 11 12 18 15 19 14 16 23 20 11 16 272 237 201 202 228 2-0 1-7 1-4 1-4 1-5
N U M I A L BIRTHS
1st 277 249 295 290 292 238 252 280 282 263 283 263 332 314 344 366 294 315 334 356 343 333 376 376 364 341 361 351 385 384 321 350 Oft ft OOD 342 397 306 307 362 320 333 201 289 346 313 356 275 309 301 296 342 266 274 281 264 299 238 272 306 284 306 3,515 3,553 3,911 3,800 4,036 25-3 24-6 26-6 25-9 26-3
2 n d
225 213 230 244 255 208 178 197 261 241 241 236 243 268 258 215 252 247 273 275 260 285 270 270 284 231 252 229 237 266 273 238 n K l JiUX 238 299 216 226 249 220 277 232 229 243 285 288 215 224 245 231 288 168 207 228 225 225 190 219 229 261 253 2,674 2,759 2,861 3,013 3,209 19-2 1 9 1 19-5 20-5 20-9
CHILDREN
ORDER O I
3rd 159 159 183 167 161 152 155 161 174 158 184 196 206 185 201 160 178 147 188 165 160 182 212 202 205 191 169 173 183 194 200 174 xta 190 182 155 175 151 160 195 164 172 210 197 201 130 170 167 197 188 151 156 159 172 178 180 175 169 157 191 1,992 2,061 2,116 2,172 2,219 14-3 14-2 14-4 14-8 14-5
4 t h
88 130 127 131 117 100 105 125 144 123 136 132 135 134 160 139 145 123 162 116 155 128 142 134 136 128 122 136 120 149 127 150 127 140 130 122 124 128 135 131 141 142 139 150 103 119 118 114 149 110 116 108 110 133 115 103 121 114 129 1,408 1,513 1,510 1,557 1,636 10-5 10-5 10-3 10-6 10-7 ' BIRTH
5 t h
98 99 116 90 90 99 66 85 100 91 115 120 110 76 91 82 109 108 93 92 94 105 107 116 118 90 102 75 92 104 105 95 •fto 78 106 90 101 81 97 93 89 127 110 98 99 87 78 82 92 106 82 77 94 87 93 7° 79 94 82 86 1.103 1.158 1,157 1,101 1,169 7-9 8-0 7-9 7-5 7-6 BORN 6th 73 77 77 82 82 61 71 55 88 62 77 88 67 70 79 72 96 79 69 56 84 92 74 63 96 71 81 64 72 70 75 68 - UU 73 77 73 69 74 62 73 65 99 71 62 73 57 73 69 58 64 65 71 60 5 3 73 67 75 65 68 69 840 960 843 820 880 6-0 6-6 5-7 5-6 5-7 7th 62 59 59 61 40 46 52 66 50 46 71 63 . 50 46 46 67 67 54 52 71 54 49 66 50 62 61 66 53 52 47 59 54 - ju. 51 55 57 57 43 53 45 4 3 59 59 47 52 55 53 40 51 61 48 47 51 53 41 40 53 57 62 56 669 679 653 628 622 4-8 4-7 4-4 4-3 4 1 8t] 34 36 50 46 39 34 36 30 32 34 30 42 48 41 4 3 43 42 32 33 36 49 49 47 4 6 39 41 47 41 32 50 47 48 37 47 41 41 .37 '48 38 41 64 35 32 42 41 40 33 52 40 33 39 42 3 8 25 47 42 27 28 35 481 532 460 4 6 5 488 3-5 3-7 3 1 3-2 3 1 1 9t] 30 37 28 46 22 32 27 18 29 26 34 35 34 35 24 30 35 39 40 28 24 35 39 38 34 30 28 29 39 29 28 34 iJii 3 3 28 33 22 27 19 27 22 30 40 32 24 34 38 30 29 27 20 30 18 29 29 •27 28 29 20 2 8 356 379 370 389 326 2-6 2-6 2-5 2-7 2-1
_ [T 1
Total 1 10th II
£ over ||
60 77 72 67 62 82 00 09 53 50 96 81 70 46 81 57 91 67 69 54 71 84 78 82 65 75 66 53 62 60 65 77 — L,
70 68 77 54 51 54 73 65 83 98 52 80 51 55 59 60 65 40 47 74 51 51 80 92 56 57 61 828 873 825 729 770 5-9 6 0 5-6 4-9 5-0 63 48 66 59 58 43 40 51 52 52 50 59 62 70 61 36 51 48 40 58 69 62 45 5 3 60 50 60 46 60 57 48 43 1] A{\
1 z
4445 47 42 54 41 34 46 47 43 47 49 52 44 47 47 34 38 57 49 45 47 53 63 46 4 3 568 599 617 615 613 100-0 100-0 100-0 100-0 100-0 Males Aliv 23 23 30 28 20 29 19 27 27 27 25 36 29 35 28 17 23 18 10 34 39 35 25 28 20 23 37 22 20 26 22 23 21 27 21 22 13 27 17 14 21 25 0 2 24 21 23 24 24 28 15 2*> 31 24 19 20 25 30 19 25 275 309 297 297 301 48-4 51-6 48-1 48-3 49-1 Still e Bon 3 1 2 3 1 5 — 1 2 — 1 1 — 5 — — 1 1 0 1 2 — 1 5 3 2 . 2 — 1 2 1 — — 1 1 — 1 2 3 — 3 — — — -3 — — 1 — 13 19 16 10 15 2-3 3-2 2-6 1-6 2-4
E X - N U P T I A L
S E X
Females x Aliv 36 24 34 31 33 13 16 24 22 2 3 21 20 31 32 32 18 23 28 24 22 25 25 17 23 32 20 21 16 29 27 25 18 20 18 16 24 23 27 24 23 19 24 18 21 23 27 27 17 22 15 7 10 24 24 23 18 26 32 26 18 269 263 288 296 287 47-4 43-9 46-7 48-1 46-8 Still e Born 1 — 2 . — 2 — 3 1 2 1 1 — 2 — 1 3 1 1 — 1 1 3 2 2 1 — 3 1 1 1 — 2 1 1 — 3 — —• — — — 1 1 1 — 2 1 1 — 2 1 — •— 11 8 16 12 10 1-9 1-3 2-6 2-0 1-7 BlRTHS
J s t
50 36 60 47 49 34 31 41 45 39 43 49 48 58 54 32 40 41 32 39 58 55 40 47 53 47 53 41 51 49 40 38 38 35 37 40 43 37 40 35 31 37 38 38 38 43 41 34 45 3 i 25 33 43 42 40 40 45 50 34 32 489 501 511 514 499 80-1 83-6 82-8 83-5 81-4 n • 12 9 6 9 7 9 9 10 6 10 6 8 7 9 6 3 7 6 6 14 9 6 5 5 5 3 5 4 6 5 9 5 g 4 3 2 3 5 12 4 1 5 8 5 7 6 10 8 6 9 7 5 12 6 4 7 8 11 10 11 67 80 90 79 85 11-8 13-4 14-6 12-8 13-9 ORDER
O J
orci __ 2 2 2 — — 1 1 1 2 3 3 — 1 2 1 1 4 1 1 — 1 1 — 2 1 1 2 — — 2 2 2 — — 2 1 4 1 — 1 — — 1 — 4 2 — 2 — 1 — — 1 — *— 9 13 10 14 19 1-6 2-2 1-6 2-3 3-1
o r BIRTH
4 t h
1 1 — — — — — — — 3 — — . — — 1 — 1 — — — 1 — — — — 1 — — 1 1 1 1 , -— — — — — 1 1 1 — — — 1 — — — 1 1 3 3 5 4 3 9-5 9-5 3-8 ( 0-7 0-5
5 t h
_ — — — .— — 2 — 1 — 1 — — — — — — — — — — — — -— — — — — — — — — — 1 — — — — — — .— — •— —• — — — 1 — — 1 1 4 — | AtVi otn 'k over 1 — —. —. — —. — — — . 2 — — 1 — — — — _ — — 2 — — . 1 — — — 1 — — — — — — — — — — — — -— —. — —• —• — — 2 —• 3 3 — )-3 — )-t 0-5 1-6 0-5 N o t e : Practically all tho Multiple Maternities worj Twin births; those which were otherwise are indicated as follows:
* Includes one of triple births + .. two „
is counted as an individual birth. For instance, if the fifth pregnancy produced twins, the children would be classified as a fifth and sixth child in parity order.
TABLE II.
Births by Age of Mother and by Order of Birth
Order of Birth First Child Second Child Third Child Fourth Child Fifth Child Sixth Child
Seventh Child ..
Eighth Child ..
Ninth Child
Teath Child . and over
T O T A L
Nuptial ...
E x - N u p t i a l ... Year 1943 1944 1945 1943 1944 1945 1943 1944 1945 1943 1944 1945 1943 1944 1945 1943 1944 1945 1943 1944 1945 1943 1944 1945 1943 1944 1945 1943 1944 1945 1943 1944 1945 1943 1944 1945 Under 20 214 170 180 30 35 30 3 2 — — — — — — _ — — — — — — 247 208 212 117 102 83
A G E O F M O T H E R A T
20-24 1,324 1,298 1,360 658 736 744 276 289 282 109 108 112 55 42 35 10 18 8 2 2 3 2 2 — — — — 2,436 2,493 2,546 245 267 275
B I R T H
N u p t i a l Births
25-29 1,425 1,321 1,445 1,042 1,084 1,177 750 723 747 454 458 465 305 274 279 181 155 177 105 83 77 44 45 33 28 19 15 12 12 7 4,346 4,174 4,422 179 151 166 30-34 621 711 722 760 796 852 711 732 742 563 578 626 446 455 452 306 323 361 247 254 247 163 144 159 118 132 97 153 126 145 4,088 4,251 4,403 40 57 59 35-40 270 235 261 310 305 324 306 350 373 309 342 342 273 269 315 266 237 259 231 228 210 173 195 194 150 158 151 356 319 331 2,644 2,638 2,760 24 32 21
O F C H I L D
40-44 54 64 63 58 56 79 69 71 71 74 65 85 71 56 84 77 88 71 65 60 84 75 74 74 68 74 59 279 247 260 890 855 930 4 6 9 45 + 3 1 5 3 1 3 1 4 2 1 4 b 7 5 4 3 1 4 3 1 1 3 7 6 6 6 4 25 25 27 55 55 62 — Total Nuptial 3,911 3,800 4,036 2,861 3,013 3,209 2,116 2,172 2,219 1,510 1,557 1,636 1,157 1,101 1,169 843 820 880 653 628 622 460 465 468 370 389 326 825 729 770 14,706 14,674 15,335 — Ex-N u p t i a l
Births 511 514 499 90 79 85 10 14 19 r, 4 H 1 1 4 — 2 — 2 — 1 1 — — — — 617 615 613 Total Births 4,422 4,314 4,535 2,951 3,092 3,294 2,126 2,186 2,238 1,515 1,661 1,01)9 1,158 1,102 1,173 B4H 820 882 653 828 62-2 460 467 468 370 390 327 825 729 770 — — 15,323 15,289 15,948
62
bulk of the remainder were divided almost equally in the 5 year age groups 20-24 years of age, and 35-40 years of age. Roughly, there were a little over 200 " nuptial" children born each year to mothers under 20 years of age, and in round figures 100 ex-nuptial children to mothers under 30 years of age, and between 55 and 65 nuptial children were born to mothers over 45 years of age at birth of child. Practically all were in the 45 year group—indicating that except in very few instances child bearing of mothers did not go beyond 45 years of age.
The predominance of ex-nuptial births was marked in the 20-24 years of age group ; in the age group for unmarried mothers from 25-29 years of age there were roughly 160 ex-nuptial children in each year. It is extraordinary to note the numbers in the 35-44 age group, having 20 to 30 births each year.
As regards parity order, it is only to be expected that there would be a gradual upward movement in the proportion in each order of birth according to ascending ages of mother. Only 16 per cent, were born to mothers in the age group 20 to 24 years in 1945 ; in England and Wales the corresponding group included 24 per cent, of legitimate births.
The percentages of first born, second born, third born, etc., children distinguishing nuptial and ex-nuptial births, were as follows :—
TABLE III.
Percentages of Total Births by Order of Birth.
1944: Nuptial Ex-nuptial
TOTAL . . .
1945: Nuptial Ex-nuptial
TOTAL . . .
1st
% 25-9 83-6 28-2
26 3 81-4 28-4
2nd
% 20-5 12-8 20-2
20-9 13-9 20-7
3rd
% 14-8
2-3 14-3
1 4 5 3-1 1 4 0
ORDER O
4th
% 10-6
0-6 10-2
10-7 0-5 10-3
5th
% 7-5 0-2 7-2
7-6 0-6 7-4
F BIRTH
6th
% 5-6 —
5-4
5-7 0-3 5-5
7th
% 4-3 —
4 1
4 1 —
3-9 8th
% 3-2 0-3 3 1
3 1 — 2-9
9th
% 2-7 0-2 2-5
2 1 0-2 2 1
10th and over % 4-9 —
4-8
5-0 —
4-8 Total
% 100 100 100
100 100 100
These figures must not be taken as representing the pattern of families in Dublin; they illustrate the annual additions to families rather than types of existing family. To indicate the pattern of families it would be necessary to have available data concerning the deaths, not only of infants, but of all children in parity order according to whether they were first, second or third, etc., children of the family. It would be necessary to take into account also the fact, as has been ascertained in other coun-tries, that infant mortality in the seventh and higher parity orders is much greater than for the earlier parities.
63
Age of Mother
16 years 17 , 18 , 19 , 20 , 21 , 22 , 23 , 24 , 25 , 26 , 27
Children born
5 11 72 124 256 344 510 664 772 847 801
QAA
Age of Mother
28 years 29 , 30* , 31 , 32 , 33 , 34 , 35 , 36 , 37 , 38 ,
O Q
Children born
917 1,013 1,127 731 936 760 809 705 596 483 551 A OK
Age of Mother
40 years 41 42 43 , 44 , 45 , 46 , 47 , 48 , 49 , Not married
TOTAL
Children born
379 192 202 103 54 47 6 5 3 1 613
15,948
Comparison with the figures for 1942 shown in my previous paper on Dublin births shows almost similar proportions for each age of mother. The following comparisons with some other countries of the percentage distribution of (a) nuptial and (b) ex-nuptial live births by age of mother were published in the Report of the Registrar-General fcr England and Wales, 1938, Part 2, and though they refer to countries as a whole it may be of interest to set alongside them the corresponding figures for the City of Dublin. The figures for Bristol City are not segregated by nuptial and ex-nuptial births, but taking the total births in 1932 and 1937, it is found that they bear out almost exactly the pattern shown for England and Wales. These comparisons show that practically everywhere the age group 25 to 29 years produced the greatest number of children.
TABLE IV.
Percentage Distribution of " Live " Births by Age of Mother.
Country, &c.
England and Wales— July-Dec., 1938 Bristol, 1937 . . Scotland—July-Dec.
1938 Australia, 1938 New Zealand, 1938 Dublin City, 1945
England and Wales— July-Dec, 1938 . . Scotland—July-Dec.
1938 Australia, 1938 New Zealand, 1938 Dublin City, 1945
Under 20
3-5 2-6
4-2 5-2 3-6 1-4
17-9
22-2 26-3 26-1 13-5
20—24
23-3 20-2
23-7 26-9 25-1 16-6
25—29
32-6 31-8
30-8 31-3 3 3 1 28-8
31-6
33-6 36-6 33-9 44-8
22-1
20-5 17-5 20-1 27-1
30—34 35—39
Nuptial
23-8 24-4
23-5 21-1 23-0 28-7
12-6 14-9
13-6 11-2 11-3 18-0
40—44
3-9 5-7
3-9 3-9 3-6 6-1
Ex-Nuptial
14-3
12-8 9-8 10-6 9-6
10-0
7-8 6-4 6-5 3-5
3-8
3-0 3-0 2-7 1-5
45 and over
0-3 0-4
0-3 0-4 0-3 0-4
0-3
0-1 0-4 0-1 —
Total
100-0 100-0
100-0 100-0 100-0 100-0
100-0
100-0 100-0 100-0 100-0
64
groups and higher in the 30 to 39 years age groups than in any of tho other places for which comparisons are shown. The mothers in Dublin bear children mostly from 25 to 35 years of age, whereas in England and Wales and in Scotland, the mothers are mostly in the 20 to 30 age group. The numbers of births to unmarried mothers were mostly in the 20 to 30 years age group in Dublin compared with the 16 to 24 years age group in Scotland, Australia and New Zealand. In England and Wales ex-nuptial births were spread more evenly over ages from 16 to 40 with a preponder-ance in the 20 to 24 years age group. Only 15 psr cent, of ex-nuptial births were to mothers over 30 years of age in Dublin compared with 30 per cent, in England and Wales.
Age of Mother at Marriage
It must always be remembered that the figures in the paper are subject to the most important qualification that they refer only to those women who have borne at least one child and who have given birth to a child in any of the years 1943 to 1945. Statistics are not available of the possibly large numbers of married women who have not had any child. When a marriage is being registered .with the Local Registrar of Births, Marriages and Dsaths or his agent, although provision is made in the Registration Act prescribing the particulars to be given, the actual age of the contracting parties is rarely given. The expression " full age " is accepted if the parties are over 21 years of age. Accordingly, it is not possible to classify all married women according to age at marriage from the registrations of marriage. The records of " births notified," however, enable this information to be obtained in almost all cases in respect of all married women who have borne a child and so far as births in the City of Dublin are concerned, the figures are contained in Table V, which shows the number of births according to parity and age of mother at marriage in the year 1945.
TABLE V:
Nuptial BirtJis in 1945 by Age of Mother at Marriage and by Order of Birth.
Age of Mother
at
Marriage
Under 15
15 16 17 18 19
Total under 20 20-24 25-29 30-34 35-39 40-44
46
TOTAL
1st
1 3 12 50 121 190
377
1,683 1,293
508 149 25 1
4,036
2nd
2 3 27 43 89 183
347
1,318 1,051
404 82 7 —
3,209
3rd
2 5 17 45 76 120
265 944 737 227 44 2 —
2,219
4th
2 8 10 34 80 94
228 749 516 121 21 1 —
1,636
ORDER
5th
4 8 14 34 68 90
218 547 297 97 10 —
—
1,169
OF BIRTH
6 th
2
4 12 36 68 71
193 433 203 46 5 —
—
880 7th
1 6 16 34 40 59
156 305 121 33 7 —
—
622 8th
3 5 14 28 38 43
131 230 91 15 1 —
—
468 9th
3 4 9 14 34 37
101 155 57 11 2 —
—
326
10th & over
4 17 21 59 82 98
281 364 97 25 3 —
—
770
Total
24 63 152 377 696 985
2,297 6,728 4,463 1,487
324 35 1
15,335
of age, 44 per cent, were married between 20 and 24 years of age, 29 per cent, were between 25 and 29 years of age and 9 per cent, between 30 and 34 years of age. Compared with 1941, it would appear that there is a tendency to marriage at an earlier age.
The tailing-off of fertility with increasing age at marriage will be particularly noted : thus 4th or higher orders of birth in 1945 constituted 57 per cent, of total births in the case of women married under 20 years of age, 41 per cent, for ages 20 to 24, 31 per cent, for ages 25 to 29. 23 per cent, for ages 30 to 34, and 15 per cent, for ages 35 to 40. No figures could be more eloquent of the stimulating effect on fertility of early marriage. The substantial contribution to the aggregate number of births by larger families will be noted : for instance, the number of births ot 4th or higher orders in 1945, namely 5,871, was no less than 38 per cent, of total births. The percentage for 1943 and 1944 were 40 and 39 respec tively.
Duration of Marriage
The figures in this section are derived from the answers to the two questions on date of marriage and date of birth of child. It was remark-able that in only very few instances was the reply to the first question inadequate. The section gives some impression of the comparatively big proportion of children born to mothers (a) who had been married less than five years, and (b) who had been married ten years and over when their first child was born.
[image:10.400.58.352.385.491.2]It has been possible to compile statistics in respect of those mothers who had been married once only. It has seemed desirable to exclude the very few births to remarried widows, because there were probably intervals of varying lengths of widowhood before second or later marriages. Table VI shows the number of children born in 1944 and 1945 to mothers who had been married once only, classified according to dura-tion of marriage.
TABLE VI.
Children Born Classified by Duration of Marriage of Motlier.
Duration of Marriage
Less than 1 year Between 1 and 2 vears
2 „ 3 * 3 ,, 4 4 ,, 5 5 ,, 6
1944
1,880 1,770 1,392 1,220 1,196 959
1945
1,894 1,889 1,517 1,262 1,086 1,186
Duration of Marriage
Between 6 and 7 years 7 „ 8 8 ,, 9 9 ,, 10 10 yrs. and over
TOTAL
1944
889 800 710 656 3,172
14,644 1945
887 812 725 666 3,388
15,312
The similarity between the figures for both years is notable, and in fact the figures for each of the five years 1941 to 1945 show very little varia-tion. It appears that half of the total of children were born to mothers who had been married less than 5 years. The numbers declined progres-sively as the duration of marriage increased. Parents as defined in this section who had been married for 10 years or over contributed 22 per cent, in 1944 and 24 per cent, in 1945 of the children born to them—a comparatively high proportion.
Interval between Marriage and First Maternity
Such statistics in relation to all births in Dublin are now available. Satisfactory particulars were recorded on the returns furnished by the principal maternity institutions, as well as on the returns from private nursing homes and from midwives. The form of return asked for par-tic alars of date of birth of child, order of birth and date of marriage of the mother. From this data it is possible to determine the interval between marriage and birth of first child.
Table VII shows the number of first children born and the dura-tion of marriage before the birth of the first child.
TABLE VII.
First Births—Nuptial. Interval between Marriage and First Maternity.
Interval between Marriage fiTid F i r s t ]\Tait6rnifcv
Less than 6 months Between 6 and 8 months Nine months
Between 9 and 12 months . . Total less than 1 year Between 1 year and 1 year and 3
months
Between 1 year and 3 months and 1 year and 6 months Between 1 year and 6 months
and 1 year and 9 months Between 1 year and 9 months
and 2 years
Between 2 years and 3 years Between 3 years and 5 years . . Over 5 years
TOTAL FIRST BIRTHS
Actual Numbers 1943
263 278 469 802 1,812
667 320 245 158 294 262 153 3,911
1944 263 253 454 812 1,782
647 343 205 153 307 216 147 3,800
1945 273 337 379 791 1,780
776 340 217 146 375 234 163 4,036
I n 1943
6-7 7-1 12-0 20-5 46-3
17-1 8-2 6-2 4-0 7-5 6-7 4-0 100-0
Percentages 1944
6-9 6-7 11-9 21-4 46-9
17-0 9-0 5-4 4-0 8-1 5-7 3-9 100-0
1945 6-8 8-3 9-4 19-6 44-1
19-2 8-5 u - 4
3-7 9-3 5-8 4-0 100-0
Multiple Births
In any study of the population problem, especially in relation to fertility, the numbsr of mxternities in the case of multiple births rather than the number of children born is generally taken as the basis for fertility investigation. To a carfcain extent maternities are susceptible of voluntary control, but there is no such control over the number of extra children born in multiple maternities.
TABLE VIII.
Sex-distribution of Children born in Twin Maternities.
Twin Maternities
Unlike Sex Pairs Like Sex Pairs . .Male
. .Female
TOTAL TWIN MATERNITIES
Nuptial 1944
101 70 65 236
1945 96 69 74 239
Ex-nuptial 1944
2 1 1 4
1945 2 5 7
Totals as P jrcentage 1944 42-9 29-6 27-5 100-0
1945 39-0 28-9 32-1 100-0
Notwithstanding the smallness of these figures on account of which very reliable conclusions cannot be drawn, there is still a certain con-sistency between the figures shown for the two years, particularly in the like sex pairs, whether male or female.
In the year 1944 there were only four cases of triple births ; in two of these maternities the children were all males, in one all females, and in the fourth two females and one male. In 1945 there were only three triple maternities reported, and there were two cases all males, one of two females and one male. In 1945 there was one case of quadruplets— three males and one female.
The frequency of maternity with multiple births in Dublin was 14 per 1,000. This figure compares with corresponding frequencies in England and Wales, Scotland, South Africa, Italy, Norway, Germany, Australia and U.S.A., countries for which figures are available, where the figures for recent years range between 12 and 14 par 1,000 maternities. Table IX shows the total number of children born to multiple births distinguishing those which were born alive and those which were
still-born.
TABLE IX.
Multiple Births—Live and Still-born by Sex.
YEAR
1944 1945
TWINS
Both Males Live
129 130
Still-born 13 12
Both Females Live
122 150
Still-born 10
8
1 Male 1 Female Live
190 179
Still-born
C
O
C
O
TRIPLETS
All Males Live
3 6
Still-born 3
All Females
Live 3
2 Female 1 Male
Live 3
$
68
The figures in the above table also show a remarkable consistency. They show further that the risk of still-birth of twins is greater than the risk of still-birth occurring at single births. Still-births amongst twins were 7 per cent, in 1944 and 1945 of all multiple births, whereas for single births still-births represented only 3 per cent. Though the numbers are small they give some indication of a greater likelihood of a multiple birtk. amongst the higher orders of birth than amongst the lower.
The following were the ages of the mothers and the number of children born in the case of multiple births :—
TABLE X.
Multiple Maternities by Age of Mother.
TYPE
TWINS :
1944 1945
TRIPLETS .
1944 1945
Q CJADEUPLETS:
1945
Under 20 years
—_ 2 — . —
Age of Mother at Birth oj 20-24
years 22 32 —
— 25-29 years 63 70
o
—
30-34 years 80 64 1 2 1
35-39 years 52 56 — 1 —•
* Children 40-44 years 23 22
— —
45 years and over
—
—
Total 240 246 3 3 1
It will be seen that there was not very much difference in the number of multiple maternities according to mothers in the several age groups, The total numbers of twin maternities in the three preceding years 1941 to 1943, were 188, 221, and 242 respectively.
Ex-Nuptial Births
The numbers of unmarried mothers who gave birth to children in Dublin were 603 (12 of whom had twins and one had triplets) in 1943, 607 (8 of whom had twins) in 1944, and 606 (7 of whom had twina) in 1945.
TABLE XI.
Ex-nuptial Maternities and Births by Age of Mother and by Order of Births.
Age of Mother at Birth of Child
Under 20 years ... 20 to 24 years . . 25 to 29 years ... 30 to 34 years ...
35 to 39 years ...
40 to 44 years ...
TOTAL
Maternities
1943 114 242 175 45 23 4 603
1944 102 265 149 55 30 6 667
1945 82 272 165 58 20 9 606
1943 110 215 128 34 20 4 511
CHILDREN BORN BY ORDER OF
1st 1944
102 230 115 41 21 5 514
1945 80 236 124 39 14 6 499
2nd and c 1943
7 30 51 14 4 — 106
1944 —
37 30 16 11 1 101
>ver 1945
3 39 42 20 7 3 114
BIRTH
1943 117 245 179 48 24 4 617
Total
1944 102 267 151 57 32 6 615
1945 83 275 166 59 21 9 613
The above table shows, according to the age of mother : (1) the number of maternities and (2) the total number of each parity of children born. First births were 84-per cent, in 1943 and 1944 and 81 per cent, in 1945. It was remarkable how close some of the figures were for the three years : for instance, in the age group 20 to 24 years of age, the number of mater-nities were 242, 265 and 272 and in the age group 35 to 39 years of age, the numbers were 23, 30 and 20. Ex-nuptial births were 3*9 per cent, of the total births in each of the years, a figure which is precisely the same as the average for the whole State, as given by the Registrar-General in his annual reports. The omission from the Registrar-General's figures of the still-births ex-nuptial does not affect these percentages.
For obvious reasons, many unmarried mothers residing in the country come to Dublin for their confinement, and, accordingly, too much reliance ought not to be placed on the figures in the Section referring to Residence of Parents in the case of such mothers. There might, of course, be a corresponding movement in the opposite direction, but it is unlikely that the figures, though small, would cancel each other.
Occupation of the Father
As an indication of the social grade into which children are born in Dublin the occupation of the husband was obtained in the case of married women. Their children were classified according to the occupa-tional groupings used in the 1936 Census of Population Report. Over 600 different occupations were recorded, but for the purposes of this paper they have been reduced to 4 main groups representing the follow-ing social classes. (These groups are almost identical with those used in the case of some recent population surveys for Liverpool and Bristol.)
Group 1. Professional, Clerical and Commercial.
„ 2. Skilled Manual Workers and men in Supervisory positions. (Plumbers, Fitters, Compositors, Engine-drivers, Hairdressers, Carpenters, Confectioners, Painters, Bookbinders, etc.)
„ 3. Semi-skilled Manual Workers. (Carters, Factory-workers, Gardeners, Postmen, Bus Conductors and Drivers, Waiters, Soldiers, etc.)
„ 4. Unskilled Manual Workers. (Labourers, Dockers, Porters, Seamen, Scavengers, etc.)
[image:14.405.85.355.362.477.2]70
TABLE XII.
Births by Occupation of Father and Order of Birth.
Occupational Group
GROUP I :
{a) Professions, Commercial
1943 1944 1945
{b) Lower Professions
1943 1944 1945 c) Clerical 1943 1944 1945
(i) Insurance Agents, etc. 1943
1944 1945
(e) Shop Assistants,
Minor Commercial 1943 1944 1945
Total Group I. 1943 1944 1945
GROUP II:
(a) Manual Workers, Supervisory
1943 1944 1945
(b) Manual Workers,
Skilled 1943 1944 1945 Total Group II :
1943 1944 1945
GROUP m : Manual Workers, Semi-skilled 1943 1944 1945 GROUP IV: Manual Workers, Unskilled 1943 1944 1945
T O T A L 1943
3 944 1945 Total Nuptial Births 593 537 483 2,099 2,368 2,598 584 544 595 44 43 51 495 537 497 3,815 4,029 4,224 110 153 177 2,156 2,258 2,283 2,266 2,411 2,460 3,980 3,693 4,106 4,645 4,541 4,545 14,706 14,674 15,335 1st 245 193 175 718 781 906 203 181 188 12 11 13 171 191 149 1,349 1,357 1,433 33 38 50 569 562 614 602 600 664 954 896 975 1,006 947 966 3,911 3,800 4,036 2nd 170 171 136 479 603 658 153 127 156 14 13 11 121 120 127 937 1,034 1,088 20 33 45 458 481 484 478 514 529 741 707 821 705 758 771 2,861 3,013 3,209 3rd 85 91 78 326 400 384 105 96 110 7 7 13 65 100 75 588 694 660 13 26 25 341 382 345 354 408 370 564 482 583 610 588 606 2,116 2,172 2,219 4th 42 37 46 188 229 263 56 66 60 3 6 4 48 42 54 337 380 426 13 15 21 226 280 262 239 295 283 429 390 429 505 492 497 1,510 1,557 1,636
O R D E R
5th 23 24 22 132 128 149 22 21 30 4 2 4 34 32 41 215 207 246 7 15 10 168 172 187 175 187 197 358 313 326 409 394 400 1,157 1,101 1,169
OF B I R T H
Group 1 comprised only 27 per cent, of all nuptial births in 1945, the remaining 73 per cent, (i.e., roughly 3 out of every 4 nuptial births) were born to families of the manual worker classes. The unskilled and semi-skilled manual workers account for over half of all births, but for the fourth and subsequent children in order of parity they account for 65 per cent, of all births. The group Professional, Clerical and Com-mercial, includes a third of all first births, but less than a fourth of the fourth births and in a gradual declining scale by order of birth falls to only one-eighth of seventh births. The " upper " classes gave only just 700 children of seventh and over parity to the population of Dublin in the three years as compared with 6,000 contributed from the " lower " classes.
It is interesting to calculate for each of the main occupational groups the percentage of total births in each class by order of birth. These deduced figures for the year 1945 are shown in the following table.
TABLE XIII.
Births by Occujiition of Father expressed as Percentages by Order of Birth.
Occupational Group
I. Professional
II. Manual Workers, Super vi-visory and Skilled III. Manual Workers,
Semi-Skilled
IV. Manual Workers, Unskilled 1
35-5 16-5 24-1 23-9
2
33-9 16-5 25-6 24-0
3
29-9 16-7 26-1 27-3
ORDER OF BIRTH
4
26-0 17-4 26-2 30-4
5
21-0 16-8 28-0 34-2
6
16-7 18-6 28-1 36-6
7
13-7 13-7 30-2 42-4
8
9-2 11-5 36-3 43-0
9
9-8 12-6 31-6 46-0
10 and over
8-4 9-5 34-3 47-8
It will be noted that, whereas the professional classes accounted for 35 per cent, of first births, the unskilled manual labour class accounted for 24 per cent., whereas in the order of births, seventh, eighth and ninth, the proportions are very much reversed. In the eighth and ninth order of birth, the professional classes were less than 10 per cent, of all births in that order, while the unskilled manual labour class were from 43 per cent, to 46 per cent.
It would seem from the above table that there was a definite break in the professional class after the thir.d child, whereas in all other classes the break would seem to have occurred after the sixth child. Notwith-standing these variations, however, if the total number of births are taken into account, it will be found that the number of births in the professional group, as compared with the other groups, is almost pro-portional to the total number of adult males in each of these occupational groups.
72
to mothers whose age at marriage was less than 25 years of age, whereas in the semi-skilled manual labour group the percentage was 66 and in the skilled manual labour group 58 per cent., while in the professional and clerical group only 41 per cent, were under 25 years of age at marriage. The " age at marriage " group 25-29 years contained 41 per cent, of the professional class, 30 per cent, of the skilled labour class, 24 per cent, of the semi-skilled labour and 23 per cent, of the unskilled. The following are the percentages in each group :—
Age at Marriage Under 20 20-24 years 25-29 „ 30-34 ,, 35-39 ,, 40 and over
Professional, Commercial and Clerical Workers
5 36 41 15 3 0 100
Skilled Manual Workers
12 46 30 10 2 0 100
Semi-skilled Manual Workers
19 47 24 9 1 0 100
Unskilled Manual Workers
22 47 23 6 2 0 100
It will be seen that the last line is represented by ' 0 . ' There were
some births to mothers whose age at marriage was 40 years or over. The
actual numbers of children were 12, 8, 5 and 11 in the respective groups, but when expressed as percentages of the total for each class they were less than one-half per cent, and accordingly as the other percentages are cited in whole numbers they are represented by zero. Only 5 per cent, of the mothers in the under 20 years of age at marriage group were in the professional, commercial and clerical classes whereas there were 36 and 41 per cent, in each of the two following 5 years groups of ages.
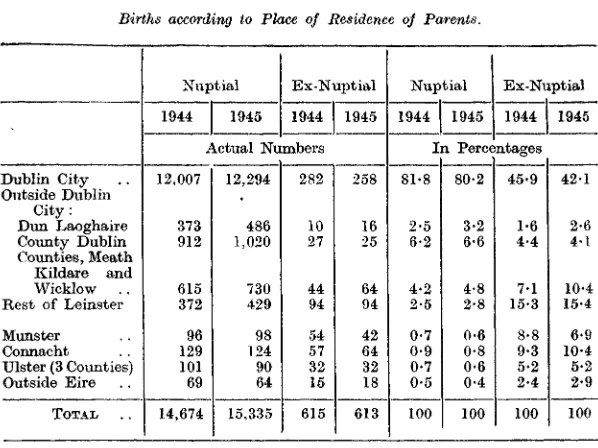
Place of Residence of Parents
Most of the children born in the City of Dublin were to parents whose residence is situate in the City of Dublin, but with the advantage of three class public maternity hospitals, together with equally first-class nursing homes and the availability of a great number of maternity doctors in the City, it is only to be expected that numbers of expectant mothers from outside the City would come to Dublin for their confine-ment. In each of the years under consideration the parents of approxi-mately 20 per cent, of the children born in Dublin, resided outside the City.
Parents residing in County Dublin and in the three neighbouring counties of Meath, Kildare and Wicklow account for more than two-thirds of the births " outside Dublin City." Proportionately more mothers came from the province of Connacht to Dublin for their confinement than from Munster, probably because of the better hospital facilities in Cork for maternity cases than are available in Galway.
TABLE XIV.
Births according to Place of Residence of Parents.
Dublin City Outside Dublin
City: Dun Laoghaire County Dublin Counties, Meath
Kildare and Wicklow Rest of Leinster Munster Connacht Ulster (3 Counties) Outside Eire
TOTAL . .
Nuptial 1944 1945
Ex-Nuptial 1944 1945 Actual Numbers 12,007
373 912 615 372 96 129 101 69 14,674
12,294 486 1,020 730 429 98 124 90 64 15,335
282 10 27 44 94 54 57 32 15 615
258 16 25 64 94 42 64 32 18 613
Nuptial 1944
I
81-8 2-5 6-2 4-2 2-5 0-7 0-9 0-7 0-5 100
1945 n Perce
80-2 3-2
4-8 2-8 0-6 0-8 0-6 0-4 100
Ex-Nuptial 1944 ntages
45-9 1-6 4-4 7-1 15-3 8-8 9-3 5-2 2-4 100
1945
42-1 2-6 4-1 10-4 15-4 6-9 10-4 5-2 2-9 100
Place of Birth—Hosoitals and N^rcino, w?™e: cr c;vn Hcme
It is interesting to compare the number of births which took place in the special Maternity Hospitals (Rotunda, Holies Street and Coombe) and private Nursing Homes, with those which took place in the mother's own home. The following were the numbers in the three years :
TABLE XV.
(a) Place of Birth.
Year
1943 1944 3945
Total Births
14,706 14,674 15,335
HOSPITALS, NURSING HOMES, ETC.
Coombe 1,765 1,663 1,738
Holies Street 2,782 2,908 3,156
Rotunda 3,434 3,629 3,569
Private Nursing Home
2,283 2,437 2,691
St. Kevin's
14 11 45
Mother's own Home
4,428 4,026 4,136
[image:18.402.52.351.70.294.2]74
Hospitals and Nursing Homes 1943 1944 1945 Parents' own Homes
1943 1944 1945
Total
10,278 10,648 11,199
4,428 4,026 4,136
Place
l
3,520 3,488 3,716
391 312 320
of Birth and Order of
2
2,266 2,442 2,552
595 571 657
3
1,474 1,504 1.614
642 668 605
4
870 989 1,055
640 568 581
5
625 631 677
'532 470 492
Births.
6
420 460 484
423 360 396
7
290 333 295
363 295 327
8
221 235 239
239 230 229
9
179 181 167
191 208 159
10 and
over
413 385 400
412 344 370
The following table shows the number of children born in the mother's own home according to parity or order of birth.
TABLE XVI.
Births in Mother's Own Home by Order of Birth.
Order of Birth
First Second Third Fourth Fifth Sixth Seventh . . Eighth Ninth Tenth and
over
TOTAL
Total Births
1943 3,911 2,861 2,116 1,510 1,157 843 653 460 370 325 14,706
1944 3,800 3,013 2,172 1,557 1,101 820 628 465 389 729 14,674
1945 4,036 3,209 2,219 1,636 1,169 880 622 468 326 770 15,335
Children born in Mother's Home 1943
391 595 642 640 532 423 363 239 191 412 4,428
1944 312 571 668 568 470 360 295 230 208 344 4,026
1945 320 657 605 581 492 396 327 229 159 370 4,136
Children born in Mother's own Home
as percentage of Total Birtl 1943
1 0 21 30 42 46 50
56
52 52 50 30
1944 8 19 31 37 43 44 44 50 54 47 28
i s
1945 8 21 28 36 42 45 53 50 50 48 27
The columns of percentages above show that 1 out of every 10 first births, 1 out of every 4 or 5 second births, 1 out of every 3 third births, and 1 out of every 2 births from the fifth order of parity onwards, occurred in the mother's own homes. Probably as the result of experience in child-bearing with lessening fears and risks and because of the domestic necessity of being at home to look after the other children and the general maintenance of the house, mothers were less inclined when having a fifth or later child to leave home for their confinement, but in the vast majority of first births in 1945 (roughly 3,700 out of 4,000), the mothers were confined in maternity hospitals or nursing homes.
Reproduction Rates:
the Gross Reproduction and Net Reproduction Rates of 1-27 and 1-01 respectively for Dublin City for that year as mentioned in my previous paper on births in Dublin. It may be as well to repeat the definition of reproduction rates which were given in that paper. The Gross Repro-duction Rate means the number of girl children which replace 1,000 potentially child-bearing females (i.e. those between ages of 15 and 50 years) in the previous generation, while the Net Reproduction Rate is based on the Gross Reproduction Rate, allowing for mortality of girls before the age of 15 years and of females between 15 and 50 years of age. The latest figure for England and Wales as published in the Report of the Registrar-General shows for that country a Net Reproduction Rate 0-909 which is less than unity indicating a definite decline in their popula-tion in the next generapopula-tion. The Dublin rate on the other hand points to some slight increase, but after a few years even this small natural increase will cease as a factor in increasing the total population of Dublin unless the population is augmented by immigration from other parts of Ireland or from outside countries.
One last remark. The figures of births in the City of Dublin given in this paper refer to the boundary area of the City as in each of the years. For instance the figures for 1945 include births that occurred in the added area of Howth and district (total population of 5,400) whereas the figures for the earlier years did not include births in that area. If this discrepancy was made right it is not thought that the revised figures would influence the general picture I have attempted to portray.
Mr. Honohan, proposing a vote of thanks, said that he envied Mr. Lyon
his facility for handling such a vast quantity of statistics. It was high time an improvement was made in our vital statistics, which were deficient in many respects, and those interested were greatly indebted to the author for the trouble and work he undertook in giving information which was otherwise not available.
It was interesting to note that the additional irformation in regard to births, which was elicited in Britain as a result of the Population (Statistics) Act, 1938, was (a) age of mother ; (b) date of marriage ; (c) number of children by present husband, and how many still living ; and (d) number of children by any former husband, and how many still living. It will be observed that Mr. Lyon's enquiries do not cover anything on the lines of (c) and (d).
A point of growing importance to remember when interpreting
illegiti-mate rates of births (especially in comparison with other countries— and some such comparisons are made in the paper) was that the increas-ing practice of artificial birth control in other places, and the habit of recording all births to a married woman as legitimate, made it difficult to accept such rates as measures of comparative moral degeneracy.
While the statistics presented had undoubted value and interest, the speaker felt that they threw little light on the question of fertility, which was, after all, the wider context for, and the real objective of, the study of births. The only real measure of fertility in the paper was at the end of the section on " Age of Mother at Marriage " (p..64), and the significant thing about that was, in the speaker's opinion, not so much the high proportion of high parity births to all births, but the fact that this proportion was going down.
76
" exposed to risk " was not taken into account. Comparisons between differ -ent social classes with a view to determining their relative fertility should have regard to age, to the proportions married, and, indeed, the numbers in each category. Incidentally, this point is well illustrated in the com-parison which is made towards the end of the section entitled " Age of Mother at Birth of Child " (pp. 63-64), that " Dublin is much lower in the percentage of births to mothers in the under 20 years of age and the 20 to 24 years of age groups, and higher in the 30 to 39 years of age groups, than in any of the other places for which comparisons are shown." This result is undoubtedly due to the different distributions of mothers through the different age-groups rather than to a different fertility.
With regard to the last section of the paper, the Society might profit-ably note that the reproduction rates heretofore in general use— which were really only a pa-rticular measure of fertility—were in recent times subjected to a measure of criticism, principally in the light of a difference between male and female rates—a condition of affairs which could not be justified as a permanent feature. It has been alleged, indeed, that many of the gloomy prognostications as to future populations based on a net reproduction rate for females of less than unity might be found —having regard to the higher male rates—to be unwarranted. Some combined rate may be found to be an improvement. A comprehensive and fully satisfactory measure of fertility should, in fact, be' a factor not only of age and duration of marriage, but should also have regard to the size of the existing family and the notion of family-building on the part of the parents, to the relation between the maternal and paternal approaches and to ii^r-claoS differentiation. It was distressing to realise that, while in other countries these matters were receiving—one might almost say of necessity—very close study, we could scarcely touch the subject at all, because of our deficient statistics. We were at least fortunate in not having a serious problem of fertility.
The President (Dr. Geary) remarked that, as the French say, Mr. Lyon's
paper " falls well " at the present juncture, particularly since the matter with which the paper deals comes within the terms of reference of the Commission of Population. Mr. Lyon has shown the way and the light. What he has done for Dublin must be done officially for the whole state, and this cannot be long delayed.
He (the President) did not agree with Mr. Honohan in his assessment of the value of the approach in this paper. Both the vital statistics and Census approaches are essential: indeed they are complementary. Amongst theorists, the reproduction rate is making heavy weather. As members are no doubt aware, the net reproduction rate is based exclusively on reproductivity of females, and in recent work it is shown that significantly different rates are found if both male and female reproductivity are taken into account. At the same time it is proving difficult to give the new extension the theoretical simplicity the old theory has been shown to possess by Lotka and others. He (the President) was sure, however, that the theoretical difficulty would be resolved.
:—-Social Group No. of births per cent, of 1st births in order:
1st 100
100 100 100
28 44 44 53
m
3110 16 21
I. Professional, commercial, etc. II. Manual workers, skilled III. Manual workers, semi-skilled
IV. Manual workers, unskilled