Proceedings of the Thirteenth Workshop on Innovative Use of NLP for Building Educational Applications, pages 45–55
Estimating Linguistic Complexity for Science Texts
Farah Nadeem and Mari Ostendorf
Dept. of Electrical Engineering University of Washington
{farahn,ostendor}@uw.edu
Abstract
Evaluation of text difficulty is important both for downstream tasks like text simplification, and for supporting educators in classrooms. Existing work on automated text complexity analysis uses linear models with engineered knowledge-driven features as inputs. While this offers interpretability, these models have lower accuracy for shorter texts. Traditional readability metrics have the additional draw-back of not generalizing to informational texts such as science. We propose a neural ap-proach, training on science and other informa-tional texts, to mitigate both problems. Our results show that neural methods outperform knowledge-based linear models for short texts, and have the capacity to generalize to genres not present in the training data.
1 Introduction
A typical classroom presents a diverse set of stu-dents in terms of their reading comprehension skills, particularly in the case of English language learners (ELLs). Supporting these students often requires educators to estimate accessibility of in-structional texts. To address this need, several automated systems have been developed to es-timate text difficulty, including readability met-rics like Lexile (Stenner et al.,1988), the end-to-end system TextEvaluator (Sheehan et al.,2013), and linear models (Vajjala and Meurers,2014; Pe-tersen and Ostendorf,2009;Schwarm and Osten-dorf, 2005). These systems leverage knowledge-based features to train regression or classifica-tion models. Most systems are trained on liter-ary and generic texts, since analysis of text diffi-culty is usually tied to language teaching. Existing approaches for automated text complexity analy-sis pose two issues: 1) systems using knowledge based features typically work better for longer texts (Vajjala and Meurers,2014), and 2)
complex-ity estimates are less accurate for informational texts such as science (Sheehan et al., 2013). In the context of science, technology and engineer-ing (STEM) education, both problems are signif-icant. Teachers in these areas have less expertise in identifying appropriate reading material for stu-dents as opposed to language teachers, and shorter texts become important when dealing with assess-ment questions and identifying the most difficult parts of instructional texts to modify for support-ing students who are ELLs.
Our work specifically looks at ways to address these two problems. First, we propose recurrent neural network (RNN) architectures for estimating linguistic complexity, using text as input without feature engineering. Second, we specifically train on science and other informational texts, using the grade level of text as a proxy for linguistic com-plexity and dividing grades k-12 into 6 groups. We explore four different RNN architectures in order to identify aspects of text which contribute more to complexity, with a novel structure introduced to account for cross-sentence context. Experi-mental results show that when specifically trained for informational texts, RNNs can accurately pre-dict text difficulty for shorter science texts. The models also generalize to other types of texts, but perform slightly worse than feature-based regres-sion models on a mix of genres for texts longer than 100 words. We use attention with all mod-els, both to improve accuracy, and as a tool to visualize important elements of text contributing to linguistic complexity. The key contributions of the work include new neural network architectures for characterizing documents and experimental re-sults demonstrating good performance for predict-ing readpredict-ing level of short science texts.
The rest of the paper is organized as follows: section 2 looks at existing work on automated readability analysis and introduces RNN
tures we build on for this work. Section3lays out the data sources, section4 covers proposed mod-els, and section5presents results. Discussion and concluding remarks follow in sections6and7.
2 Background
Studies have shown that language difficulty of in-structional materials and assessment questions im-pacts student performance, particularly for lan-guage learners (Hickendorff, 2013; Abedi and Lord,2001;Abedi,2006). This has lead to exten-sive work on readability analysis, some of which is explored here. The second part of this section looks at work that leverages RNNs in automatic text classification tasks and the use of attention with RNNs.
2.1 Automated Readability Analysis
Traditional reading metrics including Flesch-Kincaid (Kincaid et al.,1975) and Coleman-Liau index (Coleman and Liau, 1975) are often used to assess a text for difficulty. These metrics uti-lize surface features such as average length of sen-tences and words, or word lists (Chall and Dale,
1995). The development of automated text analy-sis systems has made it possible to leverage addi-tional linguistic features, as well as convenaddi-tional reading metrics, to estimate text complexity quan-tified as reading level. NLP tools can be used to extract a variety of lexical, syntactic and discourse features from text, which can then be used with traditional features as input to models for predict-ing readpredict-ing level. Some of the models include sta-tistical language models (Collins-Thompson and Callan,2004), support vector machine classifiers (Schwarm and Ostendorf,2005;Petersen and Os-tendorf,2009), and logistic regression (Feng et al.,
2010). Text coherence has also been explored as a predictor of difficulty level in (Graesser et al.,
2004), with an extended feature set that includes syntactic complexity and discourse in addition to coherence (Graesser et al.,2011).
A study conducted in (Nelson et al., 2012) in-dicates that metrics that incorporate a large set of linguistic features perform better at predicting text difficulty level; the metrics were specifically tested on the Common Core Standards (CCS) texts.1 Features from second language acquisition com-plexity measures were used in (Vajjala and Meur-ers,2012) to improve readability assessment. This
1http://www.corestandards.org/
feature set was further extended to include mor-phological, semantic and psycholinguistic features to build a readability analyzer for shorter texts ( Va-jjala and Meurers,2014). A tool specifically built for text complexity analysis for teaching and as-sessing is the TextEvaluatorTM. While knowledge-based features offer interpretability, a drawback is that if the text being analyzed is short, the feature vector is sparse, and prediction accuracy drops (Vajjala and Meurers,2014). This is particularly true for assessment questions, which are shorter than the samples most models are trained on.
Generally, for any text classification task, the type of text used for training the model is im-portant in terms of how well it performs; train-ing on more representative text tends to improve performance. The work in (Sheehan et al.,2013) shows that traditional readability measures under-estimate the reading level of literary texts, and overestimate that of informational texts, such as history, science and mathematics articles. This is due, in part, to the vocabulary specific to the genre. Science texts have longer words, though they may be easier to infer from context. Literary texts, on the other hand, might have simpler words, but more complicated sentence structure. The work demonstrated that more accurate grade level esti-mates can be obtained by two stage classification: i) classify the text as either literary, informational, or mixed, and then ii) use a genre-dependent ana-lyzer to estimate the level. In an analysis on how well a model trained on news and informational articles generalizes to the categories in CCS, the work in (Vajjala and Meurers,2014) shows better performance on informational genre than literary texts. Training on more representative text, how-ever, requires genre-specific annotated data.
2.2 Text Classification with RNNs
Recurrent neural networks (RNNs) are adept at learning text representations, as demonstrated by language modeling (Mikolov et al.,2010) and text classification tasks (Yogatama et al.,2017). Addi-tional RNN structures have been proposed for im-proved representation, including tree LSTMs (Tai et al.,2015) and a hierarchical RNN (Yang et al.,
2016). In addition, hierarchical models have been proposed to better represent document structure (Yang et al.,2016).
im-prove the performance of text classification (Yang et al., 2016). In machine translation, attention is computed over the source sequence when predict-ing the words in the target sequence. This “con-text” attention is based on a score computed be-tween the target hidden statehtand a subset of the
source hidden states hs. The score can be
com-puted in several ways, of which a general form is
score(ht, hs) =hTtWαhTs (Luong et al.,2015).
Attention has also been used for a variety of other language processing tasks. In particular, for text classification, attention weights are learned that target the final classification decision. This approach is referred to as “self attention” in (Lin et al.,2017), but will be referred to here as “task attention.” The hierarchical RNN in (Yang et al.,
2016) uses task attention mechanisms at both word and sentence levels. Since our work builds on this model, it is described in further detail in section
4. In addition, we propose extensions of the hi-erarchical RNN that leverage attention in different ways, including combining the concept of context attention from machine translation with task atten-tion to capture interdependence of adjoining sen-tences in a document.
3 Data
For our work we consider grade level as a proxy for linguistic complexity. Within a grade level, there is variability across different genres, which students are expected to learn. Since there is no publicly available data set for estimating grade level and text difficulty aimed at informational texts, we created a corpus using online science, history and social studies textbooks. The text-books are written for either specific grades, or for a grade range, e.g. grades 6-8. There are a total of 44 science textbooks and 11 history and social studies textbooks, distributed evenly across grades K-12. Given the distribution of textbooks for each grade level, we decide to classify into one of six grade bands: K-1, 2-3, 4-5, 6-8, 9-10 and 11-12. Because of our interest in working with short texts, we split the books into paragraphs, using end line as the delimiter.2 In addition to the textbooks, we also used the WeeBit corpus (Vajjala and Meurers,
2012) for training, again split into paragraphs.
2In splitting the text into paragraphs, we are implicitly
as-suming that all paragraphs have the same linguistic complex-ity as the textbook, which is probably not the case. Thus, there will be noise in both the training and test data, so some variation in the predicted levels is to be expected.
Grade Level All chapters chaptersTest set
K-1 25
-2-3 22 2
4-5 53 9
6-8 165 12
9-10 48 5
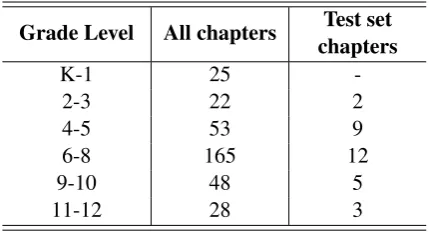
[image:3.595.309.524.62.178.2]11-12 28 3
Table 1: Chapter-based test data split
We have three different sources of test data: i) the CCS appendix B texts, ii) a subset of the on-line texts that we collected,3 and iii) a collection of science assessment items.
The CCS appendix B data is of interest be-cause it has been extensively used for evaluat-ing levaluat-inguistic complexity models, e.g. in (Sheehan et al., 2013; Vajjala and Meurers, 2014). It in-cludes both informational and literary texts. We use document-level samples from the CCS data for comparison to prior work, and paragraph-level samples to provide a more direct comparison to the information test data we created.
For the informational texts, we selected chap-ters from multiple open source texts. Since we had so few texts at the K-1 level, the test data only in-cluded texts from higher grade levels, as shown in table1. The paragraphs in these chapters were randomly assigned to test and validation sets.
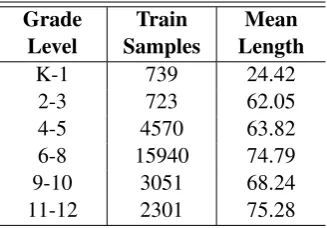
To assess the models on stand alone texts, we assembled a corpora of science assessment ques-tions from (Khot et al.,2015;Clark et al.,2018), AI2 Science Questions Mercury,4 and AI2 Sci-ence Questions v2.1 (October 2017).5 This test set includes 5470 questions for grades 6-8 from sources including standardized state and national tests. The average length of a question is 49 words. For training, two data configurations were used. When testing on the CCS data and the science assessment questions, there is no concern about overlap between training and test data, so all text can be used for training. We held out 10% of this data for analysis, and the remaining text is used for theD1 training configuration. Data statistics are given in table2. About 20% of the training
sam-3Available athttps://tinyurl.com/yc59hlgj. 4http://data.allenai.org/
ai2-science-questions-mercury/
5http://data.allenai.org/
Grade
Level SamplesTrain LengthMean
K-1 739 24.42
2-3 723 62.05
[image:4.595.100.264.62.176.2]4-5 4570 63.82 6-8 15940 74.79 9-10 3051 68.24 11-12 2301 75.28
Table 2: Training data (D1) with mean length of text in
words
ples (5152) are from WeeBit, spread across grades 2-12. For testing on all three sets, we defined a training configuration D2 that did not include any text from chapters overlapping with the test data, so there training set is somewhat smaller than forD1, except for grades K-1. The same WeeBit training data was included in both cases.
For the elementary grade levels, we have much less data than for middle school, and for high school, we have substantial training data with coarser labels (grades 9-12). To work around both issues, we first used all training samples to train the RNN to predict one of four labels (grades K-3, 4-5, 6-8 and 9-12). We then used the training data with fine labels to train to predict one of six labels. This approach was more effective than alternating the training.
4 Models for Estimating Linguistic Complexity
This section introduces the four RNN structures for linguistic complexity estimation, including: a sequential RNN with task attention, a hierarchical attention network, and two proposed extensions of the hierarchical model using multi-head atten-tion and attenatten-tion over bidirecatten-tional context. In all cases, the resulting document vector is used in a fi-nal stage of ordifi-nal regression to predict linguistic complexity. All systems are trained in an end-to-end fashion.
4.1 Sequential RNN
The basic RNN model we consider is a sequential RNN with task attention, where the entire text in a paragraph or document is taken as a sequence. For a documentti with wordsK words wik k ∈
{1,2, ..., K}, a bidirectional GRU is used to learn representation for each wordhik, using a forward
run from wi1 to wiK, and a backward run from
wiKtowi1.
−→
hik =−−−→GRU(wik) (1)
←−
hik =←−−−GRU(wik) (2)
hik= [−→hik,←−hik] (3)
Attention is computed over the entire sequence
αik, and used to compute the document
represen-tationviseq:
uik=tanh(Wshik+bs) (4)
αik = exp(u
T ikus) P
ikexp(uTikus) (5)
viseq =Pkαikhik (6)
The document vector is used to predict reading level. Since the grade levels are ordered categori-cal labels, we implement ordinal regression using the proportional odds model (McCullagh, 1980). For the reading level labelsj ∈ {1,2, ..., J}, the cumulative probability is modeled as
P(y≤j|viseq) =σ(βj−wordT vseqi ), (7)
where σ(.) is the sigmoid function, and βj and
wordare estimated during training by minimizing
the negative log-likelihood
Lord= −Pilog(σ(βj(i)−wordT v seq
i )− (8)
σ(βj(i)−1−wTordviseq)).
4.2 Hierarchical RNN
While a sequential RNN has the capacity to cap-ture discourse across sentences, it does not capcap-ture document structure. Therefore, we also explored the hierarchical attention network for text classifi-cation from (Yang et al.,2016). The model builds a vector representation vi for each document ti
with L sentences sl, l ∈ {1,2, .., L}, each with
Tl wordswlt,t ∈ {1,2, ..., Tl}. The first level of
the hierarchy takes words as input and learns a rep-resentation for each wordhltusing a bidirectional
GRU. Task attention at the word level αlt
high-lights words important for the classification task, and is computed using the word level context vec-tor uw. The word representations are then
aver-aged using attention weights to form a sentence representationsl
αlt= exp(u
T ltuw) P
texp(uTltuw) (9)
where ult = tanh(Wwhlt+bw) is a projection
of the target hidden state for learning word-level attention. The second level of the hierarchy takes the sentence vectors as input, learns representation
hl for them using a bidirectional GRU. Using a
method similar to the word-level attention, a doc-ument representationviis created using
sentence-level task attentionαlwhich is computed using the
sentence level context vectorus
αl = exp(u
T lus) P
lexp(u T
lus) (11)
vi=Plαlhl, (12)
whereul=tanh(Wshl+bs)is analogous toultat
the sentence level. The word- and sentence-level context vectors,uwandus, as well asWw,Ws,bw
andbs, are learned during training.
4.3 Multi-Head Attention
Work has shown that having multiple attention heads improves neural machine translation tasks (Vaswani et al.,2017). To capture multiple aspects contributing to text complexity, we learn two sets of word level task attention over the word level GRU output. These two sets of sentence vectors feed into separate sentence-level GRUs to give us two document vectors by averaging using task at-tention weights at the sentence level. The doc-ument vectors are then concatenated to form the document representation. The multi-head atten-tion RNN is shown in figure1.
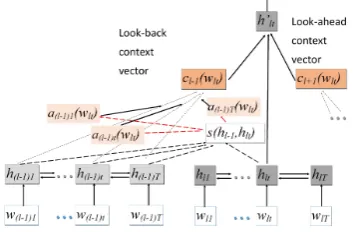
4.4 Hierarchical RNN with Bidirectional Context
The hierarchical model is designed for represent-ing document structure, however, the sentences within a document are encoded independently. To capture information across sentences, we extend the concept of context attention used in machine translation, using it to learn context vectors for adjoining sentences. We extend the hierarchical RNN by introducing bi-directional context with attention. Using the word level GRU output, a “look-back” context vectorcl−1(wlt)is calculated
using context attention over the preceding sen-tence, and a “look-ahead” context vectorcl+1(wlt)
using context attention over the following sen-tence for each word in the current sensen-tence.
α(l−1)t(wlt) =
exp(score(hlt,h(l−1)t)) P
t0exp(score(hlt,h(l−1)t0)) (13)
cl−1(wlt) =Pt0α(l−1)t0(wlt)h(l−1)t0 (14)
α(l+1)t(wlt) =
exp(score(hlt,h(l+1)t)) P
t0exp(score(hlt,h(l+1)t0)) (15)
cl+1(wlt) =Pt0α(l+1)t0(wlt)h(l+1)t0 (16)
where score(hlt, hkt) = hltWαhTkt and a single
Wα is used for computing the score in both
direc-tions. The context vectors are concatenated with the hidden state to form the new hidden stateh0lt.
h0lt= [cl−1(wlt), hlt, cl+1(wlt)] (17)
The rest of the structure is the same as a hierarchi-cal RNN, using equations9-12withh0ltinstead of hlt. Figure2 shows the structure for calculating
‘look-back” context.
4.5 Implementation Details
The implementation is done via the Tensorflow library (Abadi et al., 2016).6 All RNNs use GRUs (Cho et al.,2014) with layer normalization (Ba et al., 2016), trained using Adam optimizer (Kingma and Ba, 2014) with a learning rate of 0.001. Regularization was done via drop out. The validation set was used to do hyper-parameter tun-ing, with a grid search over drop out rate, number of epochs, and hidden dimension of GRU cells. Good result for all four architectures are obtained with a batch size of 10, a dropout rate of 0.5-0.7, a cell size of 75-250 for the word-level GRU, and a cell size of 40-75 for the sentence-level GRU. For the RNN, we also trained a version with a larger word-level hidden layer cell size of 600.
Pre-trained Glove embeddings7are used for all models (Pennington et al.,2014), using a vocabu-lary size of 65000-75000.8 The out of vocabulary (OOV) percentage on the CCS test set was 3%, and on the informational test set was 0.5%. All OOV words were mapped to an ‘UNK’ token. The text was lower-cased, and split into sentences for the hierarchical models using the natural language toolkit (NLTK) (Loper and Bird,2002).
5 Results and Analysis
We test our models on the two science test sets, as well as on the CCS appendix B document level texts and a paragraph-level version of these texts. We also evaluated the best performing
6The code and trained models are available athttps:
//github.com/Farahn/Liguistic-Complexity.
7http://nlp.stanford.edu/data/glove.
840B.300d.zip
8In vocabulary words not present in Glove had randomly
Figure 1: RNN with Multi-Head Attention
Figure 2: RNN with Bidirectional Context and Atten-tion
model on the middle school science questions data set. Since both the true reading level and predicted levels are ordered variables, we use Spearman’s rank correlation as the evaluation metric to cap-ture the monotonic relation between the predic-tions and the true levels.
As a baseline, we use the WeeBit linear regres-sion system (Vajjala and Meurers, 2014). The WeeBit system uses knowledge-based features as input to a linear regression model to predict read-ing level as a number between 1 and 5.5, which maps to text appropriate for readers 7-16 years of age. The feature set includes parts-of-speech (e.g. density of different parts-of-speech), lexical (e.g. measurement of lexical variation), syntactic (e.g. the number of verb phrases), morphological (e.g. ratio of transitive verbs to total words) and psycholinguistic (e.g. age of acquisition) features. There are no features related to discourse, thus it is possible to compute features for sentence level texts. The system was trained on a subset of the data that our system was trained on, so it is at a disadvantage. We did not have the capability to
retrain the system.
5.1 Results by Genre
Results for the different models:
• sequential RNN with self attention (RNN),
• large sequential RNN with self attention (RNN 600),
• hierarchical RNN with attention at the word
and sentence level (HAN),
• hierarchical RNN with bidirectional context and attention (BCA), and
• multi-head attention (MHA)
are shown in table3, together with the results for the WeeBit system which has state-of-the-art re-sults on the CCS documents. For the CCS data, both D1 andD2 training configurations are used for the neural models; onlyD2 is used for the in-formational test set. For all of these models the hidden layer dimension for the word level was be-tween 125 and 250. We also trained a sequential RNN with a larger hidden layer dimension of 600. The HAN does better for document level sam-ples than a sequential RNN; the converse is true for paragraph level texts. The RNN with a larger hidden layer dimension performs better for longer texts, while the performance for smaller dimen-sion RNN deteriorates with increasing text length. The BCA model seems to generalize to longer documents and new genres better than the other neural networks.
Test Set Model Samples WeeBit RNN RNN 600 HAN BCA MHA CCS Document D1 168 0.69 0.28 0.43 0.47 0.55 0.42 CCS Paragraphs D1 1532 0.36 0.30 0.25 0.29 0.32 0.28 CCS Document D2 168 0.69 0.34 0.38 0.43 0.48 0.43 CCS Paragraphs D2 1532 0.36 0.27 0.26 0.24 0.30 0.29 Informational
[image:7.595.311.524.213.353.2]Paragraphs D2 1361 0.22 0.51 0.60 0.60 0.62 0.60
[image:7.595.83.274.225.355.2]Table 3: Results (Spearman Rank Correlation)
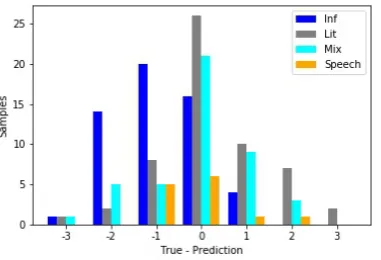
Figure 3: Error distribution for the CCS documents BCA(D1)
predicted, which we hypothesize is roughly due to specific articles related to the United States history and constitution. The only training data for our models with that subject is in the grades 6-8 and 9-12 categories. The performance for literary and mixed texts, on the other hand, is roughly unbi-ased; this shows that the model is better at general-izing to non-informational texts, even when there are no literary text samples in the training data.
5.2 Results by Length
Figures4and5show the performance of our mod-els and the WeeBit model as a function of docu-ment length, both on the informational paragraphs test set and the CCS paragraph level test set. The results indicate that for shorter texts, particularly under 100 words, neural models tend to do better. Even for a mixture of genres, the model with bidi-rectional context performs better than the feature-based regression model, as shown in figure5.
It is likely that the WeeBit results results on shorter texts would improve if trained on the same training set that is used for the neural models. However, we hypothesize that the feature-based approach is less well suited for shorter documents because the feature vector will be more sparse.
Figure 4: Performance vs. text length for informational paragraphs BCA(D2)
Comparing the CCS document- and paragraph-level test sets, the average percentage of features that are zero-valued is 28% for document-level texts and 44% for paragraph-level texts. The most sparse vectors are 40% and 81% for document and paragraph-level texts, respectively.
5.3 Results for Science Assessment Questions
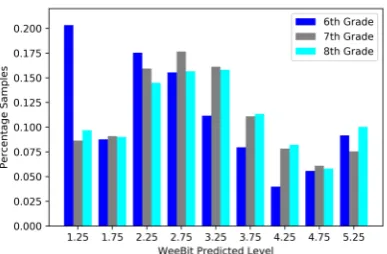
Finally, we apply both the baseline WeeBit system and our best model (BCA trained onD1) to the set of 5470 grade 6-8 science questions. The results are shown in figures6and7, where the grade 6-8 category (ages 11-14) corresponds to predicted level 3 for BCA and predicted level 4 for WeeBit. The results indicate that BCA predictions are bet-ter aligned with human rankings than the baseline. As expected, grade 6 questions more likely to be predicted as less difficult than grade 8 questions.
5.4 Attention Visualization
Attention can help provide insight into what the model is learning. In the analyses here, all at-tention values are normalized by dividing by the highest attention value in the sentence/document to account for different sequence lengths.
Figure 5: Performance vs. maximum text length for CCS paragraphs BCA(D1)
BCA and HAN for a sample text from the science assessment questions test set. (Attention weights in the figure are smoothed to reflect the fact that a word vector from a biLSTM reflects the word’s context.) The results show that attention weights are more sparse for HAN than for BCA. At the sentence level (not shown here), the BCA sentence weights tend to be more uniformly distributed, whereas HAN weights are again more selective.
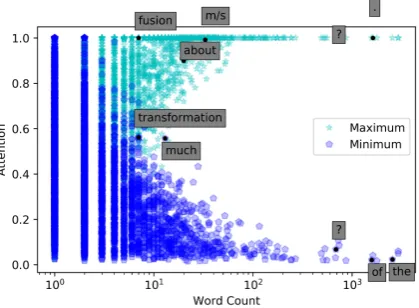
Another aspect of the attention is that a word does not have the same attention level for all oc-currences in a document. We look at maximum and minimum values of attention as a function of word frequency for each grade band, shown in fig-ure9for grade 6-8 science assessment questions. The pattern is similar for each grade band in the validation and test sets. The minimum atten-tion values assigned to a word drop with increas-ing word frequency, while the maximum values increase. This suggests that the attention weights are more confident for more frequent words, such as of. Words like fusion and m/s get high
max-Figure 6: BCA predicted levels for middle school sci-ence assessment questions
imum attention values, despite not being as high frequency as words likeof andthe. This may in-dicate that they are likely to contribute to linguis-tic complexity. The fact thattransformationhas a high minimum is also likely an indicator of its im-portance. For HAN without bidirectional context, a similar visualization shows that while the trend is similar, the attention weights typically tend to be lower, both for minimum and maximum values.
We find that sentence-end tokens (period, ex-clamation and question mark) have high average attention weight, ranging from 0.54 to 0.81, while sentence-internal punctuation (comma, colon and semicolon) get slightly lower weights, ranging from 0.20 to 0.47. The trend is similar for all grades. These high attention values might be due to punctuation serving as a proxy for sentence structure. It is interesting to note that the question mark gets higher minimum attention value than period, despite being high frequency. It may be that questions carry information that is particularly relevant to informational text difficulty.
6 Discussion
Our work differs from existing models that es-timate text difficulty since we do not use engi-neered features. There are advantages and dis-advantages to both approaches, which we briefly discuss here. Models using engineered features based on research on language acquisition offer interpretability and insight into which specific lin-guistic features are contributing to text difficulty. An additional advantage of using engineered fea-tures in a regression or classification model is that less training data is required.
However, given both the evolving theories in
[image:8.595.311.505.596.723.2] [image:8.595.81.273.597.723.2]Figure 8: Word level attention visualization for BCA (top) and HAN (bottom) for a middle school science assessment question
Figure 9: Maximum and minimum values of attention as a function of word count for BCA
language acquisition and the large number of vari-ables that impact second language acquisition, the methodologies used in language acquisition re-search have certain limitations. For example, the number of variables that can be considered in a study is practically limited, the sample popula-tion is often small, and the quespopula-tion of qualita-tive vs. quantitaqualita-tive methodologies used can influ-ence outcomes (more details in (Larsen-Freeman and Long, 2014; Mitchell et al., 2013)). These limitations can carry into the feature engineering process. Using a model with text as input ensures that these constraints are not inherently part of the model; the performance of the system is not lim-ited by the features provided. Of course, perfor-mance is limited by the training data, both in terms of the cost of collection and any biases inherent in the data. In addition, with advances in neural ar-chitectures such as attention modeling, there may
be opportunities for identifying specific aspects of texts that are particularly difficult, though research in this direction is still in early stages.
7 Conclusion
In summary, this work explored different neural architectures for linguistic complexity analysis, to mitigate issues with accuracy of systems based on engineered features. Experimental results show that it is possible to achieve high accuracy on texts shorter than 100 words using RNNs with attention. Using hierarchical structure improves results, par-ticularly with attention models that leverage bidi-rectional sentence context. Testing on a mix of genres shows that the best neural model can gen-eralize to subjects beyond what it is trained on, though it performs slightly worse than a feature-based regression model on texts longer than 100 words. More training data from other genres will likely reduce the performance gap. Analysis of attention weights can provide insights into which phrases/sentences are important, both at the aggre-gate and sample level. Developing new methods for analysis of attention may be useful both for improving model performance and for providing more interpretable results for educators.
Two aspects not considered in this work are ex-plicit representation of syntax and discourse struc-ture. Syntax can be incorporated by concatentat-ing word and dependency embeddconcatentat-ings at the token level. Our BCA model was designed to capture cross-sentence coherence and coordination, but it may be useful to extend the hierarchy for longer documents and/or introduce explicit models of the types of discourse features used in Coh-Metrix (Graesser et al.,2004).
Acknowledgments
We thank Dr. Meurers, Professor University of Tubingen, and Dr. Vajjala-Balakrishna, Assistant Professor Iowa State University, for sharing the WeeBit training corpus, their trained readability assessment model and the Common Core test cor-pus.
References
heterogeneous distributed systems. arXiv preprint arXiv:1603.04467.
Jamal Abedi. 2006. Psychometric issues in the ELL as-sessment and special education eligibility. Teachers College Record, 108(11):2282.
Jamal Abedi and Carol Lord. 2001. The language fac-tor in mathematics tests. Applied Measurement in Education, 14(3):219–234.
Jimmy Lei Ba, Jamie Ryan Kiros, and Geoffrey E Hin-ton. 2016. Layer normalization. arXiv preprint arXiv:1607.06450.
Dzmitry Bahdanau, Kyunghyun Cho, and Yoshua Ben-gio. 2014. Neural machine translation by jointly learning to align and translate. arXiv preprint arXiv:1409.0473.
Jeanne Sternlicht Chall and Edgar Dale. 1995. Read-ability revisited: The new Dale-Chall readRead-ability formula. Brookline Books.
Kyunghyun Cho, Bart Van Merri¨enboer, Caglar Gul-cehre, Dzmitry Bahdanau, Fethi Bougares, Holger Schwenk, and Yoshua Bengio. 2014. Learning phrase representations using rnn encoder-decoder for statistical machine translation. arXiv preprint arXiv:1406.1078.
Peter Clark, Isaac Cowhey, Oren Etzioni, Tushar Khot, Ashish Sabharwal, Carissa Schoenick, and Oyvind Tafjord. 2018. Think you have solved question an-swering? try arc, the ai2 reasoning challenge. arXiv preprint arXiv:1803.05457.
Meri Coleman and Ta Lin Liau. 1975. A computer readability formula designed for machine scoring.
Journal of Applied Psychology, 60(2):283.
Kevyn Collins-Thompson and James P. Callan. 2004.
A language modeling approach to predicting read-ing difficulty. InHuman Language Technology Con-ference of the North American Chapter of the Asso-ciation for Computational Linguistics, HLT-NAACL 2004, Boston, Massachusetts, USA, May 2-7, 2004, pages 193–200.
Lijun Feng, Martin Jansche, Matt Huenerfauth, and No´emie Elhadad. 2010. A comparison of features for automatic readability assessment. In Proceed-ings of the 23rd International Conference on Com-putational Linguistics: Posters, pages 276–284. As-sociation for Computational Linguistics.
Arthur C. Graesser, Danielle S. McNamara, and Jonna M. Kulikowich. 2011. Coh-metrix. Educa-tional Researcher, 40(5):223–234.
Arthur C Graesser, Danielle S McNamara, Max M Louwerse, and Zhiqiang Cai. 2004. Coh-metrix: Analysis of text on cohesion and language. Behav-ior Research Methods, 36(2):193–202.
Marian Hickendorff. 2013. The language factor in el-ementary mathematics assessments: Computational skills and applied problem solving in a multidimen-sional irt framework. Applied Measurement in Edu-cation, 26(4):253–278.
Tushar Khot, Niranjan Balasubramanian, Eric Gribkoff, Ashish Sabharwal, Peter Clark, and Oren Etzioni. 2015. Markov logic networks for natural language question answering. arXiv preprint arXiv:1507.03045.
J Peter Kincaid, Robert P Fishburne Jr, Richard L Rogers, and Brad S Chissom. 1975. Derivation of new readability formulas (automated readability in-dex, fog count and flesch reading ease formula) for navy enlisted personnel. Technical report, Naval Technical Training Command Millington TN Re-search Branch.
Diederik P Kingma and Jimmy Ba. 2014. Adam: A method for stochastic optimization. arXiv preprint arXiv:1412.6980.
Diane Larsen-Freeman and Michael H Long. 2014.
An introduction to second language acquisition re-search. Routledge.
Zhouhan Lin, Minwei Feng, Cicero Nogueira do San-tos, Mo Yu, Bing Ziang, Bowen Zhou, and Yoshua Bengio. 2017. A structured self-attentive sentence embedding. InProc. ICLR.
Edward Loper and Steven Bird. 2002. Nltk: The natu-ral language toolkit. InProceedings of the ACL-02 Workshop on Effective tools and methodologies for teaching natural language processing and computa-tional linguistics-Volume 1, pages 63–70. Associa-tion for ComputaAssocia-tional Linguistics.
Minh-Thang Luong, Hieu Pham, and Christopher D Manning. 2015. Effective approaches to attention-based neural machine translation. arXiv preprint arXiv:1508.04025.
Peter McCullagh. 1980. Regression models for ordinal data. Journal of the royal statistical society. Series B (Methodological), pages 109–142.
Tom´aˇs Mikolov, Martin Karafi´at, Luk´aˇs Burget, Jan ˇCernock`y, and Sanjeev Khudanpur. 2010. Recur-rent neural network based language model. In
Eleventh Annual Conference of the International Speech Communication Association.
Rosamond Mitchell, Florence Myles, and Emma Mars-den. 2013. Second language learning theories. Routledge.
Jeffrey Pennington, Richard Socher, and Christopher Manning. 2014. Glove: Global vectors for word representation. InProceedings of the 2014 confer-ence on empirical methods in natural language pro-cessing (EMNLP), pages 1532–1543.
Sarah E Petersen and Mari Ostendorf. 2009. A ma-chine learning approach to reading level assessment.
Computer speech & language, 23(1):89–106.
Sarah E Schwarm and Mari Ostendorf. 2005. Reading level assessment using support vector machines and statistical language models. In Proceedings of the 43rd Annual Meeting on Association for Computa-tional Linguistics, pages 523–530. Association for Computational Linguistics.
Kathleen M Sheehan, Michael Flor, and Diane Napoli-tano. 2013. A two-stage approach for generating un-biased estimates of text complexity. InProceedings of the Workshop on Natural Language Processing for Improving Textual Accessibility, pages 49–58.
AJ Stenner, Ivan Horabin, Dean R Smith, and Malbert Smith. 1988. The lexile framework. Durham, NC: MetaMetrics.
Kai Sheng Tai, Richard Socher, and Christopher D Manning. 2015. Improved semantic representations from tree-structured long short-term memory net-works. arXiv preprint arXiv:1503.00075.
Sowmya Vajjala and Detmar Meurers. 2012. On im-proving the accuracy of readability classification us-ing insights from second language acquisition. In
Proceedings of the Seventh Workshop on Building Educational Applications Using NLP, pages 163– 173. Association for Computational Linguistics.
Sowmya Vajjala and Detmar Meurers. 2014. Read-ability assessment for text simplification: From analysing documents to identifying sentential sim-plifications. ITL-International Journal of Applied Linguistics, 165(2):194–222.
Ashish Vaswani, Noam Shazeer, Niki Parmar, Jakob Uszkoreit, Llion Jones, Aidan N Gomez, Łukasz Kaiser, and Illia Polosukhin. 2017. Attention is all you need. InAdvances in Neural Information Pro-cessing Systems, pages 6000–6010.
Zichao Yang, Diyi Yang, Chris Dyer, Xiaodong He, Alexander J Smola, and Eduard H Hovy. 2016. Hi-erarchical attention networks for document classifi-cation. InHLT-NAACL, pages 1480–1489.