OPTIMAL TRANSPORT PRICING FOR DUBLIN
1. INTRODUCTION
Margaret O'Mahony Kieran Kirwan Trinity College Dublin
Sean McGrath Luis Willumsen
Steer Davies Gleave (Ireland)
Under the JOULE II Research Programme of the EU on non-nuclear energy, a
consortium ofBelgian, German, Irish and Italian research groups has been studying the optimisation of transport prices and taxation and its impact on energy consumption and emissions. The TRENEN study involves the development of two models which are based on welfare economics- one deals with the inter-urban situation; the other deals with the urban situation. These models are more aggregate in approach than
conventional transport models in that the network is treated through a single 'representative area-wide lin/C. This difference along with others, which will be described later, made the research objective of the Irish input all the more interesting as ways of combining such an aggregate model and a standard network model were investigated.
This paper reports on part of the Irish input to the TRENEN project where the main objectives of the Civil, Structural and Environmental Engineering Department of Trinity College Dublin (TCD) and Steer Davies Gleave (SDG) team were:
• to establish the best functional form for a flow delay relationship for input to the urban optimisation model (TRENEN) using the SATURN-SATCHMO model of Dublin compiled during the Dublin Transportation Initiative (Steer Davies Gleave,
1994),
• to calibrate the TRENEN model for Dublin, and
• to examine methods of combining the use of an aggregate economics model such as TRENEN with a conventional transportation network model to address the optimal combination of price and regulatory policies in the energy-environment and
transport domain.
The part of the work on which this paper reports is the calibration for Dublin and one of the case studies conducted using a combination of the two urban models. As the models are, by their nature, quite different in approach direct comparisons are difficult but one means of possible comparison is by examination of modal split which is a direct output ofboth models.
2. CALffiRA TION OF THE TRENEN MODEL FOR DUBLIN The TRENEN model (Ochelen and Proost, 1995) seeks a market equilibrium by maximisation of a welfare function under a set of policy constraints. Before this maximisation can take place, a reference situation must be compiled for the city under test, which represents base year conditions with respect to transport demand, pricing and taxing regimes and base year car technology. The reference situation for Dublin was compiled using mainly the data collected for the Dublin Transportation Initiative (Steer Davies Gleave, 1994). Some additional information on public transport charges was obtained by direct communication with public transport companies and it was also necessary to obtain data on the current car fleet, including such information as
insurance costs, capital costs, etc.
Using the reference situation as the starting point the model was run in optimisation mode where the model is allowed to choose the best pricing and regulatory policies without any constraints. In effect, this optimum represents a very elaborate and effective tax and pricing regime where the actual marginal cost of every passenger kilometre in different traffic conditions (peak and off-peak) is costed and charged. This pricing regime can only be looked upon as an ideal situation but too difficult to
implement in practice. However, it is useful as a benchmark to evaluate the effectiveness of other policy measures of a more practical nature.
To increase realism the model was run again to examine taxation of private car use as the only policy tool. This was one of many case studies conducted by the Irish team during the course of the research. The instrument used in the case study presented here is the application of a toll on private vehicles crossing a designated cordon on their way to the city centre. The cordon is set up on what is considered to be the boundary of the Central Business District. In this particular scenario, private vehicle taxation is the only means by which optimisation of welfare can be achieved i.e. the model is not allowed to make changes to car technology restrictions or changes to public
transportation pricing.
3. INPUT DATA FOR THE CALffiRATION OF THE MODEL
The area to which the TRENEN model is applied in the Dublin region is the area studied in the Dublin Transportation Initiative (Steer Davies Gleave, 1994). The region has a population of 1. 14 million and covers Dublin city and county, including parts of Meath, Wicklow and Kildare. Dublin consists of a central business district surrounded by a combination of industrial and residential areas and consequently suffers the typical traffic congestion problems associated with such a layout which stimulates high levels of commuting traffic in the peak periods.
As the level of traffic congestion directly influences both delay and environmental pollution levels, then clearly it has a strong influence on the marginal cost of congestion and pollution. To represent the changing traffic conditions, the model requires a relationship between traffic flow and delay in the area for inclusion in the representative link. This was compiled using a trip matrix factorisation method (Kirwan, O'Mahony and O'Sullivan, 1995). The functional form chosen was of an
exponential type; the average speed during the peak hour (8:00-9:00) according to this relationship is 30kph for a traffic level of 1.15 million passenger car unit kilometres. In the off-peak period, the average speed is 34 kph for a traffic level of0.9 million passenger car unit kilometres. These match well observations made during the Dublin Transportation Initiative. It is assumed that there are two peak hours in every day with eleven off-peak hours.
The other main input for the calibration is a set of elasticities of substitution which are instrumental to the aggregate modelling approach used in the TRENEN model. These can be contrasted with the values chosen for Brussels by Ochelen and Proost (1995).
Using these elasticities of substitution, general price elasticities can be computed for the reference situation. A comparison ofthe price elasticities oftransport calculated for Dublin with those for Brussels (Ochelen and Proost, 1995) are presented in Table 1.
[image:3.612.119.522.237.355.2]-0.724 -1.261
Table 1. Price elasticities of transport in Dublin and Brussels
The elasticities of substitution are chosen to reproduce as closely as possible the price elasticities oftransport presented in literature such as Glaister and Lewis (1978 ) and Goodwin (1992). The relationship between elasticities of substitution and price elasticities is detailed in Ochelen and Proost ( 1995).
4. REPRESENTATION OF TRANSPORT SUPPLY
As with Ochelen and Proost (1995), the supply side ofthe model is kept simple where supply is represented by the resource costs of the transport modes available. In the case ofDublin, this implies two modes of transport; bus and car. Although a rail based mode exists in the form of a heavy rail system running north-south in the coastal area (DART), it is not included as a mode in this study as it is only available to a small.
proportion of travellers. When the TRENEN model has been disaggregated further, at a later stage, to allow for more detailed examination of different area types, the DART system will be included. Alternatively, when the proposed LRT routes are implemented in line with the recommendations of the Dublin Transportation Initiative (Steer Davies Gleave, 1994), making a rail based mode available to most travellers in the city, then a third mode of travel will be included in the TRENEN model ofDublin.
4.1 Public Transport Supply
The resource costs and patronage information for public transport were obtained from the Dublin Bus Annual Report (1993) and from communication with representatives of Dublin Bus. The inputs required by TRENEN include a measure of the cost to provide a public transport service and the charge to the user for that service. The following is a summary of the calculations involved in deriving these inputs for the public transport mode.
With regard to the allocation of resource costs, the peak period demand for bus provision is the more critical as it controls the size of the fleet required. The fixed costs, therefore, including depreciation, insurance etc. are allocated to the peak period.
The annual total mileage of travel by buses in Dublin is 46.24 million miles but only 84% of this is revenue earning~ the remaining 16% being 'out-of-service' mileage. The operating cost of providing the service is 117.56 MECU. To calculate the resource cost per passenger km as required by the TRENEN model, information on vehicle occupancy rates was needed. By proportioning an average weekly occupancy rate of 20 in line with hourly passenger boarding information, hourly occupancy rates were calculated. The resource costs per passenger km calculated using the occupancy rates obtained above for the peak and off-peak hours are 0.12 ECUs and 0.14 ECUs respectively.
Average fares were calculated on the basis that in the case ofDublin bus users pay 92% of the operating costs of the bus service. An average fare per passenger km can be calculated at 0. 141 ECU s by dividing the total operating costs by the total in-service travel.
4.2 Private Transport Supply
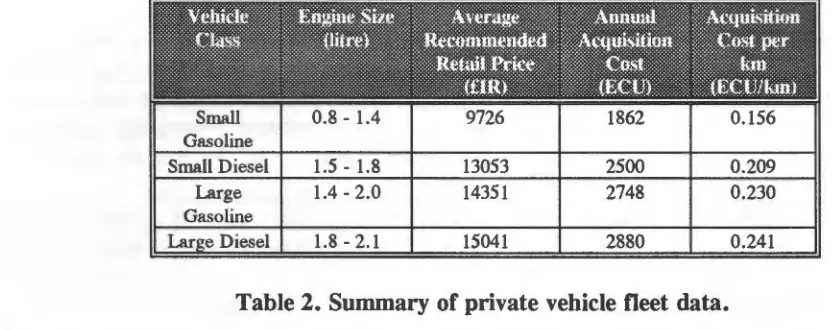
The resource costs of private transport include vehicle acquisition, fuel, insurance, maintenance and parking costs. To obtain representative input data on vehicle acquisition costs an average recommended retail price (RRP) was calculated from a sample of 106 vehicles representing eleven ofthe most popular cars bought in 1991. The retail prices for each vehicle in the sample were obtained from the Society of the Irish Motor Industry (1991). Summary calculations are presented in Table 2.
The annual acquisition cost represents the annual saving which must be made by an individual in order to be able to buy the same car after six years allowing for an interest rate of 8.6% (Mayeres, 1993). The acquisition cost in ECU per kilometre listed in Table 2 is calculated on the assumption that an average car in use in an urban area travels 15,100 kilometres per annum.
Table 2. Summary of private vehicle fleet data.
A full breakdown of the vehicle fleet by fuel type and engine size was not available but the Society of the Irish Motor Industry (1991) indicates that few diesel models on the market in Ireland have an engine size less than 1.5 litres and so this was the smallest diesel class on which data could be found.
The price of fuel including its production and distribution costs is 0.26 ECU/litre for gasoline and 0.23 ECU/litre for diesel. When. VAT and excise are included these costs rise to 0. 79 ECU/litre for gasoline and 0. 71 ECU/litre for diesel. The fuel consumption rates are assumed to be the same as those used by Ochelen and Proost (1995).
Other private vehicle operating costs include insurance, motor taxation and general maintenance. This information was obtained from AA Technical Services (1991), Central Statistics Office (1988) and the Motor Insurance Advisory Board (1993).
5.
TRANSPORT DEMANDTransport demand for input to the TRENEN model was calculated from the network model and data collected during the DTI (Steer Davies Gleave, 1994). Demand in the network model is based on the number of trips generated whereas in the TRENEN model, demand is represented as the number of passenger kilometres required by an average individual for an average day. These daily demands were estimated using hourly indicators of traffic levels such as cordon crossings and public transport patronage to obtain demands during periods other than in the morning peak.
5.1 Demand for Private Transport
In the case of the network model, demand is calculated for a peak period (normally the morning peak hour) and an off-peak period. The TRENEN model requires demand in passenger kilometres per day and so the network model data was transferred into appropriate units for input the TRENEN model.
[image:5.612.118.534.44.209.2]5.2 Demand for Public Transport
[image:6.612.66.504.82.333.2]The demand for public transport in passenger kilometres was obtained by multiplying the mode trip matrices taken from the network model by the corresponding in-vehicle distance matrices. A summary of the demand data is presented in Table 3 in terms of trips per person which are the units used by the network model and passenger kilometres which are the units required by TRENEN.
Table 3. Mode Split for private and public transport demand
The differences between trip mode split and passenger kilometre mode split, as shown in Table 3, may be attributed to differences in trip length distribution between modes as private transport users tend to travel further on average than public transport users
6. TRENEN RESULTS FOR DUBLIN
Several scenarios were tested using the TRENEN model including the reference case, which represents conditions in 1991 and serves as the base line case, a full optimum
where all externalities are taxed and a case where the only change allowed is taxation
of private vehicles by means of a cordon toll. In the first instance, the car taxation case
is compared with the reference case and then a comparison is made with the application of a cordon toll in the network model using the externality costing output from TRENEN.
The taxes per passenger kilometre of travel, the average demand for each mode per
passenger, the speed of traffic and the welfare information for the reference case are summarised in Table 4. The tax referred to is the taxation on travel before the application of the taxation of externalities e.g. by means of a tax on fuel etc. At present there is no difference in taxation with respect to time of day or occupancy of vehicles. However, the generalised cost of travel does not remain the same for different times of the day as generalised cost includes an element of travel time and so congestion influences the cost of travel.
In the reference situation public transport is subsidised in the off-peak period with a tax applied in the peak period. This is due to the fact that depreciation on vehicles is
attributed to the peak period as it controls the size of the fleet of public transport
vehicles whereas in the off-peak period attributable costs are much lower. It is assumed
that in 1991 cars are not fitted with catalytic convertors and that super-efficient diesel cars are not available.
Total welfare is the sum of producer surplus, consumer surplus and tax revenue minus external pollution and accident costs (Ochelen and Proost, 1995). All welfare data are expressed in ECU per transport user per average day where there are 1.14 million transport users in Dublin. In the reference case, it is assumed that producer prices equal resource costs so that no profit is made and that the producer surplus is zero. The shadow price of public funds is fixed at 1.05. In the reference case the welfare level is calculated at 62.1 ECU per inhabitant per day.
The full optimum, as explained earlier, represents an ideal situation where a sophisticated pricing system is applied so that the marginal cost of each kilometre of travel is priced and charged depending on the time of day, the occupancy rate of the vehicle, the size of the car and the fuel type used. This system would be difficult to implement in practice but serves as a guide as to the maximum achievable with respect to welfare benefits. The full optimum constrains gasoline vehicles to be equipped with catalytic convertors.
The private vehicle taxation case study could be considered as a means of taxing the private vehicle user without affecting the public transport user. The results for the private vehicle taxation case are presented in Table 4 alongside the reference case results. Two scenarios are presented: a Regulation case where all vehicles have a catalytic convertor and No Regulation case where such a restriction is not imposed.
It can be seen from Table 4 that taxation of private vehicles in the peak period, in general, increases when comparing the private vehicle taxation cases with the reference case and as would be expected taxation is higher in the No Regulation case, as catalytic convertors are not imposed in this case and so the cost to the environment is higher. In the off-peak period, taxation is decreased in both cases when compared with the reference case. These results suggest that taxation in the reference year is too high for travel in the off-peak period and that it should be reduced.
As private vehicle taxation has increased, demand for this mode of travel decreases, as can be seen in Table 4, but demand for public transport increases. There is little difference in demand when comparing the Regulation case with the No Regulation case and the impact on speed of travel is also minimal.
Demand Speed Demand Speed Demand Speed
(pa.lan/per) (km/hr) (pa.km/per (km/hr) (pa.km/per (km/hr)
Table 4. TRENEN summary results for reference and car taxation cases.
Note: PCSSG = Peak Car Solo Small Gasoline PCSSD = Peak Car Solo Small Diesel PCSBG = Peak Car Solo Big Gasoline PCSBD = Peak Car Solo Big Diesel PCPSG = Peak Car Pool Small Gasoline OCSSG = Off-peak Car Solo Small Gasoline
To examine the impact on welfare a comparison is made with the full optimum case in Table 5. It can be seen from the table that the private vehicle taxation case with regulation i.e. all vehicles are assumed to have catalytic convertors, achieves 85% of the welfare gain achieved by the full optimum whereas the No Regulation case only achieves 23% that of the optimum. This displays the significance of clean car technology and the impact which it can make along with the taxation of private vehicle usage.
[image:8.612.66.526.56.650.2]Full Optimum 0.062 100
Car Tax with Regulation 0.053 85
Car Tax without Regulation 0.014 23
Table 5. Welfare gain compared with full optimum.
7. APPLICATION OF EXTERNALITY COSTING
Let us consider the case of applying a toll in the morning peak period. The first task was to change the output from TRENEN into a useable format for application to the network model. The total tax revenue generated in the reference case and for the private vehicle tax case study were calculated, using the output from TRENEN. The difference in tax revenue was said to be the amount which was required to be collected in tax for to cover externalities. From these calculations, the revenue to be collected in the peak period was found to be IR£48 960. The peak period in this case is defined as the combination of the morning peak hour and an evening peak hour and so the revenue to be collected in the morning peak hour was found by multiplying this revenue by the proportion of total peak period car kilometres travelled in the morning
peak hour to total travel in the combined peak period (morning and evening). Dividing this estimate by the total vehicle trips terminating inside the cordon in the reference case gives an estimate of the required toll to be imposed on each vehicle passing the cordon. The above calculations result in a toll per vehicle of IR£1.30. For this particular run of the SA TCHMO network model, a toll was applied to each vehicle passing the designated cordon and a summary of the resulting output in the units used by TRENEN is presented in Table 6.
Table 6. Travel demand in the morning peak hour for the cordon toll case study in passenger kilometres per person.
As can be seen from Table 6, public transport demand increases by 7. 9% in the case of a cordon toll compared with the reference case whereas private transport demand decreases by 2.2%. These changes in the SATCHMO model can be compared with the modal split as output from the TRENEN model for the same case study in Table 7.
Mode
TRENEN SATCII!\10 Modal Split 1\iodal Split(%)
(%)
Private -5.2 -2.2
Public +1.5 +7.9
[image:10.612.104.521.77.225.2]Total -3.6 + 1.1
Table 7. Comparison of modal split output from two models.
The larger decrease in demand for private transport in the case of TRENEN indicates that the TRENEN model approach is more sensitive to taxation of externalities than the network model. This can be explained by the strong influence of time on the generalised cost of travel in the case of the network model compared with the toll imposed. From examination of other case studies, not reported here, the TRENEN model in most cases does appear to be more sensitive. However, for this particular case study there is a large increase in demand for public transport in the case of the network model which perhaps reflects the fact that there a reasonably good public transport service to the city centre and so ease of transfer from private to public is more easily facilitated. This phenomenon cannot be simulated in the case of TRENEN as it uses an aggregate approach and so local issues are not taken into account which highlights the importance of combining its aggregate nature with that of a network model for application purposes.
8.
CONCLUSIONSThe TRENEN research has shown how it is possible to cast the problem of optimal pricing in the transport sector using a powerful, albeit idealised, welfare optimisation programme. The programme may be allowed to seek an ideal optimal tax and charges regime but it can also be used to investigate more realistic policies. The full optimal solution serves as a benchmark to estimate the losses inherent to a less perfect but more practical policy tool.
The interaction between an idealised model and a conventional network model for an urban area has also been illustrated in this research. This proved to be relatively straightforward. Moreover, we have not yet explored this interactions in full. One can envisage how the network model can be used to study the application of simpler policy
tools at a fairly detailed level on the ground. This, again, permits the estimation of welfare losses compared with the ideal policy or set of policies.
We believe there is considerable scope for using this hybrid approach in the future. It is then possible to use the idealised but powerful optimisation features in TRENEN to investigate policy instruments and their combination. Once a set of instruments of
interest is identified, a more disaggregate and conventional transport model can be used to explore the implementation of these tools in practice.
9. REFERENCES
Automobile Association Technical Services (1991). Motoring Costs - May 1991,
Automobile Association, Dublin.
Central Statistics Office (1989). Household Budget Survey 1987, Government of
Ireland, Dublin.
Dublin Bus Annual Repon (1993). Dublin Bus, Dublin.
Glaister, S., Lewis D., (1978). An Integrated Fares Policy for Transpon in London,
Journal of Public Economics, Vol 9, pp 341-355.
Goodwin, P (1992). A Review of New Demand Elasticities, Journal of Transport
Economics and Policy, May 1992, pp 155-169.
Kirwan', K., O'Mahony, M.M. and O'Sullivan, D. (1995). Speed-flow Relationships
for Use in an Urban Transport Policy Assessment Model, University Transport Studies
Group, Dublin.
Mayeres, I. (1993) The Private Car User Costs, Centre for Economic Studies,
University of Leuven.
Motor Insurance Advisory Board (1992). Sixth Annual Repon, Department of
Enterprise and Employment, Dublin.
Ochelen, S. and Proost, S. (1995). Model Documentation Prototype Version 1.3. EU
JOULE II Research Programme, Centre for Economic Studies, University of Leuven.
Recommended Car Price Lists, Society of the Irish Motor Industry (1991), Dublin.
Steer Davies Gleave (1994). Dublin Transportation Initiative Final Report,
Department of the Environment, Dublin.