Evaluating text coherence based on semantic similarity graph
Jan Wira Gotama Putra and Takenobu Tokunaga School of Computing
Tokyo Institute of Technology
Tokyo Meguro ˆOokayama 2-12-1 152-8550, Japan [email protected] [email protected]
Abstract
Coherence is a crucial feature of text be-cause it is indispensable for conveying its communication purpose and meaning to its readers. In this paper, we propose an unsupervised text coherence scoring based on graph construction in which edges are established between semantically similar sentences represented by vertices. The sentence similarity is calculated based on the cosine similarity of semantic vectors representing sentences. We provide three graph construction methods establishing an edge from a given vertex to a pre-ceding adjacent vertex, to a single simi-lar vertex, or to multiple simisimi-lar vertices. We evaluated our methods in the docu-ment discrimination task and the insertion task by comparing our proposed methods to the supervised (Entity Grid) and unsu-pervised (Entity Graph) baselines. In the document discrimination task, our method outperformed the unsupervised baseline but could not do the supervised baseline, while in the insertion task, our method out-performed both baselines.
1 Introduction
Coherence plays an important role in a text be-cause it enables a text to convey its communi-cation purpose and meaning to its readers ( Bam-berg,1983;Grosz and Sidner,1986). Coherence also decreases reading time as a more coherent text is easier to read with less reader’s cognitive load (Todirascu et al., 2016). While there is no single agreed definition of coherence, we can com-pile several definitions of coherence and note its important aspects.
First, a text is coherent if it can convey its communication purpose and meaning to its read-ers (Wolf and Gibson,2005;Somasundaran et al.,
2014; Feng et al., 2014). Second, a text needs to be integrated as a whole, rather than a series of independent sentences (Bamberg, 1983; Gar-ing,2014). It means that sentences in the text are centralised around a certain theme or topic, and are arranged in a particular order in terms of log-ical, spatial, and temporal relations. Third, every sentence in a coherent text has relation(s) to each other (Halliday and Hasan, 1976;Grosz and Sid-ner,1986;Mann and Thompson,1988;Wolf and Gibson,2005). It suggests that a text exhibits dis-course/rhetorical relation and cohesion. Fourth, text coherence is greatly influenced by the pres-ence of a certain organisation in the text ( Pers-ing et al.,2010;Somasundaran et al.,2014). The organisation helps readers to anticipate the up-coming textual information. Although a well-organised text is highly probable to be coherent, only the organisation does not constitute coher-ence. Textual organisation concerns the structural formation and logical development of a text, while lexical and semantic continuity is also indispens-able for coherent text (Feng et al., 2014). Fifth, it is easier to read a coherent text than its less coherent counterpart (Garing,2014). Thus when writing a text, it is not enough to only revise the text with careful editing and proofreading from the lexical, or grammatical aspect. Coherence aspect also should be taken into account in revising the text (Bamberg,1983;Garing,2014).
There are studies on computational modelling of text coherence based on the supervised learning approach, such as the Entity Grid model ( Barzi-lay and Lapata, 2008). The Entity Grid model has been further extended into the Role Matrix model (Lin et al.,2011;Feng et al.,2014). How-ever, these models have a few drawbacks. First,
department trial Microsoft evidence competitors markets products brands case Netscape software
S1 S O S X O − − − − − −
S2 − − O − − X S O − − −
[image:2.595.99.500.77.115.2]S3 − − S O − − − − S O O
Table 1: Entity Grid example
Entity Grid using co-reference resolution has a bias towards the original ordering of text when comparing a text with its permutated counterparts. The co-reference resolution module is trained on well-formed texts; thus it does not perform very well for ill-organised texts. The methods utilis-ing a discourse parser for modellutilis-ing text coher-ence (Lin et al.,2011;Feng et al.,2014) have the same problem. Second, the supervised model of-ten suffers from data sparsity, domain dependence, and computational cost for training. To allevi-ate these problems in the supervised model, Guin-audeau and Strube (2013) proposed an unsuper-vised coherence model known as the Entity Graph model.
The Entity Grid, Role Matrix, and Entity Graph model assumed coherence was achieved by lo-cal cohesion, i.e. repeated mentions of the same entities constitute cohesion. However, they did not capture the contribution of related-yet-not-identical entities (Petersen et al., 2015). To our best knowledge, the closest study addressing this problem was done by Li and Hovy (2014). The key idea of Li and Hovy (2014) is to learn a distributed sentence representation which captures the underlying semantic relations between consec-utive sentences. To tackle these limitations of the past research, we present an unsupervised text co-herence model that captures the contribution of related-yet-not-identical entities.
The rest of this paper is organised as follows. Section 2 describes related work; Section 3 intro-duces our proposed unsupervised method to mea-sure text coherence from a semantic similarity per-spective; Section 4 describes experimental results; then followed by the conclusion in Section 5.
2 Related work
This section provides an overview of existing co-herence scoring models, both supervised and un-supervised. Entity Grid is considered as a super-vised baseline in this paper. On the other hand, Entity Graph is selected as an unsupervised base-line.
S1[(The Justice Department)S is conducting an
(anti-trust trial)Oagainst (Microsoft Corp.)Xwith (evidence)X
that (the company)S is increasingly attempting to crush
(competitors)O.] S2[(Microsoft)O is accused of
try-ing to forcefully buy into (markets)X where (its own
products)S are not competitive enough to unseat
(es-tablished brands)O.] S3[(The case)S revolves around
(evidence)O of (Microsoft)S aggressively pressuring
(Netscape)Ointo merging (browser software)O.]
Figure 1: Part of an example text from (Barzilay and Lapata,2008)
2.1 Entity Grid
The Entity Grid model focused on the evaluation of local cohesion developed on top of the Cen-tering theory (Barzilay and Lapata, 2008). The key idea of the Centering theory is that the dis-tribution of entities in coherent texts exhibits cer-tain regularities (Grosz et al., 1995). The text is said to be less coherent if it exhibits many atten-tion shifts, i.e. frequent changes in attenatten-tion (cen-tre) (Grosz et al., 1995). However, if the centre of attention has smooth transitions, it will be more coherent, e.g. when sentences in a text mentioning the same entity. Barzilay and Lapata(2008) pro-posed a computational model by representing text as a matrix called Entity Grid in which the col-umn corresponds to entities, the row corresponds to sentences in the text, and the cell denotes the role of the entity in the sentence. The role of an entity is defined as one of S(subject), O(object), or X(neither). The cell is filled with “−” if the en-tity is not mentioned in the sentence. If the enen-tity serves multiple roles in the sentence, the priority order would be S, O, and then X. They consider co-referent noun phrases as an entity. As an ex-ample, the text in Figure1is transformed into the Entity Grid as in Table1. The bracketed words in Figure1are recognised as the entities in Table1.
department trial Microsoft evidence competitions markets producs brands case Netscape software
S1 S2 S3
3 2 3 1
2 2
1 3 2
3
[image:3.595.118.480.62.138.2]2 3 2 2
Figure 2: Example of bipartite graph
corresponding Table1is2/22. As the feature vec-tor for a text can be different with another text, the pattern of these feature vectors would reflect text coherence. Because the Entity Grid model is based on the Centering theory, it only captures the local relationship of text.Lin et al.(2011) and
Feng et al.(2014) tried to tackle this limitation by filling the cell in the grid with the discourse role of the sentence in which the entity appears.
2.2 Entity Graph
To tackle the disadvantages of the supervised co-herence model, Guinaudeau and Strube (2013) proposed a graph model to measure text coher-ence. Graph data structure allows us to relate non-adjacent sentences, spanning globally in the text to reflect global coherence as opposed to the lo-cal coherence of the Entity Grid model. A text is represented as a directed bipartite graph. The first partition is a sentence partition in which each ver-tex represents a sentence. The second partition is a discourse partition in which each vertex repre-sents an entity. The weighted edge between a sen-tence vertex and an entity vertex is established if the entity is mentioned in the sentence. A weight is assigned to each edge based on entity’s role in the sentence: 3 for a subject entity, 2 for an object entity, and 1 for others. Figure2shows an exam-ple of the bipartite graph transformation from the text in Figure1.
This directed bipartite graph is further trans-formed into a directed projection graph in which a vertex represents a sentence, and a directed weighted edge is established between vertices if they share same entities. The direction of the edge corresponds to the surface sequential order of the sentences within the text. For example, a ver-tex which represents the second sentence can only have outgoing edges to third, fourth, but not to the first sentence. There are three projection methods,
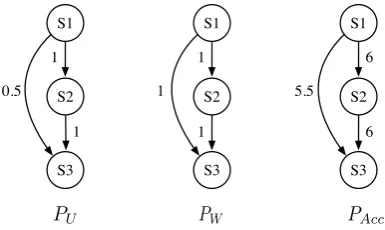
PU, PW, and PAcc depending on the weighting scheme of edges. PU assigns a binary weight to
S1
S2
S3 1
1 0.5
S1
S2
S3 1
1 1
S1
S2
S3 6
6 5.5
PU PW PAcc
Figure 3: Example of projection graphs
each edge: one for the edge connecting two sen-tences sharing at least one entity in common and zero for others. PW assigns the number of shared
entities between connected sentences to each edge as its weight. PAcccalculates an edge weight by accumulating the products of the weights of edges sharing an entity in the bipartite graph over the shared entities by the connected two sentences. The weight of the edge established between sen-tencesiandsjis calculated by
Wij = X
e∈Eij
bw(e, si)·bw(e, sj), (1)
where Eij is the set of entities shared by si and sj and bw(e, s) is a weight of the edge between entityeand sentencesin the bipartite graph. Fur-thermore, the edge weight in the projection graph can be normalised with dividing by the distance between the sentences, i.e.|j−i|.
[image:3.595.321.514.186.301.2]3 Constructing semantic similarity graphs
As mentioned in Section 1, a text is coherent if it can convey its communication purpose to read-ers, integrated as a whole, cohesive, well organ-ised, and easy to read. We would like to approach coherence from the cohesion perspective. We ar-gue that coherence of a text is built by cohesion among its sentences. We call our method as Se-mantic Similarity Graph.
Our proposed method employs an unsupervised learning approach. The unsupervised approach suffers less from data sparsity, domain depen-dence, and computational cost for training which often arise in the supervised approach. We encode a text into a graph G(V, E), where V is a set of vertices andEis a set of edges in the graph. The vertexvi ∈V represents thei-th sentencesiin the
text, and the weighted directed edgeei,j ∈E rep-resents a semantic relation from thei-th to thej-th sentences. In what follows, the term “edge” refers to the weighted directed edge.
As stated by Halliday and Hasan (1976), co-hesion is a matter of lexicosemantics. Our method projects a sentence into a vector repre-sentation using pre-trained GloVe word vectors1
by Pennington et al. (2014). A sentence con-sists of multiple words{w1, w2,· · ·, wM}where
each of them is mapped into a vector space, i.e.
{w~1, ~w2,· · · , ~wM}. A sentencescan be encoded
as a vector~s by taking the average of consisting word vectors. Formally, a sentence vector~sis de-scribed as
~s= M1 XM
k=1
~
wk,
whereM denotes the number of words in the sen-tence.
We propose three methods for constructing a graph from a text based on semantic similarity be-tween sentence pairs in the text. Given a certain sentence vertex in the graph, how to decide its counterpart vertices for establishing edges is the crucial point. The following subsections describe each method to decide a counterpart vertex. 3.1 Preceding adjacent vertex (PAV)
People read a text from the beginning to the end and understand a particular part of the text based 1We use word vectors trained on Wikipedia 2014 + Giga-word 5, 6B tokens 400K vocab, uncased, 100d. The resource is available at https://nlp.stanford.edu/projects/glove/
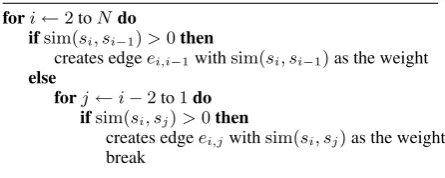
fori←2toNdo
ifsim(si, si−1)>0then
creates edgeei,i−1withsim(si, si−1)as the weight else
forj←i−2to1do ifsim(si, sj)>0then
[image:4.595.306.529.68.157.2]creates edgeei,jwithsim(si, sj)as the weight break
Figure 4: Graph construction algorithm with sim-ilarity of PAV
on information provided in the preceding part. When they do not understand a particular part, people look backwards for what they have missed. We mimic this reading process into graph con-struction that is reflected in the algorithm in Fig-ure4, whereN is the number of sentences in the text to be processed.
First we define a similarity measuresim(si, sj)
of a pair of sentencessiandsj as
sim(si, sj) =αuot(si, sj) + (1−α) cos(~si,~sj),
where uot is the number of unique overlapping terms between the sentencessi andsj divided by the number of unique terms in the two sentences; cos(~si,~sj) is a cosine similarity of the sentence
vectors;αis a balancing factor ranging over [0,1]. The algorithm constructs a graph by establish-ing a weighted directed edge from each sentence vertex to the preceding adjacent sentence vertex (PAV) if the sim value between the current and the preceding adjacent vertices exceeds zero; other-wise, the algorithm tries to establish an edge to the next closest preceding vertex with non-zero sim value. The established edge is assigned the sim value as its weight.
3.2 Single similar vertex (SSV)
Cohesion between two sentencessi andsj means that we need to knowsi in order to understandsj
or vice versa (Halliday and Hasan,1976). In this sense, we interpret cohesion as a semantic depen-dency among sentences. We simulate the semantic dependency with the semantic similarity between sentences. Since the dependency could happen in both direction, we allow edges to the following vertices as well as preceding vertices.
S1 I S2 S3
PAV
SSV
MSV
0.92 0.88 0.81
S1 I S2 S3
0.92 0.88 0.81
0.92
S1 I S2 S3
0.92 0.88 0.81
0.92 0.88 0.88
0.44
[image:5.595.73.287.62.207.2]0.44
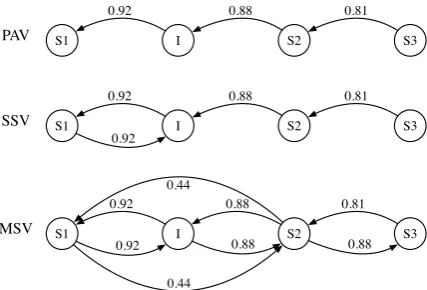
Figure 5: Example of semantic similarity graphs
method discards these constraints and establishes edges based on only the semantic similarity be-tween sentences. However, the edges are still di-rected and weighted. Also, only a single outgoing edge is allowed from every vertex in the graph.
We cast semantic dependency task into an infor-mation retrieval task. When establishing an edge from a certain sentence vertex, we search for the most similar sentence in the text. The similarity measure between two sentences si andsj is cal-culated based on the cosine similarity of their se-mantic vectors. An edge is established from the sentence vertex in question to the most similar sen-tence vertex with the weight calculated by
weight(ei,j) = cos(|i~−si,~j|sj). (2)
This weight calculation takes into account the dis-tance between two sentences, i.e. we prefer a closer counterpart.
3.3 Multiple similar vertex (MSV)
In the previous method, we allowed only a sin-gle outgoing edge for every sentence vertex in the graph. Here we discard the singular condition and allow multiple outgoing edges for every vertex. Instead of choosing the most similar sentence in the text, we choose multiple sentences that exceed a certain threshold (θ) in terms of cosine similar-ity with the sentence in question. Edges are es-tablished for all vertex pairs with the edge weight given in Equation (2).
Figure5shows an example of semantic similar-ity graphs constructed by three proposed methods for the text shown in Figure 6. The parameters for the PAV and MSV-based methods are the opti-mal value in the evaluation experiment that is
de-scribed in the next section, and the insertion sen-tence (I) was placed in the correct position (B). 3.4 Text coherence measure
From a constructed graph by one of the three methods explained in the preceding subsections, text coherence measuretcis calculated by averag-ing averaged weight of outgoaverag-ing edges from every vertex in the graph as
tc= N1
N
X
i=1
1
Li Li
X
k=1
weight(eik),
whereN is the number of sentences in the text and
Liis the number of outgoing edges from the vertex
vi. Li is always one for the PAV and SSV based
graph construction, since we allow only a single outgoing edge from every vertex in the graph in these methods. A largertc value denotes a more coherent text.
The proposed models have two significant dif-ferences from the Entity Graph model, our direct competitor. First, the Entity Graph model only allows establishing outgoing edges in the follow-ing direction, i.e. from the vertex vi to the ver-texvj, where i < j. On the other hand, the
pro-posed models except for the PAV based graph con-struction allow edges in both directions. Second, the Entity Graph model only measures coherence based on shared entities between sentences with respect to their syntactic role. This is also the case for the Entity Grid model. The proposed models measure text coherence based on the similarity be-tween semantic vectors of sentences; hence we can take into account related-yet-not-identical entities. 4 Evaluation and results
We evaluate the proposed methods on two exper-imental tasks: the document discrimination task and insertion task. All stop words are removed from the texts in this experiment, while lemmati-sation is not employed.
The performance of the proposed methods is also compared with our reimplementation of En-tity Grid (Barzilay and Lapata, 2008) and Entity Graph (Guinaudeau and Strube, 2013). The ex-perimental settings for each method are described below.
PAV The balancing factor α ranges over [0.0,0.1,0.2,· · ·,1.0].
MSV The cosine similarity threshold θ ranges over[−1.0,0.1,0.2,· · · ,0.9].
Entity Grid The optimal value for transition length three (bigram and trigram) is used. In document discrimination task, we imple-ment the Entity Grid model with and with-out saliency. An entity is judged as salient if it is mentioned in the text at least twice. Saliency is not employed in the insertion task because the texts in the insertion task are rel-atively short and an entity is not mentioned many times.
Entity GraphWe implemented three projection methods with normalisation: PU, PW, and PAcc.
Co-reference resolution is not employed to avoid bias as mentioned byNahnsen(2009). How-ever, we follow the suggestion byEisner and Char-niak(2011) to consider all nouns (including non-head nouns) as entities in our experiment. The role of each entity is extracted using the depen-dency parser in Stanford CoreNLP toolkit ( Man-ning et al.,2014).
4.1 Document discrimination task 4.1.1 Data
In the document discrimination task, sentences in a text are randomly permutated to generate another text; the task is to identify the original text given a pair of the original and the randomised one. The result is considered successful if the original is identified with the strictly higher coherence value. The performance is measured by accuracy, i.e. the ratio of successfully identified pairs to all pairs in the test set.
Our data came from a part of the English WSJ text in OntoNotes Release 5.0 (LDC2013T19). Half of the data is used for training while an-other half is used for testing. For each instance in both training and testing data, at most 20 ran-dom permutations were created. Detail of the data is shown in Table2.
4.1.2 Result and discussion
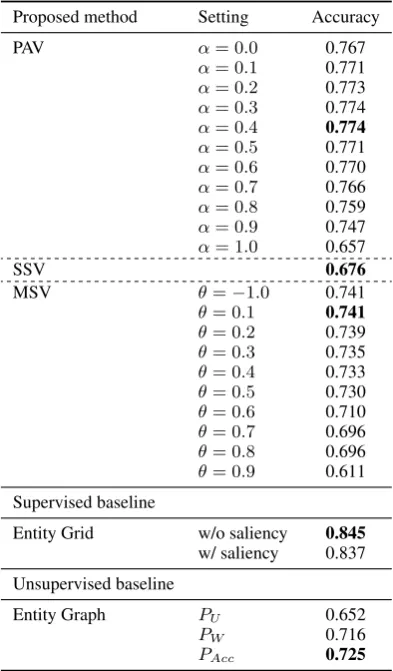
Table3shows the result of the document discrimi-nation task of each method with the various exper-imental settings.
Entity Grid without saliency performed the best (0.845), followed by Entity Grid with saliency (0.837), PAV (0.774, α = 0.4), MSV (0.741,
[image:6.595.321.511.64.105.2]# text # sent. # token # perm. training 686 23.7 510.9 13,660 testing 683 24.4 521.4 13,586
Table 2: Data for the document discrimination task (The columns “# sent.” and “# token” denote the average number of sentences and tokens in a text respectively.)
Proposed method Setting Accuracy
PAV α= 0.0 0.767
α= 0.1 0.771
α= 0.2 0.773
α= 0.3 0.774
α= 0.4 0.774
α= 0.5 0.771
α= 0.6 0.770
α= 0.7 0.766
α= 0.8 0.759
α= 0.9 0.747
α= 1.0 0.657
SSV 0.676
MSV θ=−1.0 0.741
θ= 0.1 0.741
θ= 0.2 0.739
θ= 0.3 0.735
θ= 0.4 0.733
θ= 0.5 0.730
θ= 0.6 0.710
θ= 0.7 0.696
θ= 0.8 0.696
θ= 0.9 0.611 Supervised baseline
Entity Grid w/o saliency 0.845 w/ saliency 0.837 Unsupervised baseline
Entity Graph PU 0.652
PW 0.716
PAcc 0.725
Table 3: Result of the document discrimination task
θ= 0.1), Entity Graph (0.725), then SSV (0.676). The performances of PAV and MSV are increas-ing over changes of parameter until at certain point becomes steadily decreasing. We performed the McNemar test in R to find out that the difference in accuracy between every pair of methods is sta-tistically significant at p < 0.05. Contrary to
[image:6.595.318.515.169.505.2]SSV MSV E-Grid E-Graph PAV 10,049 11,998 10,109 10,626
SSV − 10,153 9,052 9,507
MSV − − 9,483 10,246
E-Grid − − − 10,189
E-Graph − − − −
Table 4: Number of the same judgements between two methods in the document discrimination task
the semantic relation between adjacent sentences (local coherence) is more important for coherence than semantic relation between long-distance sen-tences in the document discrimination task.
We also calculated the number of the same judgement between all pairs of methods (questions that are answered correctly and incorrectly by both methods in the pair). Table 4 shows the number of the same judgement between every pair of the methods. We found out the PAV–MSV pair shares the largest number of the same judgement (11,998, 88.3%). The MSV-based method establishes an edge between sentences whenever their similarity exceeds the threshold. However, it has relatively many same judgements with PAV. This implies the local coherence is sufficient enough to solve the document discrimination task.
4.2 Insertion task 4.2.1 Data
In the insertion task described inBarzilay and La-pata (2008), the coherence measure is evaluated based on to what extent the measure can estimate the original sentence position in a text from which one sentence is taken out randomly. The coher-ence measure of the text with a taken-out sentcoher-ence inserted at the original position, i.e. the original text, is expected to be the highest value among other values of text with the sentence inserted at a wrong position.
We argue, however, adopting the TOEFLR iBT insertion type question is more suitable for this kind of task than using the artificially generated texts by sentence deletion. The TOEFLR insertion type question aims at measuring test takers’ abil-ity to understand the text coherence. Test takers are given a coherent text with aninsert-sentence. The task is to find the best place to insert the insert-sentence. To the best of our observation, the texts in the TOEFLR iBT insertion type question are coherent even before theinsert-sentenceis in-serted. An example of the TOEFLR iBT insertion
(A)S1[The raising of livestock is a major economic
ac-tivity in semiarid lands, where grasses are generally the dominant type of natural vegetation.] (B)S2[The
conse-quences of an excessive number of livestock grazing in an area are the reduction of the vegetation cover and tram-pling and pulverization of the soil.] (C)S3[This is usually
followed by the drying of the soil and accelerated erosion.] (D)
Question:
Insert the following sentence into one of (A)-(D).
I[This economic reliance on livestock in certain regions
makes large tracts of land susceptible to overgrazing.]
Figure 6: Example of the TOEFLR iBT insertion type question (Education Testing Service,2007)
type question is shown in Figure6.
In the following evaluation, a method is judged as a success if it assigns the highest coherence value to the text formed by inserting the insert-sentence at the correct insertion position. We do not allow tie values and judge it as fail even though the correct position has the highest tie value.
We collected 104 insertion type questions from various TOEFLR iBT preparation books. The av-erage number of sentences in a text is 7.05 (SD: standard deviation=1.85); the average number of tokens in a text is 139.8 (SD=43.7). As the data size is relatively small, we adopted the one-held-out cross validation for the Entity Grid model. The same rank is assigned to incorrect insertion posi-tions when training the Entity Grid model. We did not adopt the Entity Grid model considering saliency since each text is relatively short in this data thus term frequency (saliency) tends to be low for all terms.
4.2.2 Result and discussion
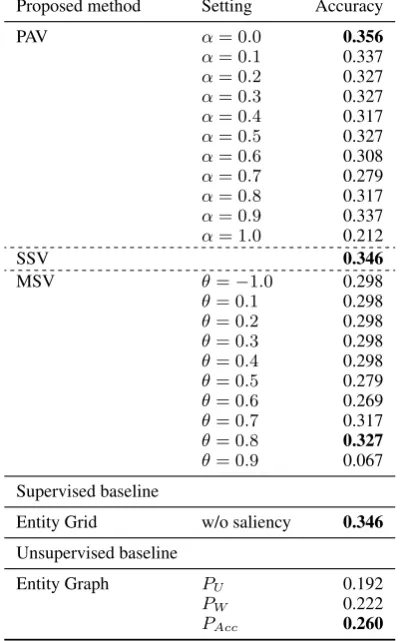
Table 5 shows the result of the insertion task of each method with the various experimental set-tings. Our proposed methods showed good perfor-mance, particularly the PAV-based graph construc-tion method outperformed both baselines: Entity Grid and Entity Graph. The PAV method obtained the best performance at α = 0.0, while MSV method performed best atθ = 0.8. However, the McNemar test revealed that the difference in ac-curacy between every pair of methods was not sta-tistically significant atp <0.05. This is probably due to the limited size of the insertion data com-pared with the document discrimination task.
Proposed method Setting Accuracy
PAV α= 0.0 0.356
α= 0.1 0.337
α= 0.2 0.327
α= 0.3 0.327
α= 0.4 0.317
α= 0.5 0.327
α= 0.6 0.308
α= 0.7 0.279
α= 0.8 0.317
α= 0.9 0.337
α= 1.0 0.212
SSV 0.346
MSV θ=−1.0 0.298
θ= 0.1 0.298
θ= 0.2 0.298
θ= 0.3 0.298
θ= 0.4 0.298
θ= 0.5 0.279
θ= 0.6 0.269
θ= 0.7 0.317
θ= 0.8 0.327
θ= 0.9 0.067 Supervised baseline
Entity Grid w/o saliency 0.346 Unsupervised baseline
Entity Graph PU 0.192
PW 0.222
[image:8.595.81.282.68.389.2]PAcc 0.260
Table 5: Result of the insertion task
similar characteristics, having word overlaps and synonyms across adjacent sentences. These ques-tions also tend to contain more common words. On the other hand, the failed questions tend to contain more uncommon words, technical terms and named entities. Although the successful ques-tions also contain named entities, they were men-tioned more frequently in the texts as opposed to the failed questions. Therefore we suspected the limited coverage of our GloVe dictionary and in-vestigated the proportion of the out of vocabulary (OOV) ratio of the texts. Among all of the ques-tions, there are 32 out of 104 questions includ-ing the OOV words; each question contains one to three OOV words in type/in token. All meth-ods failed in 15 out of these 32 questions but suc-ceeded in the rest 17. This fact suggests that OOV words are not necessarily the main reason for fail-ures in the insertion task.
Comparing the parameters (α of PAV andθ of MSV) in Table 3 and Table5, they are different to achieve the best performance in two different datasets. In the PAV-based method, there is no significant difference in the average uotvalue of
every pair of adjacent two sentences between the datasets. We also calculated the cosine similar-ity of every pair of adjacent two sentences to find more similar adjacent sentences in the insertion task data than in the document discrimination task data; 90% of the adjacent sentence similarities lies in0.3∼ 0.6in the document discrimination task, while it ranges 0.5 ∼ 0.9 in the insertion task data. This difference suggests that theuotfactor helps relatively more in the document discrimina-tion task for the PAV-based method, while it has less impact in the insertion task. This explains the differenceαvalues of PAV across the two tasks.
To investigate the difference of the parameterθ
in the MSV-based model, we calculated the co-sine similarity of every sentence pair in the text. In both datasets, more than 90% of the sentence similarities lies in 0.5 ∼ 1.0. When the simi-larity is transformed into the edge weight by di-viding by the sentence distance, the difference be-comes apparent; while 86.6% of the edge weights in the document discrimination task lies less than 0.2, the edge weights scatter over0 ∼ 1.0in the insertion task. This happens because the average length of the texts in the document discrimination task is longer than that of the insertion task. Un-less setting a low threshold (θ), the MSV-based model hardly establishes edges between sentence vertices. In other words, establishing edges be-tween distant sentences would contribute to the performance of these tasks.
SSV MSV E-Grid E-Graph
PAV 75 79 57 66
SSV − 84 58 67
MSV − − 54 65
E-Grid − − − 69
[image:8.595.322.510.498.570.2]E-Graph − − − −
Table 6: Number of the same answers between two methods in the insertion task
[image:8.595.323.508.499.570.2]shows the PAV-based method answered differently from the SSV-based method in almost 30% ques-tions. To further investigate the difference, we fo-cused on the questions that were answered inrectly by the PAV-based method but answered cor-rectly by the SSV-based method. There are 14 of such questions, in which the SSV-based method tends to establish edges between distant sentences; the average distance between sentence vertices is 2.8 (SD = 0.7). This suggests that the SSV-based method could capture distant sentence re-lations contributing to text coherence more appro-priately than the PAV-based method.
We also investigated 11 questions that were an-swered incorrectly by the PAV-based method but answered correctly by the MSV-based method. In these questions, the MSV-based method tends to establish more edges than the PAV-based method. The average number of outgoing edges from a sen-tence vertex in the graph constructed by the MSV-based method is 2.5(SD= 1.8). In addition, the MSV-based method tends to establish edges be-tween distant sentences as well as the SSV-based method; the average distance between sentence vertices is 2.6 (SD = 0.9). This suggests that the MSV-based method also could capture many distant sentence relations contributing to text co-herence more appropriately than the PAV-based method.
Although the PAV-based method performs best with the present data, which considers only local cohesion between adjacent sentences, we need to introduce a more refined mechanism for incorpo-rating distant sentence relations than the current SSV and MSV-based methods, as we showed that long-distance relations could contribute in deter-mining text coherence. The representation of tences and calculation of similarity between sen-tences would be direct targets of the refinement.
5 Conclusion
This paper presented three novel unsupervised text coherence scoring methods, in which text coher-ence is regarded to be realised by cohesion of sen-tences in the text and the cohesion is represented in a graph structure corresponding to the text. In the graph structure, a vertex corresponds to a sen-tence in the text, and an edge represents a semantic relationship between corresponding sentences. As cohesion is a matter of lexicosemantics, sentences are transformed into semantic vector
representa-tions, and their similarity is calculated based on the cosine similarity between the vectors. Edges between sentence vertices are established based on the similarity and distance between the sentences. We presented three methods to construct a graph: the PAV, SSV, and MSV-based methods.
We evaluated the proposed methods in the doc-ument discrimination task and the insertion task. Our best performing method (PAV) outperformed the unsupervised baseline (Entity Graph) but not the supervised baseline (Entity Grid) in the docu-ment discrimination task. The difference was sta-tistically significant at p < 0.05. In the inser-tion task, our best performing method (PAV) out-performed both supervised and unsupervised base-lines, but the difference is not statistically signifi-cant atp <0.05. We argue that further experiment is necessary with a larger size of data in the inser-tion task.
Our experimental result showed that our best proposed method (PAV) performed 0.774 in accu-racy in the document discrimination task, but only performed 0.356 in the insertion task. There is a big gap in their performance between two tasks. The error analysis revealed a possibility to im-prove the performance by introducing a more re-fined representation of sentence vectors and calcu-lation in semantic the similarity between sentences for capturing distant relations between sentences.
References
Betty Bamberg. 1983. What makes a text coher-ent. College Composition and Communication
34(4):417–429.
Regina Barzilay and Mirela Lapata. 2008. Modeling local coherence: Entity based approach. Computa-tional Linguistics34(1):1–34.
Education Testing Service. 2007.The Official Guide to the New TOEFLR iBT International Edition.
Mc-Graw Hill, Singapore.
Micha Eisner and Eugene Charniak. 2011. Extending the entity grid with entity-specific features. In
Proceedings of the 49th Annual Meeting of the Association for Computational Linguistics: Human Language Technologies: Short Papers - Volume 2. Association for Computational Linguistics, Stroudsburg, PA, USA, HLT ’11, pages 125–129.
http://dl.acm.org/citation.cfm?id=2002736.2002764. Vanessa Wei Feng, Ziheng Lin, and Graeme Hirst.
2014. The impact of deep hierarchical dis-course structures in the evaluation of text
the 25th International Conference on Compu-tational Linguistics: Technical Papers. Dublin City University and Association for Computa-tional Linguistics, Dublin, Ireland, pages 940–949.
http://www.aclweb.org/anthology/C14-1089. Alphie G. Garing. 2014. Coherence in argumentative
essays of first year college of liberal arts students at de la salle university. DLSU Research Congress. Barbara J. Grosz and Candace L. Sidner. 1986.
Attention, intentions, and the structure of dis-course. Computational Linguistics 12(3):175–204.
http://dl.acm.org/citation.cfm?id=12457.12458. Barbara J. Grosz, Scott Weinstein, and Aravind K.
Joshi. 1995. Centering: A framework for modeling the local coherence of discourse.
Computational Linguistics 21(2):203–225.
http://dl.acm.org/citation.cfm?id=211190.211198. Camille Guinaudeau and Michael Strube. 2013.
Graph-based local coherence modeling. In Pro-ceedings of the 51st Annual Meeting of the Association for Computational Linguistics (Vol-ume 1: Long Papers). Association for Computa-tional Linguistics, Sofia, Bulgaria, pages 93–103.
http://www.aclweb.org/anthology/P13-1010. M.A.K Halliday and Ruqaiya Hasan. 1976. Cohesion
in English. Longman, Singapore.
Jiwei Li and Eduard Hovy. 2014. A model of coherence based on distributed sentence repre-sentation. In Proceedings of the 2014 Confer-ence on Empirical Methods in Natural Language Processing (EMNLP). Association for Computa-tional Linguistics, Doha, Qatar, pages 2039–2048.
http://www.aclweb.org/anthology/D14-1218. Ziheng Lin, Hwee Tou Ng, and Min-Yen Kan.
2011. Automatically evaluating text coherence us-ing discourse relations. In Proceedings of the 49th Annual Meeting of the Association for Com-putational Linguistics: Human Language Tech-nologies. Association for Computational Linguis-tics, Portland, Oregon, USA, pages 997–1006.
http://www.aclweb.org/anthology/P11-1100. William C. Mann and Sandra A. Thompson. 1988.
Rhetorical structure theory: Toward a functional the-ory of text organization. Text8(3):243–281. Christopher Manning, Mihai Surdeanu, John Bauer,
Jenny Finkel, Steven Bethard, and David Mc-Closky. 2014. The stanford corenlp natu-ral language processing toolkit. In Proceed-ings of 52nd Annual Meeting of the Asso-ciation for Computational Linguistics: System Demonstrations. Association for Computational Linguistics, Baltimore, Maryland, pages 55–60.
http://www.aclweb.org/anthology/P14-5010. Thade Nahnsen. 2009. Domain-independent
shal-low sentence ordering. In Proceedings of Hu-man Language Technologies: The 2009 Annual
Conference of the North American Chapter of the Association for Computational Linguistics, Com-panion Volume: Student Research Workshop and Doctoral Consortium. Association for Computa-tional Linguistics, Boulder, Colorado, pages 78– 83. http://www.aclweb.org/anthology/N/N09/N09-3014.
Jeffrey Pennington, Richard Socher, and Christopher Manning. 2014. Glove: Global vectors for word representation. In Proceedings of the 2014 Con-ference on Empirical Methods in Natural Language Processing (EMNLP). Association for Computa-tional Linguistics, Doha, Qatar, pages 1532–1543.
http://www.aclweb.org/anthology/D14-1162. Isaac Persing, Alan Davis, and Vincent Ng.
2010. Modeling organization in student es-says. In Proceedings of the 2010 Conference on Empirical Methods in Natural Language Processing. Association for Computational Linguistics, Cambridge, MA, pages 229–239.
http://www.aclweb.org/anthology/D10-1023. Casper Petersen, Christina Lioma, Jakob Grue
Si-monsen, and Birger Larsen. 2015. Entropy and graph based modelling of document coherence us-ing discourse entities: An application to ir. In
Proceedings of the 2015 International Conference on The Theory of Information Retrieval. ACM, New York, NY, USA, ICTIR ’15, pages 191–200.
https://doi.org/10.1145/2808194.2809458.
Swapna Somasundaran, Jill Burstein, and Martin Chodorow. 2014. Lexical chaining for mea-suring discourse coherence quality in test-taker
essays. In Proceedings of COLING 2014,
the 25th International Conference on Compu-tational Linguistics: Technical Papers. Dublin City University and Association for Computa-tional Linguistics, Dublin, Ireland, pages 950–961.
http://www.aclweb.org/anthology/C14-1090. Amalia Todirascu, Thomas Francois, Delphine
Bern-hard, Nuria Gala, and Anne-Laure Ligozat. 2016.
Are cohesive features relevant for text readability evaluation? In Proceedings of COLING 2016, the 26th International Conference on Computational Linguistics: Technical Papers. The COLING 2016 Organizing Committee, Osaka, Japan, pages 987– 997. http://aclweb.org/anthology/C16-1094. Florian Wolf and Edward Gibson. 2005.
Rep-resenting discourse coherence: A corpus-based study. Computational Linguistics 31(2):249–288.