SemEval-2017 Task 4: Sentiment Analysis in Twitter
Sara Rosenthal♣, Noura Farra♦, Preslav Nakov♥
♥Qatar Computing Research Institute, Hamad bin Khalifa University, Qatar ♦Department of Computer Science, Columbia University
♣IBM Research, USA
Abstract
This paper describes the fifth year of the Sentiment Analysis in Twitter task. SemEval-2017 Task 4 continues with a rerun of the subtasks of SemEval-2016 Task 4, which include identifying the over-all sentiment of the tweet, sentiment to-wards a topicwith classification on a two-point and on a five-two-point ordinal scale, and
quantification of the distribution of sen-timent towards a topic across a number of tweets: again on a two-point and on a five-point ordinal scale. Compared to 2016, we made two changes: (i) we in-troduced a new language, Arabic, for all subtasks, and (ii) we made available in-formation from the profiles of the Twitter users who posted the target tweets. The task continues to be very popular, with a total of 48 teams participating this year.
1 Introduction
The identification of sentiment in text is an im-portant field of study, with social media plat-forms such as Twitter garnering the interest of re-searchers in language processing as well as in po-litical and social sciences. The task usually in-volves detecting whether a piece of text expresses a POSITIVE, a NEGATIVE, or a NEUTRAL senti-ment; the sentiment can be general or about a spe-cific topic, e.g., a person, a product, or an event.
TheSentiment Analysis in Twittertask has been run yearly at SemEval since 2013 (Nakov et al.,
2013;Rosenthal et al.,2014;Nakov et al.,2016b), with the 2015 task introducing sentiment towards a topic (Rosenthal et al.,2015) and the 2016 task introducing tweet quantification and five-point or-dinal classification (Nakov et al.,2016a).
SemEval is the International Workshop on Seman-tic Evaluation, formerly SensEval. It is an on-going series of evaluations of computational se-mantic analysis systems, organized under the um-brella of SIGLEX, the Special Interest Group on the Lexicon of the Association for Computational Linguistics. Other related tasks at SemEval have explored sentiment analysis of product review and their aspects (Pontiki et al., 2014, 2015, 2016), sentiment analysis of figurative language on Twit-ter (Ghosh et al., 2015), implicit event polarity (Russo et al., 2015), detecting stance in tweets (Mohammad et al., 2016a), out-of-context senti-ment intensity of words and phrases (Kiritchenko et al., 2016), and emotion detection (Strapparava
and Mihalcea, 2007). Some of these tasks
fea-tured languages other than English, such as Arabic (Pontiki et al., 2016; Mohammad et al., 2016a); however, they did not target tweets, nor did they focus on sentiment towards a topic.
This year, we performed a re-run of the subtasks in SemEval-2016 Task 4, which, in addition to the overall sentiment of a tweet, featured classifica-tion, ordinal regression, and quantification with respect to a topic. Furthermore, we introduced a new language, Arabic. Finally, we made avail-able to the participants demographic information about the users who posted the tweets, which we extracted from the respective public profiles.
Ordinal Classification As last year, SemEval-2017 Task 4 includes sentiment analysis on a five-point scale{HIGHLYPOSITIVE, POSITIVE, NEU -TRAL, NEGATIVE, HIGHLYNEGATIVE}, which is in line with product ratings occurring in the corpo-rate world, e.g., Amazon, TripAdvisor, and Yelp. In machine learning terms, moving from a categor-ical two-point scale to an ordered five-point scale means moving from binary toordinal classifica-tion(akaordinal regression).
Tweet Quantification SemEval-2017 Task 4 in-cludestweet quantificationtasks along with tweet classification tasks, also on 2-point and 5-point scales. While the tweet classification task is con-cerned with whether a specific tweet expresses a given sentiment towards a topic, the tweet quan-tification task looks at estimating the distribu-tion of tweets about a given topic across the different sentiment classes. Most (if not all) tweet sentiment classification studies within polit-ical science (Borge-Holthoefer et al., 2015;Kaya
et al., 2013; Marchetti-Bowick and Chambers,
2012), economics (Bollen et al.,2011;O’Connor et al., 2010), social science (Dodds et al., 2011), and market research (Burton and Soboleva,2011;
Qureshi et al.,2013), study Twitter with an inter-est in aggregate statistics about sentiment and are
not interested in the sentiment expressed in indi-vidual tweets. We should also note that quantifica-tion is not a mere byproduct of classificaquantifica-tion, as it can be addressed using different approaches and it also needs different evaluation measures (Forman,
2008;Esuli and Sebastiani,2015).
Analysis in Arabic This year, we added a new language, Arabic, in order to encourage partici-pants to experiment with multilingual and cross-lingual approaches for sentiment analysis. Our ob-jective was to expand the Twitter sentiment anal-ysis resources available to the research commu-nity, not only for general multilingual sentiment analysis, but also for multilingual sentiment anal-ysis towards a topic, which is still a largely un-explored research direction for many languages and in particular for morphologically complex lan-guages such as Arabic.
Arabic has become an emergent language for sentiment analysis, especially as more resources and tools for it have recently become available. It is also both interesting and challenging due to its rich morphology and abundance of dialectal use in Twitter. Early Arabic studies focused on sentiment analysis in newswire (Abdul-Mageed and Diab,
2011; Elarnaoty et al., 2012), but recently there has been a lot more work on social media, espe-cially Twitter (Mourad and Darwish,2013; Abdul-Mageed et al., 2014; Refaee and Rieser, 2014;
Salameh et al.,2015), where the challenges of sen-timent analysis are compounded by the presence of multiple dialects and orthographical variants, which are frequently used in conjunction with the formal written language.
Some work studied the utility of machine trans-lation for sentiment analysis of Arabic texts (Salameh et al., 2015; Mohammad et al., 2016b;
Refaee and Rieser, 2015), identification of senti-ment holders (Elarnaoty et al., 2012), and senti-ment targets (Al-Smadi et al., 2015;Farra et al.,
2015; Farra and McKeown, 2017). We believe
that the development of a standard Arabic Twit-ter dataset for sentiment, and particularly with re-spect to topics, will encourage further research in this regard.
User Information Demographic information in Twitter has been studied and analyzed using net-work analysis and natural language processing (NLP) techniques (Mislove et al.,2011;Nguyen et al.,2013;Rosenthal and McKeown,2016). Re-cent work has shown that user information and in-formation from the network can help sentiment analysis in other corpora (Hovy, 2015) and in Twitter (Volkova et al.,2013;Yang and Eisenstein,
2015). Thus, this year we encouraged participants to use information from the public profiles of Twit-ter users such as demographics (e.g., age, location) as well as information from the rest of the social network (e.g., sentiment of the tweets of friends), with the goal of analyzing the impact of this infor-mation on improving sentiment analysis.
The rest of this paper is organized as follows. Section2presents in more detail the five subtasks of SemEval-2017 Task 4. Section3describes the English and the Arabic datasets and how we cre-ated them. Section4introduces and motivates the evaluation measures for each subtask. Section 5
presents the results of the evaluation and discusses the techniques and the tools that the participants used. Finally, Section6 concludes and points to some possible directions for future work.
2 Task Definition
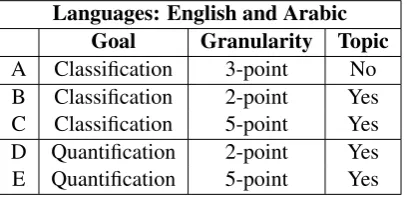
SemEval-2017 Task 4 consists of five subtasks, each offered for both Arabic and English:
1. Subtask A: Given a tweet, decide whether it expresses POSITIVE, NEGATIVEor NEU -TRALsentiment.
3. Subtask C: Given a tweet and a topic, classify the sentiment conveyed in the tweet towards that topic on a five-point scale: STRONGLYPOSITIVE, WEAKLYPOS -ITIVE, NEUTRAL, WEAKLYNEGATIVE, and STRONGLYNEGATIVE.
4. Subtask D: Given a set of tweets about a topic, estimate the distribution of tweets across the POSITIVEand NEGATIVEclasses. 5. Subtask E: Given a set of tweets about a topic, estimate the distribution of tweets across the five classes: STRONGLYPOS -ITIVE, WEAKLYPOSITIVE, NEUTRAL, WEAKLYNEGATIVE, and STRONGLYNEG -ATIVE.
Languages: English and Arabic
Goal Granularity Topic
A Classification 3-point No
B Classification 2-point Yes
C Classification 5-point Yes
D Quantification 2-point Yes
[image:3.595.81.285.309.410.2]E Quantification 5-point Yes
Table 1: Summary of the subtasks.
Each subtask is run for both English and Arabic. Subtask A has been run in all previous editions of the task and continues to be the most popular one (see section5.) Subtasks B-E have all been run at SemEval-2016 Task 4 (Nakov et al.,2016a), with variants running in 2015 (Rosenthal et al.,2015). Table1shows a summary of the subtasks.
3 Datasets
Our datasets consist of tweets annotated for sen-timent on a 2-point, 3-point, and 5-point scales. We made available to participants all the data from previous years (Nakov et al., 2016a) for the En-glish training sets, and we collected new training data for Arabic, as well as new test sets for both English and Arabic. The annotation scheme re-mained the same as last year (Nakov et al.,2016a), with the key new contribution being to apply the task and instructions to Arabic as well as provid-ing a script to download basic user information. All annotations were performed on CrowdFlower. Note that we release all our datasets to the research community to be used freely beyond SemEval.
3.1 Tweet Collection
We chose English and Arabic topics based on pop-ular current events that were trending on Twit-ter, both internationally and in specific Arabic-speaking countries, using local and global Twitter trends.1 The topics included a range of named
en-tities (e.g., Donald Trump, iPhone), geopolitical entities (e.g.,Aleppo,Palestine), and other entities (e.g., Syrian refugees, Dakota Access Pipeline,
Western media, gun control, and vegetarianism). We then used the Twitter API to download tweets, along with corresponding user information, con-taining mentions of these topics in the specified language. We intentionally chose to use some overlapping topics between the two languages in order to encourage cross-language approaches.
We automatically filtered the tweets for dupli-cates and we removed those for which the bag-of-words cosine similarity exceeded 0.6. We then re-tained only the topics for which at least 100 tweets remained. The training tweets for Arabic were collected over the period of September-November 2016 and all test tweets were collected over the period of December 2016-January 2017.
For both English and Arabic, the topics for the test dataset were different from those in the train-ing and in the development datasets.
3.2 Annotation using CrowdFlower
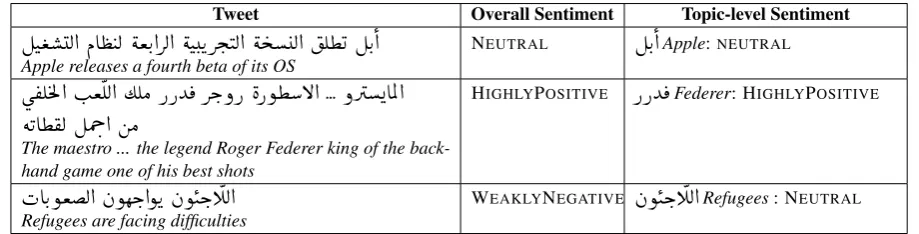
We used CrowdFlower to annotate the new train-ing and testtrain-ing tweets. The annotators were asked to indicate the overall polarity of the tweet (on a five-point scale) as well as the polarity of the tweet towards the given target topic (again, on a five-point scale), as described in (Nakov et al.,2016a). We also provided additional examples, some of which are shown in Tables 2 and 3. In particu-lar, we stressed that topic-level positive or negative sentiment needed to express an opinion about the topic itself rather than about a positive or a nega-tive event occurring in the context of the topic (see for example, the third row of Table3).
Each tweet was annotated by at least five peo-ple, and we created many hidden tests for qual-ity control, which we used to reject annotations by contributors who missed a large number of the hidden tests. We also created pilot runs, which helped us adjust the annotation instructions until we found, based on manual inspection, the quality of the annotated tweets to be satisfactory.
Tweet Overall Sentiment Topic-level Sentiment Who are you tomorrow? Will you make me smile or just
bring me sorrow? #HottieOfTheWeek Demi Lovato NEUTRAL Demi Lovato: POSITIVE Saturday without Leeds United is like Sunday dinner it
[image:4.595.74.527.63.134.2]doesn’t feel normal at all (Ryan) WEAKLYNEGATIVE Leeds United: HIGHLYPOSITIVE Apple releases a new update of its OS NEUTRAL Apple: NEUTRAL
Table 2: Some English example annotations that we provided to the annotators.
Tweet Overall Sentiment Topic-level Sentiment
ÉJ ª Ë@ ÐA ¢ JË éªK.@QË@ éJ.KQj.JË@ é j Ë@ Ê¢ ÉK.
@
Apple releases a fourth beta of its OS N
EUTRAL
ÉK.
@
Apple:NEUTRALù ®Ê mÌ'@ I.ª
ÊË@ ½ÊÓ PPY ¯ Qk.ðP èPñ¢B@ ... ðQAÖÏ@
éKA¢®Ë ÉÔg.@ áÓ
The maestro ... the legend Roger Federer king of the back-hand game one of his best shots
HIGHLYPOSITIVE
PPY ¯
Federer: HIGHLYPOSITIVEHAK.ñªË@ àñêk.@ñK àñJk.CË@
Refugees are facing difficulties W
EAKLYNEGATIVE
àñJk.CË@
Refugees: NEUTRALTable 3: Some Arabic example annotations that we provided to the annotators.
For Arabic, the contributors tended to annotate somewhat conservatively, and thus a very small number of HIGHLYPOSITIVE and HIGHLYNEG -ATIVE annotations were consolidated, despite us having provided examples of such annotations.
3.3 Consolidating the Annotations
As the annotations are on a five-point scale, where the expected agreement is lower, we used a two-step procedure. If three out of the five annotators agreed on a label, we accepted the label. Oth-erwise, we first mapped the categorical labels to the integer values −2, −1, 0, 1, 2. Then we calculated the average, and finally we mapped that average to the closest integer value. In or-der to counter-balance the tendency of the aver-age to stay away from the extreme values−2 and 2, and also to prefer 0, we did not use round-ing at ±0.5 and ±1.5, but at ±0.4 and ±1.4 in-stead. Finally, note that the values−2, −1, 0, 1, 2 are to be interpreted as STRONGLYNEGATIVE, WEAKLYNEGATIVE, NEUTRAL, WEAKLYPOSI -TIVE, and STRONGLYPOSITIVE, respectively.
3.4 Data Statistics
The English training and development data this year consisted of the data from all previous edi-tions of this task (Nakov et al.,2013;Rosenthal et al.,2014,2015;Nakov et al.,2016b). Unlike in previous years, we did not set aside data to assess progress compared to prior years. Therefore, we allowed all data to be used for training and devel-opment.
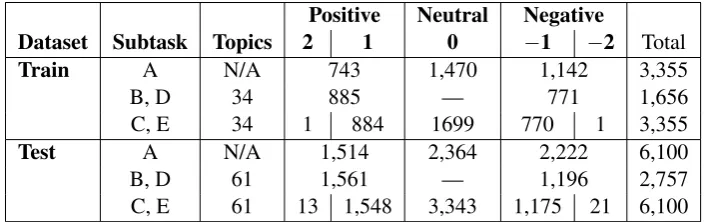
For evaluation, we used the newly-created data de-scribed in the previous subsection. Tables4and 5
show the statistics for the English and Arabic data. For English, we only show the aggregate statis-tics for the training data; the breakdown from prior years can be found in (Nakov et al.,2016a). Note that the same tweets were annotated for multiple subtasks, so there is overlap between the tweets across the tasks. Duplicates may have occurred where the same tweet was extracted for multiple topics.
As Arabic is a new language this year, we cre-ated for it a default train-development split of the Arabic data for the participants to use if they wished to do so.
3.5 Data Distribution
As in previous years, we provided the participants with a script2 to download the training tweets
given IDs. In addition, this year we also included in the script the option to download basic user in-formation for the author of each tweet: user id, follower count, status count, description, friend count, location, language, name, and time zone. To ensure a fair evaluation, the test set was pro-vided via download and included the tweets as well as the basic user information provided by the download script. The training and the test data is available for downloaded on our task page.3
2https://github.com/seirasto/twitter_ download
[image:4.595.69.529.164.281.2]Positive Neutral Negative
Dataset Subtask Topics 2 1 0 −1 −2 Total
Train A N/A 19,902 22,591 7,840 50,333
B, D 373 14,951 1,544 4,013 20,508
C, E 200 1,020 12,922 12,993 3,398 299 30,632
Test A N/A 2375 5,937 3,972 12,284
B, D 125 2,463 — 3,722 6,185
[image:5.595.112.489.61.171.2]C, E 125 131 2,332 6,194 3,545 177 12,379
Table 4: Statistics about the English training and testing datasets. The training data is the aggregate of all data from prior years, while the testing data is new.
Positive Neutral Negative
Dataset Subtask Topics 2 1 0 −1 −2 Total
Train A N/A 743 1,470 1,142 3,355
B, D 34 885 — 771 1,656
C, E 34 1 884 1699 770 1 3,355
Test A N/A 1,514 2,364 2,222 6,100
B, D 61 1,561 — 1,196 2,757
C, E 61 13 1,548 3,343 1,175 21 6,100
Table 5: Statistics about the newly collected Arabic training and testing datasets.
4 Evaluation Measures
This section describes the evaluation measures for our five subtasks. Note that for Subtasks B to E, the datasets are each subdivided into a number of topics, and the subtask needs to be carried out in-dependently for each topic. As a result, each of the evaluation measures will be “macroaveraged” across the topics, i.e., we compute the measure in-dividually for each topic, and we then average the results across the topics.
4.1 Subtask A: Overall Sentiment of a Tweet
Our primary measure is AvgRec, or average re-call, which is recall averaged across the POSITIVE (P), NEGATIVE (N), and NEUTRAL (U) classes. This measure has desirable theoretical properties (Sebastiani,2015), and is also the one we use as primarily for Subtask B. It is computed as follows:
AvgRec= 13(RP +RN +RU) (1) where RP, RN and RU refer to recall with
re-spect to the POSITIVE, the NEGATIVE, and the NEUTRAL class, respectively. See (Nakov et al.,
2016a) for more detail.
AvgRec ranges in [0,1], where a value of 1 is achieved only by the perfect classifier (i.e., the classifier that correctly classifies all items), a value of 0 is achieved only by the perverse classifier
(the classifier that misclassifies all items), while 0.3333is both (i) the value for a trivial classifier (i.e., one that assigns all tweets to the same class – be it POSITIVE, NEGATIVE, or NEUTRAL), and (ii) the expected value of a random classifier.
The advantage ofAvgRecover “standard” accu-racy is that it is more robust to class imbalance. The accuracy of the majority-class classifier is the relative frequency (aka “prevalence”) of the ma-jority class, that may be much higher than 0.5 if the test set is imbalanced. StandardF1is also
sen-sitive to class imbalance for the same reason. An-other advantage ofAvgRecoverF1is thatAvgRec
is invariant with respect to switching POSITIVE with NEGATIVE, whileF1is not. See (Sebastiani, 2015) for more detail onAvgRec.
We further use two secondary measures: accu-racy andFP N
1 . The latter was the primary
evalu-ation measure for Subtask A in previous editions of the task. It is macro-averageF1, calculated over
the POSITIVEand the NEGATIVEclasses (note the exclusion of NEUTRAL). This year, we demoted
FP N
1 to a secondary evaluation measure. It is
cal-culated as follows:
F1P N = 12(F1P +F1N) (2)
whereFP
1 andF1N refer toF1with respect to the
[image:5.595.122.477.218.329.2]4.2 Subtask B: Topic-Based Classification on a 2-point Scale
As in 2016, our primary evaluation measure for subtask B is average recall, or AvgRec (note that there are only two classes for this subtask):
AvgRec= 12(RP +RN) (3) We further use accuracy and F1 as secondary
measures for subtask B. Finally, as subtask B is topic-based, we computed each metric individu-ally for each topic, and we then averaged the result across the topics to yield the final score.
4.3 Subtask C: Topic-based Classification on a 5-point Scale
Subtask C is anordinal classification(also known as ordinal regression) task, in which each tweet must be classified into exactly one of the classes inC={HIGHLYPOSITIVE, POSITIVE, NEUTRAL, NEGATIVE, HIGHLYNEGATIVE}, represented in our dataset by numbers in {+2,+1,0,−1,−2}, with a total order defined onC.
We adopt an evaluation measure that takes the order of the five classes into account. For instance, misclassifying a HIGHLYNEGATIVE example as HIGHLYPOSITIVE is a bigger mistake than mis-classifying it as NEGATIVEor as NEUTRAL.
As in SemEval-2016 Task 4, we use macro-average mean absolute error (MAEM) as the
main ordinal classification measure:
MAEM(h, T e) = |C|1
|C|
X
j=1 1 |T ej|
X
xi∈T ej
|h(xi)−yi|
whereyi denotes the true label of itemxi,h(xi)
is its predicted label, T ej denotes the set of test
documents whose true class iscj,|h(xi)−yi|
de-notes the “distance” between classesh(xi)andyi
(e.g., the distance between HIGHLYPOSITIVEand NEGATIVEis 3), and the “M” superscript indicates “macroaveraging”.
The advantage of MAEM over “standard”
mean absolute error, which is defined as
MAEµ(h, T e) = |T e1 | X xi∈T e
|h(xi)−yi| (4)
is that it is robust to class imbalance (which is useful, given the imbalanced nature of our dataset). On perfectly balanced datasetsMAEM
andMAEµare equivalent.
MAEM is an extension of macro-average recall
for ordinal regression; yet, it is a measure of er-ror, and thus lower values are better. We also use MAEµ as a secondary measure, in order to
pro-vide better consistency with Subtasks A and B. These measures are computed for each topic, and the results are then averaged across all topics to yield the final score. See (Baccianella et al.,2009) for more detail aboutMAEM andMAEµ.
4.4 Subtask D: Tweet Quantification on a 2-point Scale
Subtask D assumes a binary quantification setup, in which each tweet is classified as POSITIVE or NEGATIVE, and the distribution across classes must be estimated. The difference with binary classification is that errors of different polarity (e.g., a false positive and a false negative for the same class) can compensate for each other in quantification. Quantification is thus a more le-nient task than classification, since a perfect classi-fier is also a perfect quanticlassi-fier, but a perfect quan-tifier is not necessarily a perfect classifier.
For evaluating binary quantification, we keep the Kullback-Leibler Divergence (KLD) measure used in 2016 along with additive smoothing (Nakov et al., 2016a; Forman, 2005). KLD was proposed as a quantification measure in (Forman,
2005), and is defined as follows:
KLD(ˆp, p,C) = X
cj∈C
p(cj) logep(cp(cˆ j) j) (5)
KLDis a measure of the error made in estimat-ing a true distributionpover a setC of classes by means of a predicted distributionpˆ. LikeMAEM,
KLD is a measure of error, which means that lower values are better. KLD ranges between 0 (best) and+∞(worst).
Note that the upper bound ofKLDis not finite since Equation 5 has predicted prevalences, and not true prevalences, at the denominator: that is, by making a predicted prevalencep(cˆ j)infinitely
small we can makeKLDinfinitely large. To solve this problem, in computingKLDwe smooth both p(cj)andp(cˆ j)via additive smoothing, i.e.,
ps(cj) = p(cj) +
(X
cj∈C
p(cj)) +· |C|
=1 +p(cj) +· |C|
where ps(c
j) denotes the smoothed version of
p(cj) and the denominator is just a normalizer
(same for thepˆs(cj)’s); the quantity = 1 2·|T e| is
used as a smoothing factor, whereT edenotes the test dataset.
The smoothed versions ofp(cj) andp(cˆ j) are
used in place of their original versions in Equation
5; as a result, KLD is always defined and still returns a value of 0 whenpandpˆcoincide.
Like MAEM, KLD is a measure of error,
which means that lower values are better. We further use two secondary error-based evaluation measures: absolute error(AE), andrelative abso-lute error(RAE).
Again, the measures are computed individually for each topic, and the results are averaged across the topics to yield the final score.
4.5 Subtask E: Tweet Quantification on a 5-point Scale
Subtask E is an ordinal quantification task. As in binary quantification, the goal is to compute the distribution across classes, this time assuming a quantification setup.
Here each tweet belongs exactly to one of the classes in C={HIGHLYPOSITIVE, POS -ITIVE, NEUTRAL, NEGATIVE, HIGHLYNEGA -TIVE}, where there is a total order on C. As in binary quantification, the task is to compute an es-timatep(cˆ j)of the relative frequencyp(cj)in the
test tweets of all the classescj ∈ C.
The measure we adopt for ordinal quantifi-cation is the Earth Mover’s Distance (Rubner et al., 2000), also known as the Vaser˘ste˘ın met-ric(R¨uschendorf,2001), a measure well-known in the field of computer vision. EMD is currently the only known measure for ordinal quantifica-tion. It is defined for the general case in which a distanced(c0, c00)is defined for eachc0, c00 ∈ C.
When there is a total order on the classes inCand d(ci, ci+1) = 1 for all i ∈ {1, ...,(C −1)}, the
Earth Mover’s Distance is defined as
EMD(ˆp, p) =
|C|−X1
j=1
|
j
X
i=1 ˆ p(ci)−
j
X
i=1
p(ci)| (7)
and can be computed in |C| steps from the esti-mated and true class prevalences.
Like KLD, EMD is a measure of error, so lower values are better; EMD ranges between 0 (best) and|C| −1(worst). See (Esuli and Sebas-tiani,2010) for more detail onEMD.
As before, EMD is computed individually for each topic, and the results are then averaged across all topics to yield the final score. For more detail onEMD, the reader is referred to (Esuli and Se-bastiani,2010) and to last year’s task description paper (Nakov et al.,2016a).
5 Participants and Results
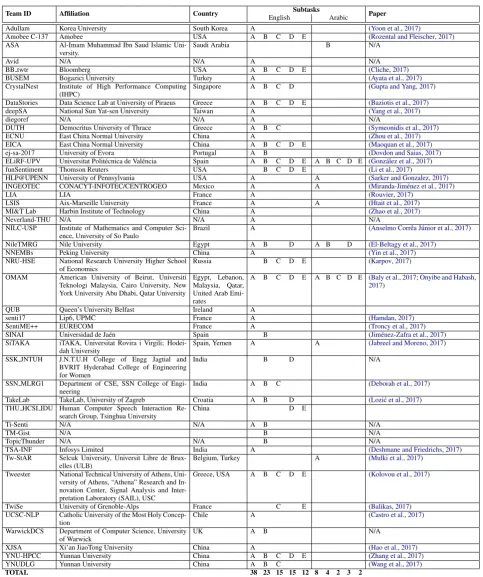
A total of 48 teams participated in SemEval-2017 Task 4 this year. As in previous years, the most popular subtask this year was Subtask A, with 38 teams participating in the English subtask A, and 8 teams participating in the Arabic subtask A. Over-all, there were 46 teams who participated in some English subtask and 9 teams that participated in some Arabic subtask. There were 28 teams that participated in a subtask other than subtask A. Moreover, two teams (OMAM and ELiRF-UPV) participated in all English and in all Arabic sub-tasks. There were 9 teams that participated in the topic versions of the subtasks but not in subtask A, reflecting a growing interest among researchers in developing systems for topic-specific analysis.
5.1 Common Resources and Methods
In terms of methods, the use of deep learning stands out in particular, and we also see an in-crease over the last year. There were at least 20 teams who used deep learning and neural network methods such as CNN and LSTM networks. Su-pervised SVM and Liblinear were also very popu-lar, with several participants combining SVM with neural network methods or SVM with dense word embedding features. Other teams used classifiers such as Maximum Entropy, Logistic Regression, Random Forest, Na¨ıve Bayes classifier, and Con-ditional Random Fields.
Common software used included Python (with the sklearn and numpy libraries), Java, Tensor-flow, Weka, NLTK, Keras, Theano, and Stanford CoreNLP. The most common external datasets used were sentiment140 as a lexicon, pre-trained word2vec embeddings. Many teams further gath-ered additional tweets using the Twitter API that were not annotated for sentiment. These were used for distant supervision, lexicon building, and word vector training.
# System AvgRec FP N
1 Acc 1 DataStories 0.6811 0.6772 0.6515
[image:8.595.74.289.61.485.2]BB twtr 0.6811 0.6851 0.6583 3 LIA 0.6763 0.6743 0.6612 4 Senti17 0.6744 0.6654 0.6524 5 NNEMBs 0.6695 0.6585 0.6641 6 Tweester 0.6596 0.6486 0.6486 7 INGEOTEC 0.6497 0.6457 0.63311 8 SiTAKA 0.6458 0.6289 0.6439 9 TSA-INF 0.6439 0.62011 0.61617 10 UCSC-NLP 0.64210 0.62410 0.56530 11 HLP@UPENN 0.63711 0.6328 0.6468 12 YNU-HPCC 0.63312 0.61215 0.6477 SentiME++ 0.63312 0.61313 0.60123 14 ELiRF-UPV 0.63214 0.61912 0.59924 15 ECNU 0.62815 0.61313 0.63012 16 TakeLab 0.62716 0.60716 0.62814 17 DUTH 0.62117 0.60517 0.64010 18 CrystalNest 0.61918 0.59319 0.62913 19 deepSA 0.61819 0.58720 0.61617 20 NILC-USP 0.61220 0.59518 0.61716 21 Ti-Senti 0.60721 0.57722 0.62715 22 BUSEM 0.60522 0.58720 0.60322 23 EICA 0.59523 0.55524 0.59924 24 OMAM 0.59024 0.54226 0.61519 25 Adullam 0.58925 0.55225 0.61420 26 NileTMRG 0.57826 0.51532 0.60621 27 Amobee-C-137 0.57527 0.52030 0.58727 28 ej-za-2017 0.57128 0.53927 0.58228 LSIS 0.57128 0.56123 0.52134 30 XJSA 0.55630 0.51931 0.57529 31 Neverland-THU 0.55531 0.50733 0.59726 32 MI&T-Lab 0.55132 0.52229 0.56131 33 diegoref 0.54633 0.52728 0.54033 34 xiwu 0.47934 0.36534 0.54732 35 SSN MLRG1 0.43135 0.34435 0.43935 36 YNUDLG 0.34036 0.20137 0.38736 37 WarwickDCS 0.33537 0.22136 0.38237 Avid 0.33537 0.16338 0.20638 B1 All POSITIVE 0.333 0.162 0.193 B2 All NEGATIVE 0.333 0.244 0.323 B3 All NEUTRAL 0.333 0.000 0.483
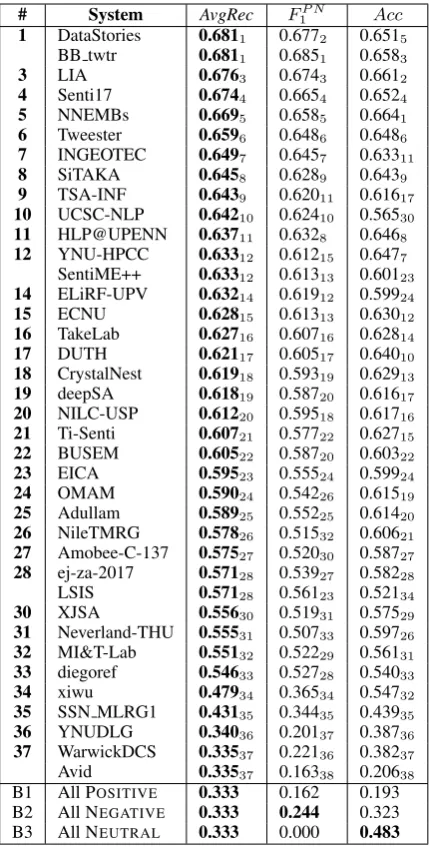
Table 6:Results for Subtask A “Message Polar-ity Classification”, English. The systems are or-dered by average recallAvgRec(higher is better). In each column, the rankings according to the cor-responding measure are indicated with a subscript. Bxindicates a baseline.
5.2 Results for Subtask A: Overall Sentiment in a Tweet
Tables 6and7show the results for Subtask A in English and Arabic, respectively, where the teams are ranked by macro-average recall.
For English the best ranking teams were
BB twtrandDataStories, both achieving a macro-average recall of 0.681. Both top teams used deep learning; BB twtr used an ensemble of LSTMs and CNNs with multiple convolution operations, whileDataStoriesused deep LSTM networks with an attention mechanism.
# System AvgRec FP N
[image:8.595.311.521.61.184.2]1 Acc 1 NileTMRG 0.5831 0.6101 0.5811 2 SiTAKA 0.5502 0.5712 0.5632 3 ELiRF-UPV 0.4783 0.4674 0.5083 4 INGEOTEC 0.4774 0.4555 0.4994 5 OMAM 0.4385 0.4226 0.4308 LSIS 0.4385 0.4693 0.4456 7 Tw-StAR 0.4317 0.4167 0.4545 8 HLP@UPENN 0.4158 0.3208 0.4437 B1 All POSITIVE 0.333 0.199 0.248 B2 All NEGATIVE 0.333 0.267 0.364 B3 All NEUTRAL 0.333 0.000 0.388
Table 7:Results for Subtask A “Message Polar-ity Classification”, Arabic. The systems are or-dered by average recallAvgRec(higher is better). In each column, the rankings according to the cor-responding measure are indicated with a subscript. Bxindicates a baseline.
Both teams participated in all English subtasks and were also ranked in first (BB twtr) and sec-ond (DataStories) place for subtasks B-D;BB twtr
was also ranked first for subtask E.
The top 5 teams for English were very closely scored. The following four best-ranked teams all used deep learning or deep learning ensembles. Three of the top-10 scoring teams (INGEOTEC,
SiTAKA, and UCSC-NLP) used SVM classifiers instead, with various surface, lexical, semantic, and dense word embedding features. The use of ensembles clearly stood out, with five of the top-10 scoring systems (BB twtr, LIA,NNEMBs,
Tweester, andINGEOTEC) using ensembles, hy-brid, stacking or some kind of mix of learning methods. All teams beat the baseline on macro-average recall; however, a few teams did not beat the harsher average F-measure and accuracy base-lines.
For Arabic the best-ranked team was
NileTMRG, and it achieved a score of 0.583. They used a Na¨ıve Bayes classifier with a combination of lexical and sentiment features; they further augmented the training dataset to about 13K examples using external tweets. The
The difference in the absolute scores for the two languages is probably partially due to the differ-ence in the amount of training data available for Arabic, which was much smaller compared En-glish, even when external datasets were taken into account. The results also reflect the linguistic complexity of Arabic as it is used in social me-dia, which is characterized by the abundant use of dialectal forms and spelling variants. Overall, par-ticipants preferred to focus on developing Arabic-specific systems (varying in the extent to which they applied Arabic-specific preprocessing) rather than trying to leverage cross-language models that would enable them to use English data to augment their Arabic models.
# System AvgRec F1 Acc
[image:9.595.318.515.224.435.2]1 BB twtr 0.8821 0.8901 0.8971 2 DataStories 0.8562 0.8612 0.8692 3 Tweester 0.8543 0.8563 0.8633 4 TopicThunder 0.8464 0.8474 0.8544 5 TakeLab 0.8455 0.8365 0.8406 6 funSentiment 0.8346 0.8248 0.8278 YNU-HPCC 0.8346 0.81610 0.81810 8 WarwickDCS 0.8298 0.8346 0.8435 9 CrystalNest 0.8279 0.8229 0.8278 10 Ti-Senti 0.82610 0.8307 0.8387 11 Amobee-C-137 0.82211 0.80112 0.80212 12 SINAI 0.81812 0.80611 0.80911 13 NRU-HSE 0.79813 0.78713 0.79013 14 EICA 0.79014 0.77514 0.77716 15 OMAM 0.77915 0.76217 0.76417 16 NileTMRG 0.76916 0.77415 0.78915 17 ELiRF-UPV 0.76617 0.77316 0.79013 18 DUTH 0.66318 0.60018 0.60718 19 ej-za-2017 0.59419 0.48621 0.51819 20 SSN MLRG1 0.58620 0.49420 0.51819 21 YNUDLG 0.51621 0.49919 0.49921 22 TM-Gist 0.49922 0.42822 0.44422 23 SSK JNTUH 0.48323 0.37223 0.41223 B1 All POSITIVE 0.500 0.285 0.398 B2 All NEGATIVE 0.500 0.376 0.602
Table 8: Results for Subtask B “Tweet classifi-cation according to a two-point scale”, English.
The systems are ordered by average recallAvgRec
(higher is better). Bxindicates a baseline.
# System AvgRec F1 Acc
[image:9.595.76.289.273.540.2]1 NileTMRG 0.7681 0.7671 0.7701 2 ELiRF-UPV 0.7212 0.7242 0.7342 3 ASA 0.6933 0.6704 0.6724 4 OMAM 0.6874 0.6783 0.6793 B1 All POSITIVE 0.500 0.362 0.566 B2 All NEGATIVE 0.500 0.303 0.434 Table 9: Results for Subtask B “Tweet classifi-cation according to a two-point scale”, Arabic.
The systems are ordered by average recallAvgRec
(higher is better). Bxindicates a baseline.
5.3 Results for Subtasks B and C: Topic-Based Classification
The results of Subtasks B and C are shown in Ta-bles8–11. We can see that the system scores for subtask B are higher than those for subtask A, with the best team achieving 0.882 accuracy for English (compared to 0.681 for subtask A) and 0.768 for Arabic (compared to 0.583 for subtask A). How-ever, this is primarily due to the fact there are two classes for subtask B, while there are three classes for subtask A.
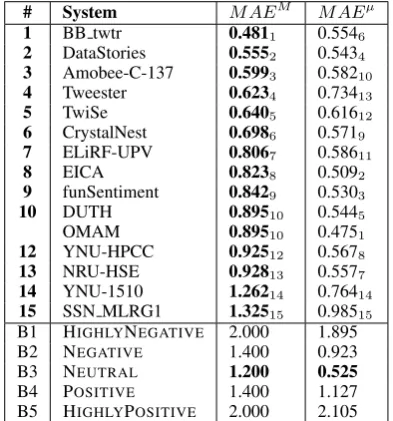
# System MAEM MAEµ
1 BB twtr 0.4811 0.5546
2 DataStories 0.5552 0.5434 3 Amobee-C-137 0.5993 0.58210 4 Tweester 0.6234 0.73413
5 TwiSe 0.6405 0.61612
6 CrystalNest 0.6986 0.5719 7 ELiRF-UPV 0.8067 0.58611
8 EICA 0.8238 0.5092
[image:9.595.317.515.518.603.2]9 funSentiment 0.8429 0.5303 10 DUTH 0.89510 0.5445 OMAM 0.89510 0.4751 12 YNU-HPCC 0.92512 0.5678 13 NRU-HSE 0.92813 0.5577 14 YNU-1510 1.26214 0.76414 15 SSN MLRG1 1.32515 0.98515 B1 HIGHLYNEGATIVE 2.000 1.895 B2 NEGATIVE 1.400 0.923 B3 NEUTRAL 1.200 0.525 B4 POSITIVE 1.400 1.127 B5 HIGHLYPOSITIVE 2.000 2.105 Table 10:Results for Subtask C “Tweet classifi-cation according to a five-point scale”, English.
The systems are ordered by their MAEM score
(lower is better). Bxindicates a baseline.
# System MAEM MAEµ
1 OMAM 0.9431 0.6461
2 ELiRF-UPV 1.2642 0.7872 B1 HIGHLYNEGATIVE 2.000 2.059 B2 NEGATIVE 1.400 1.065 B3 NEUTRAL 1.200 0.458 B4 POSITIVE 1.400 0.946 B5 HIGHLYPOSITIVE 2.000 1.941 Table 11:Results for Subtask C “Tweet classifi-cation according to a five-point scale”, Arabic.
The systems are ordered by their MAEM score
(lower is better). Bxindicates a baseline.
For English the BB twtr system, ranked first, modeled topics by concatenating the topical infor-mation at the word level. The second-best system,
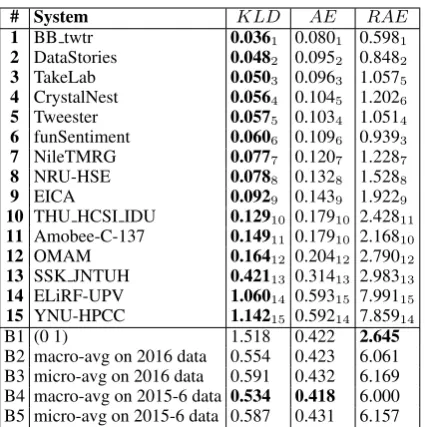
[image:9.595.77.284.617.691.2]# System KLD AE RAE
1 BB twtr 0.0361 0.0801 0.5981 2 DataStories 0.0482 0.0952 0.8482 3 TakeLab 0.0503 0.0963 1.0575 4 CrystalNest 0.0564 0.1045 1.2026 5 Tweester 0.0575 0.1034 1.0514 6 funSentiment 0.0606 0.1096 0.9393 7 NileTMRG 0.0777 0.1207 1.2287 8 NRU-HSE 0.0788 0.1328 1.5288 9 EICA 0.0929 0.1439 1.9229 10 THU HCSI IDU 0.12910 0.17910 2.42811 11 Amobee-C-137 0.14911 0.17910 2.16810 12 OMAM 0.16412 0.20412 2.79012 13 SSK JNTUH 0.42113 0.31413 2.98313 14 ELiRF-UPV 1.06014 0.59315 7.99115 15 YNU-HPCC 1.14215 0.59214 7.85914
B1 (0 1) 1.518 0.422 2.645
[image:10.595.76.289.59.273.2]B2 macro-avg on 2016 data 0.554 0.423 6.061 B3 micro-avg on 2016 data 0.591 0.432 6.169 B4 macro-avg on 2015-6 data 0.534 0.418 6.000 B5 micro-avg on 2015-6 data 0.587 0.431 6.157 Table 12: Results for Subtask D “Tweet quan-tification according to a two-point scale”, En-glish. The systems are ordered by their KLD score (lower is better). Bxindicates a baseline.
# System KLD AE RAE
1 NileTMRG 0.1271 0.1701 2.4621 2 OMAM 0.2022 0.2382 4.8352 3 ELiRF-UPV 1.1833 0.5373 11.4343
B1 (0 1) 1.518 0.422 2.645
B2 macro-avg on train-2017 0.296 0.322 6.600 B3 micro-avg on train-2017 0.295 0.321 6.692 Table 13: Results for Subtask D “Tweet quan-tification according to a two-point scale”, Ara-bic.The systems are ordered by theirKLDscore (lower is better). Bxindicates a baseline.
funSentiment, ranked 6th and 9th for subtasks B and C, respectively, modeled the sentiment to-wards the topic using the left and the right context around a topic mention in the tweet.WarwickDCS, ranked 8th, used simple tweet-level classification, while ignoring the topic. Overall, almost all teams managed to outperform the majority class baseline for subtask B, but only two teams outperformed the NEUTRALclass baseline for subtask C.
For Arabic four teams participated in Subtask B and two teams in Subtask C.NileTMRGwas once again ranked first for Subtask B, with a system based on ensembles of specific and topic-agnostic models. For subtask C,OMAMalso used combinations of such models applied in succes-sion. All teams easily outperformed the baselines for Subtask B, but only theOMAMteam managed to do so for Subtask C.
# System EMD
1 BB twtr 0.245
2 TwiSe 0.269
3 funSentiment 0.273
4 ELiRF-UPV 0.306
5 NRU-HSE 0.317
6 Amobee-C-137 0.345
7 OMAM 0.350
8 Tweester 0.365
9 THU HCSI IDU 0.385
10 YNU-HPCC 0.447
11 DataStories 0.595
12 EICA 1.461
B1 (0 0 0 1 0) 1.123
[image:10.595.335.501.61.224.2]B2 macro-avg on 2016 data 0.583 B3 micro-avg on 2016 data 0.552
Table 14: Results for Subtask E “Tweet quan-tification according to a five-point scale”, En-glish. The systems are ordered by their EMD score (lower is better). Bxindicates a baseline.
# System EMD
1 OMAM 0.548
2 ELiRF-UPV 0.564
B1 (0 0 1 0 0) 0.458
[image:10.595.334.500.299.362.2]B2 macro-avg on train-2017 0.440 B3 micro-avg on train-2017 0.440
Table 15: Results for Subtask E “Tweet quan-tification according to a five-point scale”, Ara-bic.The systems are ordered by theirEMDscore (lower is better). Bxindicates a baseline.
5.4 Results for Subtasks D and E: Tweet Quantification
Tables12–15show the results for the tweet quan-tification subtasks. The bottom of the tables report the result of a baseline system, B1, that assigns a prevalence of 1 to the majority class (which is the POSITIVEclass for subtask D, and the WEAK -LYPOSITIVE/NEUTRAL class for subtask E, En-glish/Arabic) and 0 to the other class(es).
[image:10.595.74.290.349.422.2]There were 15 participating teams competing in Subtask D: 15 for English and 3 for Arabic (these 3 teams all participated in English). As in the other subtasks, BB twtr was ranked first in En-glish. They achieved an improvement of .50 points absolute in KLD over the best baseline, and a .01 improvement over the next best team,DataStories. For Arabic, the best team wasNileTMRGWith im-provement of .17 over the best baseline and of .08 over the next best team, OMAM. All but the last two teams in English and the last team for Arabic outperformed all baselines.
In Subtask E, there were 12 participating teams, withOMAM andEliRF-UPV competing for both English and Arabic. Once again,BB twtrwas the best for English, improving over the best baseline by .31 EMD points absolute. Interestingly, this is the first subtask where DataStories was not the second-ranked team. BB twtr outperformed the second-best team, TwiSe, by .02 points. For En-glish, all but the last two teams outperformed the baselines. However, for Arabic, none of the two participating teams could do so.
5.5 User Information
This year, we encouraged teams to explore using in their models information about the user who wrote the tweet, which can be extracted from the public user profiles of the respective Twitter users. Participants could also try features about follow-ing relations and the structure of the social net-work in general, as well as could make use of other tweets by the target user when analyzing one par-ticular tweet. Four teams tried that:SINAI,ECNU,
TakeLab, and OMAM. OMAM and TakeLab did not find any improvements, and ultimately decided not to use any user information. ECNUused pro-file information such as favorited, favorite count, retweeted, and retweet count. They ended up 15th in Subtask A.SINAIused the last 200 tweets from the person’s timeline. They ranked 12th in Subtask B. They generated a user model from the timeline of a given target user. They built a general SVM model on word2vec embeddings. Then, for each user in the test set, they downloaded the last 200 tweets published by the user and classified their sentiment using that SVM classifier. If the clas-sified user tweets achieved an accuracy above a threshold (0.7), the user model was applied on the authored tweets from the test set. If not, the gen-eral SVM model was used.
It is difficult to judge whether and by how much user information could help the best approaches as they did not try to use such information. How-ever, we believe that building and using a Twit-ter user profile is a promising research direction, and that participants should learn how to make this work in the future. Thus, we would like to en-courage more teams to try to explore using this information. We would also like to provide more user information such as age and gender, which we can predict automatically (Rosenthal and McKe-own,2016), when it is not directly available from the user profile. Another promising direction is to make use of “conversations” in Twitter, i.e., take into account the replies to tweets in Twitter. For example, previous work (Vanzo et al., 2014) has shown that it is beneficial to model the polarity de-tection problem as a sequential classification task over streams of tweets, where the stream is a “con-versation” on Twitter containing tweets, replies to these tweets, replies to these replies, etc.
6 Conclusion and Future Work
Team ID Affiliation Country EnglishSubtasks Arabic Paper
Adullam Korea University South Korea A (Yoon et al.,2017)
Amobee C-137 Amobee USA A B C D E (Rozental and Fleischer,2017) ASA Al-Imam Muhammad Ibn Saud Islamic
Uni-versity. Saudi Arabia B N/A
Avid N/A N/A A N/A
BB twtr Bloomberg USA A B C D E (Cliche,2017) BUSEM Bogazici University Turkey A (Ayata et al.,2017) CrystalNest Institute of High Performance Computing
(IHPC) Singapore A B C D (Gupta and Yang,2017) DataStories Data Science Lab at University of Piraeus Greece A B C D E (Baziotis et al.,2017) deepSA National Sun Yat-sen University Taiwan A (Yang et al.,2017)
diegoref N/A N/A A N/A
DUTH Democritus University of Thrace Greece A B C (Symeonidis et al.,2017) ECNU East China Normal University China A (Zhou et al.,2017) EICA East China Normal University China A B C D E (Maoquan et al.,2017) ej-sa-2017 University of Evora Portugal A B (Dovdon and Saias,2017) ELiRF-UPV Universitat Polit´ecnica de Val´encia Spain A B C D E A B C D E (Gonz´alez et al.,2017) funSentiment Thomson Reuters USA B C D E (Li et al.,2017)
HLP@UPENN University of Pennsylvania USA A A (Sarker and Gonzalez,2017) INGEOTEC CONACYT-INFOTEC/CENTROGEO Mexico A A (Miranda-Jim´enez et al.,2017)
LIA LIA France A (Rouvier,2017)
LSIS Aix-Marseille University France A A (Htait et al.,2017) MI&T Lab Harbin Institute of Technology China A (Zhao et al.,2017)
Neverland-THU N/A N/A A N/A
NILC-USP Institute of Mathematics and Computer
Sci-ence, University of So Paulo Brazil A (Anselmo Corrˆea J´unior et al.,2017) NileTMRG Nile University Egypt A B D A B D (El-Beltagy et al.,2017)
NNEMBs Peking University China A (Yin et al.,2017) NRU-HSE National Research University Higher School
of Economics Russia B C D E (Karpov,2017) OMAM American University of Beirut, Universiti
Teknologi Malaysia, Cairo University, New York University Abu Dhabi, Qatar University
Egypt, Lebanon, Malaysia, Qatar, United Arab Emi-rates
A B C D E A B C D E (Baly et al.,2017;Onyibe and Habash,
2017)
QUB Queen’s University Belfast Ireland A
senti17 Lip6, UPMC France A (Hamdan,2017) SentiME++ EURECOM France A (Troncy et al.,2017) SINAI Universidad de Ja´en Spain B (Jim´enez-Zafra et al.,2017) SiTAKA iTAKA, Universitat Rovira i Virgili;
Hodei-dah University Spain, Yemen A A (Jabreel and Moreno,2017) SSK JNTUH J.N.T.U.H College of Engg Jagtial and
BVRIT Hyderabad College of Engineering for Women
India B D N/A
SSN MLRG1 Department of CSE, SSN College of
Engi-neering India A B C (Deborah et al.,2017) TakeLab TakeLab, University of Zagreb Croatia A B D (Lozi´c et al.,2017) THU HCSI IDU Human Computer Speech Interaction
Re-search Group, Tsinghua University China D E
Ti-Senti N/A N/A A B N/A
TM-Gist N/A B N/A
TopicThunder N/A N/A B N/A
TSA-INF Infosys Limited India A (Deshmane and Friedrichs,2017) Tw-StAR Selcuk University, Universit Libre de
Brux-elles (ULB) Belgium, Turkey A (Mulki et al.,2017) Tweester National Technical University of Athens,
Uni-versity of Athens, “Athena” Research and In-novation Center, Signal Analysis and Inter-pretation Laboratory (SAIL), USC
Greece, USA A B C D E (Kolovou et al.,2017)
TwiSe University of Grenoble-Alps France C E (Balikas,2017) UCSC-NLP Catholic University of the Most Holy
Concep-tion Chile A (Castro et al.,2017) WarwickDCS Department of Computer Science, University
of Warwick UK A B N/A
XJSA Xi’an JiaoTong University China A (Hao et al.,2017) YNU-HPCC Yunnan University China A B C D E (Zhang et al.,2017) YNUDLG Yunnan University China A B C (Wang et al.,2017)
[image:12.595.70.554.57.635.2]TOTAL 38 23 15 15 12 8 4 2 3 2
Table 16: Alphabetical list of the participating teams, their affiliation, country, the subtasks they par-ticipated in, and the system description paper that they contributed to SemEval-2017. Teams whose
References
Muhammad Abdul-Mageed, Mona Diab, and Sandra K¨ubler. 2014. Samar: Subjectivity and sentiment analysis for Arabic social media. Computer Speech & Language28(1):20–37.
Muhammad Abdul-Mageed and Mona T. Diab. 2011. Subjectivity and sentiment annotation of modern standard Arabic newswire. InProceedings of the 5th Linguistic Annotation Workshop. Portland, Oregon, USA, LAW ’11, pages 110–118.
Mohammad Al-Smadi, Omar Qawasmeh, Bashar Ta-lafha, and Muhannad Quwaider. 2015. Human an-notated Arabic dataset of book reviews for aspect based sentiment analysis. In Proceedings of the 3rd International Conference on Future Internet of Things and Cloud. Rome, Italy, FiCloud ’15, pages 726–730.
Edilson Anselmo Corrˆea J´unior, Vanessa Marinho, and Leandro Santos. 2017. NILC-USP at SemEval-2017 Task 4: A Multi-view Ensemble for Twitter Senti-ment Analysis. InProceedings of the 11th Interna-tional Workshop on Semantic Evaluation. Vancou-ver, Canada, SemEval ’17, pages 610–614.
Deger Ayata, Murat Saraclar, and Arzucan Ozgur. 2017. BUSEM at SemEval-2017 Task 4A: Sen-timent Analysis with Word Embedding and Long Short Term Memory RNN Approaches. In Proceed-ings of the 11th International Workshop on Seman-tic Evaluation. Vancouver, Canada, SemEval ’17, pages 776–782.
Stefano Baccianella, Andrea Esuli, and Fabrizio Sebas-tiani. 2009. Evaluation measures for ordinal regres-sion. InProceedings of the 9th IEEE International Conference on Intelligent Systems Design and Ap-plications. Pisa, Italy, ISDA ’09, pages 283–287. Georgios Balikas. 2017. TwiSe at SemEval-2017 Task
4: Five-point Twitter Sentiment Classification and Quantification. InProceedings of the 11th Interna-tional Workshop on Semantic Evaluation. Vancou-ver, Canada, SemEval ’17, pages 754–758.
Ramy Baly, Gilbert Badaro, Ali Hamdi, Rawan Moukalled, Rita Aoun, Georges El-Khoury, Ah-mad Al Sallab, Hazem Hajj, Nizar Habash, Khaled Shaban, and Wassim El-Hajj. 2017. OMAM at SemEval-2017 Task 4: Evaluation of English State-of-the-Art Sentiment Analysis Models for Arabic and a New Topic-based Model. InProceedings of the 11th International Workshop on Semantic Evalu-ation. Vancouver, Canada, SemEval 17, pages 602– 609.
Christos Baziotis, Nikos Pelekis, and Christos Doulk-eridis. 2017. DataStories at SemEval-2017 Task 4: Deep LSTM with Attention for Message-level and Topic-based Sentiment Analysis. InProceedings of the 11th International Workshop on Semantic Evalu-ation. Vancouver, Canada, SemEval ’17, pages 746– 753.
Johan Bollen, Huina Mao, and Xiao-Jun Zeng. 2011. Twitter mood predicts the stock market. Journal of Computational Science2(1):1–8.
Javier Borge-Holthoefer, Walid Magdy, Kareem Dar-wish, and Ingmar Weber. 2015. Content and net-work dynamics behind Egyptian political polariza-tion on Twitter. InProceedings of the 18th ACM Conference on Computer Supported Cooperative Work and Social Computing. Vancouver, Canada, CSCW ’15, pages 700–711.
Suzan Burton and Alena Soboleva. 2011. Interactive or reactive? Marketing with Twitter. Journal of Con-sumer Marketing28(7):491–499.
Iv´an Castro, Sebasti´an Oliva, Jos´e Abreu, Claudia Mart´ınez, and Yoan Guti´errez. 2017. UCSC-NLP at SemEval-2017 Task 4: Sense n-grams for sentiment analysis in Twitter. InProceedings of the 11th In-ternational Workshop on Semantic Evaluation. Van-couver, Canada, SemEval ’17, pages 806–810.
Mathieu Cliche. 2017. BB twtr at SemEval-2017 Task 4: Twitter Sentiment Analysis with CNNs and LSTMs. InProceedings of the 11th Interna-tional Workshop on Semantic Evaluation. Vancou-ver, Canada, SemEval ’17, pages 572–579.
Angel Deborah, Milton Rajendram, and T. Mirnali-nee. 2017. SSN MLRG1 at SemEval-2017 Task 4: Sentiment Analysis in Twitter Using Multi-Kernel Gaussian Process Classifier . InProceedings of the 11th International Workshop on Semantic Evalua-tion. Vancouver, Canada, SemEval ’17.
Amit Ajit Deshmane and Jasper Friedrichs. 2017. TSA-INF at SemEval-2017 Task 4: An ensemble of deep learning architectures including lexicon fea-tures for Twitter sentiment analysis. In Proceed-ings of the 11th International Workshop on Seman-tic Evaluation. Vancouver, Canada, SemEval ’17, pages 801–805.
Peter S. Dodds, Kameron D. Harris, Isabel M. Kloumann, Catherine A. Bliss, and Christopher M. Danforth. 2011. Temporal patterns of happiness and information in a global social network: Hedonomet-rics and Twitter.PLoS ONE6(12).
Enkhzol Dovdon and Jos´e Saias. 2017. ej-sa-2017 at SemEval-2017 Task 4: Experiments for target ori-ented sentiment analysis in Twitter. In Proceed-ings of the 11th International Workshop on Seman-tic Evaluation. Vancouver, Canada, SemEval ’17, pages 643–646.
Mohamed Elarnaoty, Samir AbdelRahman, and Aly Fahmy. 2012. A machine learning approach for opinion holder extraction in Arabic language.arXiv preprint arXiv:1206.1011.
Andrea Esuli and Fabrizio Sebastiani. 2010. Sentiment quantification. IEEE Intelligent Systems25(4):72– 75.
Andrea Esuli and Fabrizio Sebastiani. 2015. Opti-mizing text quantifiers for multivariate loss func-tions. ACM Transactions on Knowledge Discovery and Data9(4):Article 27.
Noura Farra and Kathleen McKeown. 2017. SMAR-Ties: Sentiment models for Arabic target entities. In Proceedings of the 15th Conference of the European Chapter of the Association for Computational Lin-guistics. Valencia, Spain, EACL ’17.
Noura Farra, Kathy McKeown, and Nizar Habash. 2015. Annotating targets of opinions in Arabic us-ing crowdsourcus-ing. InProceedings of the Second Workshop on Arabic Natural Language Processing. Beijing, China, ANLP ’17, pages 89–98.
George Forman. 2005. Counting positives accurately despite inaccurate classification. InProceedings of the 16th European Conference on Machine Learn-ing. Porto, Portugal, ECML ’05, pages 564–575.
George Forman. 2008. Quantifying counts and costs via classification. Data Mining and Knowledge Dis-covery17(2):164–206.
Aniruddha Ghosh, Guofu Li, Tony Veale, Paolo Rosso, Ekaterina Shutova, John Barnden, and Antonio Reyes. 2015. SemEval-2015 Task 11: Sentiment analysis of figurative language in Twitter. In Pro-ceedings of the 9th International Workshop on Se-mantic Evaluation. Denver, Colorado, USA, Se-mEval ’15, pages 470–478.
Jos´e ´Angel Gonz´alez, Ferran Pla, and Llu´ıs-F Hurtado. 2017. ELiRF-UPV at SemEval-2017 Task 4: Sen-timent Analysis using Deep Learning. In Proceed-ings of the 11th International Workshop on Seman-tic Evaluation. Vancouver, Canada, SemEval ’17, pages 722–726.
Raj Kumar Gupta and Yinping Yang. 2017. Crys-talNest at SemEval-2017 Task 4: Using sarcasm de-tection for enhancing sentiment classification and quantification. InProceedings of the 11th Interna-tional Workshop on Semantic Evaluation. Vancou-ver, Canada, SemEval ’17, pages 625–632.
Hussam Hamdan. 2017. Senti17 at SemEval-2017 Task 4: Ten convolutional neural network voters for tweet polarity classification. InProceedings of the 11th International Workshop on Semantic Evalua-tion. Vancouver, Canada, SemEval ’17, pages 699– 702.
Yazhou Hao, YangYang Lan, Yufei Li, and Chen Li. 2017. XJSA at SemEval-2017 Task 4: A deep system for sentiment classification in Twitter. In Proceedings of the 11th International Workshop on Semantic Evaluation. Vancouver, Canada, Se-mEval ’17, pages 727–730.
Dirk Hovy. 2015. Demographic factors improve classification performance. InProceedings of the 53rd Annual Meeting of the Association for Com-putational Linguistics and the 7th International Joint Conference on Natural Language Processing (Volume 1: Long Papers). Beijing, China, ACL-IJCNLP ’17, pages 752–762.
Amal Htait, S´ebastien Fournier, and Patrice Bellot. 2017. LSIS at SemEval-2017 Task 4: Using adapted sentiment similarity seed words for English and Ara-bic tweet polarity classification. InProceedings of the 11th International Workshop on Semantic Evalu-ation. Vancouver, Canada, SemEval ’17, pages 717– 721.
Mohammed Jabreel and Antonio Moreno. 2017. SiTAKA at SemEval-2017 Task 4: Sentiment anal-ysis in Twitter based on a rich set of features. InProceedings of the 11th International Workshop on Semantic Evaluation. Vancouver, Canada, Se-mEval ’17, pages 693–698.
Salud Mar´ıa Jim´enez-Zafra, Arturo Montejo-R´aez, M. Teresa Mart´ın-Valdivia, and L. Alfonso Ure˜na L´opez. 2017. SINAI at SemEval-2017 Task 4: User based classification. InProceedings of the 11th In-ternational Workshop on Semantic Evaluation. Van-couver, Canada, SemEval ’17, pages 633–638. Nikolay Karpov. 2017. NRU-HSE at SemEval-2017
Task 4: Tweet quantification using deep learning architecture. In Proceedings of the 11th Interna-tional Workshop on Semantic Evaluation. Vancou-ver, Canada, SemEval ’17, pages 682–687.
Mesut Kaya, Guven Fidan, and Ismail Hakki Toroslu. 2013. Transfer learning using Twitter data for im-proving sentiment classification of Turkish politi-cal news. InProceedings of the 28th International Symposium on Computer and Information Sciences. Paris, France, ISCIS ’13, pages 139–148.
Svetlana Kiritchenko, Saif Mohammad, and Moham-mad Salameh. 2016. SemEval-2016 Task 7: De-termining sentiment intensity of English and Arabic phrases. InProceedings of the 10th International Workshop on Semantic Evaluation. San Diego, Cal-ifornia, USA, SemEval ’16, pages 42–51.
Seman-tic Evaluation. Vancouver, Canada, SemEval ’17, pages 674–681.
Quanzhi Li, Armineh Nourbakhsh, Xiaomo Liu, Rui Fang, and Sameena Shah. 2017. funSentiment at SemEval-2017 Task 4: Topic-based message senti-ment classification by exploiting word embeddings, text features and target contexts. InProceedings of the 11th International Workshop on Semantic Evalu-ation. Vancouver, Canada, SemEval ’17, pages 740– 745.
David Lozi´c, Doria ˘Sari´c, Ivan Toki´c, Zoran Medi´c, and Jan ˘Snajder. 2017. TakeLab at SemEval-2017 Task 4: Recent deaths and the power of nostalgia in sentiment analysis in Twitter. InProceedings of the 11th International Workshop on Semantic Evalua-tion. Vancouver, Canada, SemEval ’17, pages 783– 788.
Wang Maoquan, Chen Shiyun, Xie Yufei, and Zhao Lu. 2017. EICA at SemEval-2017 Task 4: A simple convolutional neural network for topic-based senti-ment classification. InProceedings of the 11th In-ternational Workshop on Semantic Evaluation. Van-couver, Canada, SemEval ’17, pages 293–299. Micol Marchetti-Bowick and Nathanael Chambers.
2012. Learning for microblogs with distant supervi-sion: Political forecasting with Twitter. In Proceed-ings of the 13th Conference of the European Chap-ter of the Association for Computational Linguistics. Avignon, France, EACL ’12, pages 603–612. Sabino Miranda-Jim´enez, Mario Graff, Eric
Sa-dit Tellez, and Daniela Moctezuma. 2017. IN-GEOTEC at SemEval 2017 Task 4: A B4MSA en-semble based on genetic programming for Twitter sentiment analysis. InProceedings of the 11th In-ternational Workshop on Semantic Evaluation. Van-couver, Canada, SemEval ’17, pages 770–775. Alan Mislove, Sune Lehmann, Yong-Yeol Ahn,
Jukka-Pekka Onnela, and J Niels Rosenquist. 2011. Un-derstanding the demographics of Twitter users. In Proceedings of the 9th AAAI International Confer-ence on Web and Social Media. Barcelona, Spain, ICWSM ’11, pages 554–557.
Saif Mohammad, Svetlana Kiritchenko, Parinaz Sob-hani, Xiao-Dan Zhu, and Colin Cherry. 2016a. SemEval-2016 Task 6: Detecting stance in tweets. InProceedings of the 10th International Workshop on Semantic Evaluation. San Diego, California, USA, SemEval ’16, pages 31–41.
Saif M Mohammad, Mohammad Salameh, and Svet-lana Kiritchenko. 2016b. How translation alters sen-timent.J. Artif. Intell. Res.(JAIR)55:95–130. Ahmed Mourad and Kareem Darwish. 2013.
Sub-jectivity and sentiment analysis of modern standard Arabic and Arabic microblogs. InProceedings of the 4th workshop on computational approaches to subjectivity, sentiment and social media analysis. Atlanta, Georgia, USA, WASSA ’13, pages 55–64.
Hala Mulki, Hatem Haddad, Mourad Gridach, and Is-mail Babaolu. 2017. Tw-StAR at SemEval-2017 Task 4: Sentiment classification of Arabic tweets. InProceedings of the 11th International Workshop on Semantic Evaluation. Vancouver, Canada, Se-mEval ’17, pages 663–668.
Preslav Nakov, Alan Ritter, Sara Rosenthal, Fabrizio Sebastiani, and Veselin Stoyanov. 2016a. SemEval-2016 task 4: Sentiment analysis in Twitter. In Pro-ceedings of the 10th International Workshop on Se-mantic Evaluation. San Diego, California, USA, Se-mEval ’16, pages 1–18.
Preslav Nakov, Sara Rosenthal, Svetlana Kiritchenko, Saif M. Mohammad, Zornitsa Kozareva, Alan Ritter, Veselin Stoyanov, and Xiaodan Zhu. 2016b. Devel-oping a successful SemEval task in sentiment anal-ysis of Twitter and other social media texts. Lan-guage Resources and Evaluation50(1):35–65. Preslav Nakov, Sara Rosenthal, Zornitsa Kozareva,
Veselin Stoyanov, Alan Ritter, and Theresa Wilson. 2013. SemEval-2013 Task 2: Sentiment analysis in Twitter. InProceedings of the 7th International Workshop on Semantic Evaluation. Atlanta, Geor-gia, USA, SemEval ’13, pages 312–320.
Dong Nguyen, Rilana Gravel, Dolf Trieschnigg, and Theo Meder. 2013. “How old do you think I am?” A study of language and age in Twitter. In Proceed-ings of the Seventh International Conference on We-blogs and Social Media. Cambridge, Massachusetts, USA, ICWSM ’13, pages 439–448.
Brendan O’Connor, Ramnath Balasubramanyan, Bryan R. Routledge, and Noah A. Smith. 2010. From tweets to polls: Linking text sentiment to public opinion time series. In Proceedings of the Fourth International Conference on Weblogs and Social Media. Washington, DC, USA, ICWSM ’10, pages 122–129.
Chukwuyem Onyibe and Nizar Habash. 2017. OMAM at SemEval-2017 Task 4: English sentiment analysis with conditional random fields. InProceedings of the 11th International Workshop on Semantic Evalu-ation. Vancouver, Canada, SemEval ’17, pages 669– 673.
analysis. In Proceedings of the 9th International Workshop on Semantic Evaluation. Denver, Col-orado, USA, SemEval ’15, pages 486–495.
Maria Pontiki, Dimitris Galanis, John Pavlopoulos, Harris Papageorgiou, Ion Androutsopoulos, and Suresh Manandhar. 2014. SemEval-2014 Task 4: Aspect based sentiment analysis. InProceedings of the 8th International Workshop on Semantic Evalu-ation. Dublin, Ireland, SemEval ’14, pages 27–35.
Muhammad A. Qureshi, Colm O’Riordan, and Gabriella Pasi. 2013. Clustering with error esti-mation for monitoring reputation of companies on Twitter. In Proceedings of the 9th Asia Infor-mation Retrieval Societies Conference. Singapore, AIRS ’13, pages 170–180.
Eshrag Refaee and Verena Rieser. 2014. Subjectiv-ity and sentiment analysis of Arabic Twitter feeds with limited resources. InWorkshop on Free/Open-Source Arabic Corpora and Corpora Processing Tools. Reykjavik, Iceland, pages 16–21.
Eshrag Refaee and Verena Rieser. 2015. Benchmark-ing machine translated sentiment analysis for Ara-bic tweets. InProceedings of the 2015 Conference of the North American Chapter of the Association for Computational Linguistics: Human Language Technologies. Denver, Colorado, USA, NAACL-HLT ’15, pages 71–78.
Sara Rosenthal and Kathy McKeown. 2016. Social proof: The impact of author traits on influence detection. In Proceedings of the First Workshop on NLP and Computational Social Science. Austin, Texas, USA, pages 27–36.
Sara Rosenthal, Preslav Nakov, Svetlana Kiritchenko, Saif Mohammad, Alan Ritter, and Veselin Stoyanov. 2015. SemEval-2015 Task 10: Sentiment analy-sis in Twitter. In Proceedings of the 9th Interna-tional Workshop on Semantic Evaluation. Denver, Colorado, USA, SemEval ’15, pages 451–463.
Sara Rosenthal, Alan Ritter, Preslav Nakov, and Veselin Stoyanov. 2014. SemEval-2014 task 9: Sen-timent analysis in Twitter. In Proceedings of the 8th International Workshop on Semantic Evaluation. Dublin, Ireland, SemEval ’14, pages 73–80.
Mickael Rouvier. 2017. LIA at SemEval-2017 Task 4: An ensemble of neural networks for sentiment classification. InProceedings of the 11th Interna-tional Workshop on Semantic Evaluation. Vancou-ver, Canada, SemEval ’17, pages 759–764.
Alon Rozental and Daniel Fleischer. 2017. Amobee at SemEval-2017 Task 4: Deep learning system for sentiment detection on Twitter. InProceedings of the 11th International Workshop on Semantic Evalu-ation. Vancouver, Canada, SemEval ’17, pages 652– 657.
Yossi Rubner, Carlo Tomasi, and Leonidas J. Guibas. 2000. The Earth Mover’s Distance as a metric for image retrieval. International Journal of Computer Vision40(2):99–121.
Ludger R¨uschendorf. 2001. Wasserstein metric. In Michiel Hazewinkel, editor,Encyclopaedia of Math-ematics, Kluwer Academic Publishers, Dordrecht, Netherlands.
Irene Russo, Tommaso Caselli, and Carlo Strapparava. 2015. SemEval-2015 Task 9: CLIPEval implicit po-larity of events. In Proceedings of the 9th Inter-national Workshop on Semantic Evaluation. Denver, Colorado, USA, SemEval ’15, pages 443–450. Mohammad Salameh, Saif Mohammad, and Svetlana
Kiritchenko. 2015. Sentiment after translation: A case-study on Arabic social media posts. In Pro-ceedings of the 2015 Conference of the North Amer-ican Chapter of the Association for Computational Linguistics: Human Language Technologies. Den-ver, Colorado, USA, NAACL-HLT ’15, pages 767– 777.
Abeed Sarker and Graciela Gonzalez. 2017. HLP@UPenn at SemEval-2017 Task 4A: A simple, self-optimizing text classification system combining dense and sparse vectors. InProceedings of the 11th International Workshop on Semantic Evaluation. Vancouver, Canada, SemEval ’17, pages 639–642.
Fabrizio Sebastiani. 2015. An axiomatically de-rived measure for the evaluation of classification algorithms. In Proceedings of the 2015 Interna-tional Conference on The Theory of Information Retrieval. Northampton, Massachusetts, USA, IC-TIR ’15, pages 11–20.
Carlo Strapparava and Rada Mihalcea. 2007. SemEval-2007 Task 14: Affective text. In Proceedings of the Fourth International Workshop on Semantic Evaluations. Prague, Czech Republic, SemEval ’07, pages 70–74.
Symeon Symeonidis, Dimitrios Effrosynidis, John Ko-rdonis, and Avi Arampatzis. 2017. DUTH at SemEval-2017 Task 4: A voting classification ap-proach for Twitter sentiment analysis. In Proceed-ings of the 11th International Workshop on Seman-tic Evaluation. Vancouver, Canada, SemEval ’17, pages 703–707.
Raphael Troncy, Enrico Palumbo, Efstratios Sygk-ounas, and Giuseppe Rizzo. 2017. SentiME++ at SemEval-2017 Task 4: Stacking state-of-the-art classifiers to enhance sentiment classification. InProceedings of the 11th International Workshop on Semantic Evaluation. Vancouver, Canada, Se-mEval ’17, pages 647–651.
Conference on Computational Linguistics: Techni-cal Papers. Dublin, Ireland, COLING ’14, pages 2345–2354.
Svitlana Volkova, Theresa Wilson, and David Yarowsky. 2013. Exploring demographic lan-guage variations to improve multilingual sentiment analysis in social media. In Proceedings of the Conference on Empirical Methods in Natural Language Processing. Seattle, Washington, USA, EMNLP ’13, pages 1815–1827.
Ming Wang, Biao Chu, Qingxun Liu, and Xiaobing Zhou. 2017. YNUDLG at SemEval-2017 Task 4: A GRU-SVM model for sentiment classification and quantification in Twitter. In Proceedings of the 11th International Workshop on Semantic Evalua-tion. Vancouver, Canada, SemEval ’17, pages 712– 716.
Tzu-Hsuan Yang, Tzu-Hsuan Tseng, and Chia-Ping Chen. 2017. deepSA at SemEval-2017 Task 4: In-terpolated deep neural networks for sentiment anal-ysis in Twitter. InProceedings of the 11th Interna-tional Workshop on Semantic Evaluation. Vancou-ver, Canada, SemEval ’17, pages 615–619.
Yi Yang and Jacob Eisenstein. 2015. Putting things in context: Community-specific embedding projec-tions for sentiment analysis.CoRRabs/1511.06052.
Yichun Yin, Yangqiu Song, and Ming Zhang. 2017. NNEMBs at SemEval-2017 Task 4: Neural Twitter sentiment classification: a simple ensemble method with different embeddings. In Proceedings of the 11th International Workshop on Semantic Evalua-tion. Vancouver, Canada, SemEval ’17, pages 620– 624.
Joosung Yoon, Hyeoncheol Kim, and Kigon Lyu. 2017. Adullam at SemEval-2017 Task 4: Sentiment an-alyzer using lexicon integrated convolutional neu-ral networks with attention. InProceedings of the 11th International Workshop on Semantic Evalua-tion. Vancouver, Canada, SemEval ’17, pages 731– 735.
Haowei Zhang, Jin Wang, Jixian Zhang, and Xuejie Zhang. 2017. YNU-HPCC at SemEval 2017 Task 4: Using a multi-channel CNN-LSTM model for senti-ment classification. InProceedings of the 11th In-ternational Workshop on Semantic Evaluation. Van-couver, Canada, SemEval ’17, pages 795–800.
Jingjing Zhao, Yan Yang, and Bing Xu. 2017. MI&T Lab at SemEval-2017 Task 4: An integrated train-ing method of word vector for sentiment classifica-tion. InProceedings of the 11th International Work-shop on Semantic Evaluation. Vancouver, Canada, SemEval ’17, pages 688–692.
Yunxiao Zhou, Man Lan, and Yuanbin Wu. 2017. ECNU at SemEval-2017 Task 4: Evaluating ef-fective features on machine learning methods for