SINAI at SemEval-2017 Task 4: User based classification
Salud Mar´ıa Jim´enez-Zafra, Arturo Montejo-R´aez, M. Teresa Mart´ın-Valdivia, L. Alfonso Ure˜na-L´opez Computer Science Department, Escuela Polit´ecnica Superior de Ja´en
Universidad de Ja´en, 23071 - Ja´en (Spain)
{sjzafra, amontejo, maite, laurena}@ujaen.es
Abstract
This document describes our participation in SemEval-2017 Task 4: Sentiment Anal-ysis in Twitter. We have only reported results for subtask B - English, deter-mining the polarity towards a topic on a two point scale (positive or negative senti-ment). Our main contribution is the inte-gration of user information in the classifi-cation process. A SVM model is trained with Word2Vec vectors from user’s tweets extracted from his timeline. The obtained results show that user-specific classifiers trained on tweets from user timeline can introduce noise as they are error prone be-cause they are classified by an imperfect system. This encourages us to explore further integration of user information for author-based Sentiment Analysis.
1 Introduction
Task 4 of SemEval 2017, Sentiment Analysis in Twitter (Rosenthal et al.,2017), has included some new subtasks this year. One of these subtasks con-siders user information to be also integrated in pro-posed systems. We have participated in subtask B consisting of, given a message and a topic, clas-sify the message on a two-point scale (positive or negative sentiment towards that topic). Actually, organizers provide scripts to download user pro-file information such as age, location, followers... We have taken advantage of this information to ex-pand a SVM model trained with Word2Vec vec-tors from user publications on this social media.
In this paper, we present our approach to clas-sify tweets in a two point scale (positive and negative) by combining Support Vector Machine (SVM), Word2Vec (Mikolov et al., 2013) and user information. We have decided to combine
these technologies for several reasons. Firstly, we have applied SVM many different tasks includ-ing tweet polarity classification with good results (Saleh et al., 2011). Secondly, after a revision of the systems presented in the last year for the same task (Nakov et al., 2016), it seems that bet-ter results are achieved by using word embeddings representations, so we have decided to test how it works on user modeling. Finally, this year for the first time, organizers include user information. We consider that it is very interesting to integrate this contextual information to improve tweets sen-timent classification. Actually, polarity classifi-cation on a per-user basis has been found to be useful in tasks like collaborative filtering ( Garc´ıa-Cumbreras et al.,2013). Besides, the generation of user profiles in Twitter has attracted the atten-tion of many researches in recent years, enabling the prediction of user behavior as in election pro-cesses (Pennacchiotti and Popescu,2011).
In Section 2 we explain the data used in our ap-proach. Section 3 presents the system description. Experiments and results are expounded in Section 4 and they are analyzed in Section 5. Finally, in Section 6, conclusions and future work are com-mented.
2 Data
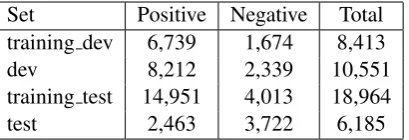
The organizers provided English data from pre-vious years (2015 and 2016). The test set cor-responding to 2016 was also supplied for devel-opment purposes but, since then, it can be used for training too. In the experimentation phase, the training set is composed by the development, training and test datasets of 2015 and the develop-ment and training datasets of 2016. For our partic-ipation in task 4 we used all this data for training. In Table1, it can be seen the distribution of tweets used in the experimentation and testing phases.
Set Positive Negative Total training dev 6,739 1,674 8,413
dev 8,212 2,339 10,551
training test 14,951 4,013 18,964
[image:2.595.80.285.62.132.2]test 2,463 3,722 6,185
Table 1: Number of tweets provided for experi-mentation and testing.
3 System description
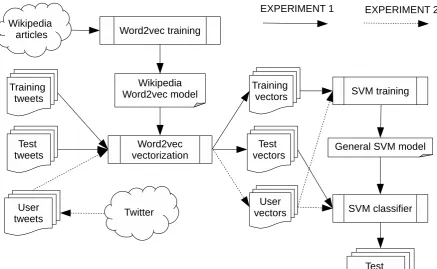
The system presented is based on user modeling. It determines the user opinion on a tweet accord-ing to a user model generated from his timeline. In our experiments, all tweets are vectorized using Word2Vec. First, a general SVM model on train-ing vectors is generated. Then, for each user in the test set, the system downloads the last 200 tweets published by the user and classifies them using a general SVM classifier, the one resulting from the training set. If the classified tweets from the time-line contains positive and negative tweets and an specific SVM model of the timeline reports an ac-curacy over 0.7 on leave-one-out cross-validation, the user model is applied on authored tweets from the test set; if not, the general SVM model is ap-plied. Thus, we try to train a per-user classifier, whenever feasible.
For the Word2Vec representation of the tweets, it has been used the software1 developed by the
authors of the method (Mikolov et al.,2013). In order to get representative vectors for each word, it is needed to generate a model from a large text volume. To this end, a Wikipedia2 dump in
En-glish of the articles in XML was downloaded, and the text from them was extracted. The parame-ters used have been those that provided better re-sults in previous experiments with Spanish tweets (Montejo-R´aez and Dıaz-Galiano,2016; Montejo-R´aez et al., 2014): a window of 5 terms, the CBOW model and a number of dimensions ex-pected of 300. In this way, each tweet of the training and test set has been represented with the resultant vector of calculating the average and standard deviation of the Word2Vec vectors from words in the tweet text, resulting in a final vector of 600 features. Previously, a simple normaliza-tion has been performed on each tweet: repeated letters have been eliminated, stop words have been
1https://code.google.com/p/Word2Vec/ 2https://dumps.wikimedia.org/enwiki/
removed and all words have been transformed to lowercase.
The SVM implementation selected is that based on LibSVM (Chang and Lin, 2011) provided by the Scikit-learn library (Pedregosa et al.,2011). 4 Experiments and results
Three different experiments were conducted over the development set as follows (Fig.1and Fig.2): • Experiment 1: a general SVM model on Word2Vec representations of training tweets was generated. Each tweet of the develop-ment set was vectorized using Word2Vec and classified with the model obtained previously. • Experiment 2: each tweet vector was ex-panded with a user vector. A general SVM model was also generated, but on both the Word2Vec representation of the training tweets and user timeline. For every user in the training tweets, the last 200 tweets from his timeline were downloaded. These tweets were used to enrich the vector of each in-dividual tweet. Each tweet of the develop-ment set along with user timeline who posted it were vectorized using Word2Vec and the tweet was classified with the model.
• Experiment 3: the general SVM model of ex-periment 1 was used but one model per user was also defined. In order to define the user model, the last 200 tweets published by the user were retrieved and each of them was vec-torized and classified using the general SVM model. Each tweet of the development set was vectorized using Word2Vec and classi-fied according to the following approach: if the model corresponding to the user contains positive and negative tweets and the leave-one-out cross-validation reports an accuracy over 0.7%, the tweet is classified with the user model; if not, it is classified with the general SVM model.
Figure 1: Data flow for experiment 1 and 2.
Exp 1 Exp 2 Exp 3 P positive 0.856 0.854 0.842 P negative 0.764 0.757 0.772 R positive 0.962 0.962 0.970 R negative 0.432 0.422 0.363 Avg. F1 0.729 0.723 0.698 Avg. R 0.697 0.692 0.666 Acc. 0.845 0.842 0.835
Table 2: Results for the development phase.
# System AvgR AvgF1 Acc
1 BB twtr 0.8821 0.8901 0.8971
2 DataStories 0.8562 0.8612 0.8692
3 Tweester 0.8543 0.8563 0.8633
4 TopicThunder 0.8464 0.8474 0.8544
5 TakeLab 0.8455 0.8365 0.8406
6 funSentiment 0.8346 0.8248 0.8278
7 YNU-HPCC 0.8346 0.81610 0.81810
8 WarwickDCS 0.8298 0.8346 0.8435
9 CrystalNest 0.8279 0.8229 0.8278
10 zhangweida2080 0.82610 0.8307 0.8387
11 Amobee-C-137 0.82211 0.80112 0.80212
12 SINAI 0.81812 0.80611 0.80911
13 NRU-HSE 0.79813 0.78713 0.79013
14 EICA 0.79014 0.77514 0.77716
15 OMAM 0.77915 0.76217 0.76417
16 NileTMRG 0.76916 0.77415 0.78915
17 ELiRF-UPV 0.76617 0.77316 0.79013
18 DUTH 0.66318 0.60018 0.60718
19 ej-za-2017 0.59419 0.48621 0.51819
20 SSN MLRG1 0.58620 0.49420 0.51819
21 YNU-1510 0.51621 0.49919 0.49921
22 TM-Gist 0.49922 0.42822 0.44422
23 SSK JNTUH 0.48323 0.37223 0.41223
[image:4.595.153.443.205.528.2]baseline 1: all POSITIVE 0.500 0.285 0.398 baseline 2: all NEGATIVE 0.500 0.376 0.602 Table 3: Results for SemEval-2017 Task 4, subtask B - English.
3 in the development phase, but we did not select it because we considered that the fact of adding tweets without more sense was not a good idea. Experiment 3 makes more sense, since it defines a personal model for each user based on the way he thinks.
The results for all participants in the test phase can be seen in Table3and the detailed report of the results for all participants can be found at ( Rosen-thal et al.,2017).
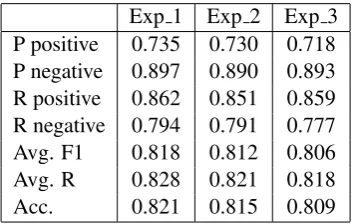
Once the gold standard corresponding to the test phase was released, we also conducted other experiments that we defined in the development phase. The results related to the test set in all the
experiments are shown in Table4. Following, in the next section, an in-depth analysis of the results obtained is performed.
[image:4.595.327.504.626.738.2]5 Analysis of results
The results obtained do not seem to support the integration of content from users’ timelines. In Table 4 we can see that using word embeddings in tweet words straightforward yielded the best re-sults. Adding further user information did not im-prove the first setup. A model of the user under the form of an aggregated vector computed from his timeline, or a specific polarity classifier for each user involves, first, to download hundreds of tweets for every single user in the data set and, second, use these tweets to compute a final user model.
It is important to note that the SemEval data set is very unbalanced, and that can affect the gener-ation of user classifiers. Besides, not additional data has been used to determine the polarity of tweets in the timeline, so the effects of a bad per-formance might be, therefore, amplified. Anyhow, experiment 3 shows similar results as the other two approaches, despite the potential bias that recent tweets from the timeline may have on the classifi-cation process.
6 Conclusion
Working on timelines has been found interesting as a source of information to generate user pro-files (Bollen et al.,2011). Actually, as more text is obtained, further analysis on user behavior or personality can be performed (Diakopoulos and Shamma,2010).
We will continue exploring how the timeline could be better integrated or analyzed for an ef-fective user modeling process. As the timeline is provided on recent tweets, it could be worth down-loading those closer to the moment when the tweet to analyze was published, so the context would be more coherent.
Acknowledgments
This work has been partially supported by a Grant from the Ministerio de Educaci´on, Cultura y Deporte (MECD - scholarship FPU014/00983), Fondo Europeo de Desarrollo Regional (FEDER) and REDES project (TIN2015-65136-C2-1-R) from the Ministerio de Econom´ıa y Competitivi-dad.
References
Johan Bollen, Huina Mao, and Alberto Pepe. 2011. Modeling public mood and emotion: Twitter
sen-timent and socio-economic phenomena. ICWSM
11:450–453.
Chih-Chung Chang and Chih-Jen Lin. 2011. Libsvm: a
library for support vector machines. ACM
Transac-tions on Intelligent Systems and Technology (TIST)
2(3):27.
Nicholas A. Diakopoulos and David A. Shamma.
2010. Characterizing debate performance via
aggregated twitter sentiment. In Proceed-ings of the SIGCHI Conference on Human Factors in Computing Systems. ACM, New York, NY, USA, CHI ’10, pages 1195–1198.
https://doi.org/10.1145/1753326.1753504.
Miguel ´A. Garc´ıa-Cumbreras, Arturo Montejo-R´aez, and Manuel C. D´ıaz-Galiano. 2013. Pessimists and optimists: Improving collaborative filtering through
sentiment analysis. Expert Systems with
Applica-tions40(17):6758 – 6765.
Tomas Mikolov, Kai Chen, Greg Corrado, and
Jef-frey Dean. 2013. Efficient estimation of word
representations in vector space. arXiv preprint
arXiv:1301.3781.
A Montejo-R´aez and MC Dıaz-Galiano. 2016. Partic-ipaci´on de sinai en tass 2016. Comit´e organizador
page 41.
Arturo Montejo-R´aez, MA Garc´ıa-Cumbreras, and M Carlos D´ıaz-Galiano. 2014. Participaci´on de sinai
word2vec en tass 2014. InProceedings of the TASS
workshop at SEPLN.
Preslav Nakov, Alan Ritter, Sara Rosenthal, Fabrizio Sebastiani, and Veselin Stoyanov. 2016. Semeval-2016 task 4: Sentiment analysis in twitter. Proceed-ings of SemEvalpages 1–18.
Fabian Pedregosa, Ga¨el Varoquaux, Alexandre Gram-fort, Vincent Michel, Bertrand Thirion, Olivier Grisel, Mathieu Blondel, Peter Prettenhofer, Ron Weiss, Vincent Dubourg, et al. 2011. Scikit-learn:
Machine learning in python. Journal of Machine
Learning Research12(Oct):2825–2830.
Marco Pennacchiotti and Ana-Maria Popescu. 2011. A machine learning approach to twitter user
classifica-tion. Icwsm11(1):281–288.
Sara Rosenthal, Noura Farra, and Preslav Nakov. 2017. SemEval-2017 task 4: Sentiment analysis in Twit-ter. InProceedings of the 11th International Work-shop on Semantic Evaluation. Association for Com-putational Linguistics, Vancouver, Canada, SemEval ’17.
Experiments with svm to classify opinions in
dif-ferent domains. Expert Systems with Applications