ISOLATION, STRUCTURAL ELUCIDATION AND BIOLOGICAL
ACTIVITY OF THE FLAVONOID FROM THE BARKS OF
JUNIPERUS PHOENICEA
Kutaiba Ibrahim Alzanda*, Mohamed Ali Abdullahb, Mukul Tailangc
a
Department of Chemistry, Faculty of Science, Raparin University, Rania, Kurdistan-Iraq. b
President of Raparin University, Rania,Kurdistan- Iraq. c
S.O.S. in Pharmaceutical Sciences, Jiwaji University, Gwalior (M.P.) INDIA.
ABSTRACT
New flavonoid (1) was isolated from ethanol extract of the barks of Juniperus phoenicea by preparative thin-layer chromatography technique. The barks alcoholic extract of J. phoenicea dose dependently inhibited the growth of Escherichia coli, Staphylococcus aureus and Klebsiella pneumoniae. The structure of compound 1 was elucidated on the basis of MS, IR, UV, 1H NMR and 13C NMR spectroscopic data, including 2D NMR experiments to be 1-[2,4- dihydroxy-3-(2-hydroxy-3-methyl-3-butenyl)-6-methoxyphenyl]-3-(4-hydroxyphenyl)-2-propen-1-one.
KEYWORDS: Isolation, Structural Elucidation, Phytochemical,
Flavonoids, Juniperus Phoenicea.
INTRODUCTION
Flavonoids are best known as the red, blue and purple pigments of flowering plants (due to the anthocyanidin sub-group) although the red pigment of some fruits can be due to carotenoids such as lycopene. [1] These pigments and the yellow pigments of flavones and flavanols are also responsible for the fall leaves coloration. [2] Because of the importance of color in pollinator attraction, flavonoids have an important role in plant reproduction. Flavonoids in plants also serve to protect from ultraviolet (UV) light owing to their high UV absorbance coefficients, and it has been suggested that this property of flavonoids was critical in the evolution of aquatic plants to a terrestrial existence. [3] Flavonoids also possess other
Volume 3, Issue 10, 966-980. Research Article ISSN 2277– 7105
Article Received on 30 September 2014,
Revised on 25 Oct 2014, Accepted on 20 Nov 2014
*Correspondence for
Author
Kutaiba Ibrahim
Alzanda
Department of
Chemistry, Faculty of
Science, Raparin
University, Rania,
critical functions in defense against microorganisms and germination of pollen. [4,5] Each group of flavonoids possesses unique chemical properties and has a particular distribution in plants. Anthocyanins (glycosylated anthocyanidins) and proanthocyanidins (polymers that produce anthocyanidins when hydrolyzed) primarily provide color to flowering plants and fruit, and are therefore found in high concentrations in the skin of red grapes, red wine and berries.
Flavan-3-ols, such as catechin, epicatechin gallate are colorless and are found in high concentrations in green tea. Isoflavones are only found in legumes (e.g. soy) and are therefore consumed in high quantities in regions of the world with high soy consumption. Flavanones are found in high levels in citrus fruits, while flavones are present in green leafy spices such as parsley, and flavonols are ubiquitous and found in most fruits and vegetables consumed in the human diet. [6] Juniperus phoenicea is small tree grows up to 10 m in height. Juniper berries have long been used as flavoring agents in foods. Oil of Juniper is used for catgut ligatures, diuretic, carminative, steam inhalant in the management of bronchitis and to control arthritis. Juniper has been used in phytotherapy and cosmetics in the eastern Mediterranean region. [7] Reported therapeutic uses of juniper include juniper baths for the treatment of neurasthenic neurosis [8] and management of scalp psoriasis [9] In our search for structurally and biological interesting compounds from plants found in Rania, Kurdistan-Iraq, new flavonoids (1), was isolated from the barks of Juniperus phoenicea. We report here the isolation and structural elucidation of this compounds (1) and the inhibitory activity of the plant extract against some clinical isolated bacteria (Escherichia coli, Staphylococcus aureus and Klebsiella pneumoniae). The structure of compound (1) was characterized by MS, IR, UV, 1H and 13C NMR spectroscopy, including 2D NMR experiments.
O O OH OH -O HO O OH O O -O HO OH O O C
O- O
O C O O -O HO HO +
[M-H]- m/z 369 [M-H]- m/z 369 A
Experimental
General Experimental Procedures
All melting points were determined on a Yanaco micromelting point apparatus and are uncorrected. UV spectra (Shimadzu UV-1203) were recorded in MeOH, whereas IR spectra (Nicolet 510P FT-IR) were obtained as a KBr disk film. 1H NMR (Bruker AM-500, 500 MHz) and 13C NMR (Bruker AC-200, 75 MHz) spectra were acquired in MeOH-d4 with TMS as internal standard, whereas EIMS (Shimadzu QP-5000/Gc-17A/DI-50) and HREIMS (VG-ZAB-VSEQ) were recorded at 70 eV (ionizing potential) using a direct inlet system. To monitor the preparative separations, analytical thin-layer chromatography (TLC) was performed at room temperature on pre-coated 0.25 mm thick silica gel 60 F254 glass plates (20 x 20 cm). Chromatograms were visualized after drying (i) by UV light and (ii) by a phenol specific spray reagent, FeCl3 (3% in dry ethanol). All other chemicals and reagents were analytical grade.
MATERIALS AND METHODS
Plant Material: Barks of Juniperus phoenicea were collected from Rania (Kursistan-Iraq), in February 2014. The plant was identified by the Botany Department, Sulaimania University, and voucher specimens were deposited in the herbarium of that Department. The plant sample was air-dried and ground into uniform powder using a Thomas-Willey milling machine.
Phytochemical Screening
Chemical tests were carried out on the aqueous and alcoholic extracts and on the powdered specimens using standard procedures to identify the constituents as described by Sofowara 10, Trease and Evans [11] and Harborne. [12]
Preparation of Aqueous Extract. The aqueous extract was prepared by extracting 100 g of
dried powdered sample with 500 ml of distilled water for 12 h. The extracts were filtered.
Preparation of Alcoholic Extract. The alcoholic extract was prepared by extracting 100 g of
filtered. A few drops of 0.1% FeCl3 solution were added and a blue-black coloration observed in the extract indicated the presence of tannins.
Test for Steroids . Two ml of acetic anhydride were added to 0.5 g ethanolic extract of
Juniperus phoenicea with 2 ml concentrated H2S04. The color changed from violet to green indicating the presence of steroids.
Test for Flavonoids. Three methods were used to determine the presence of flavonoids in the
plant sample. Five ml of 20% NH3 solution were added to a portion of the aqueous filtrate of the plant extract followed by addition of concentrated H2S04. A yellow coloration was observed indicated the presence of flavonoids.
Few drops of 1% aluminium solution were added to a portion of the aqueous filtrate of the plant extract. A dark yellow coloration was observed indicating the presence of flavonoids. A portion of the powdered plant sample was in heated with 10 ml of ethyl acetate over a steam bath for 3 min. The mixture was filtered and 4 ml of the filtrate was shaken with 1 ml of 20% NH3 solution. A yellow coloration was observed indicating a positive test for flavonoids.
Test for Alkoloids. Five ml of 2N hydrochloric acid was added to 0.5 g ethanolic extract of
the sample and the solution was heated with stirring in a water bath for 10 minutes. The cooled solution was filtered and a few drops of Dragendorff's reagent (0.85 g of bismuth nitrate was dissolved in 10 mL acetic acid and 40 mL of water was added + 8.0 g of potassium iodide was dissolved in 20 mL water) were added to a portion of this solutions. A formation of a reddish-brown precipitates were considered as a positive test for alkaloids. Alkaloids were absent in Juniperus phoenicea.
Test for Terpenoids. Five ml of the extract was mixed with 2 ml of chloroform, and
concentrated H2S04 (3 ml) was carefully added to form a layer. A reddish brown coloration of the interface was formed in Juniperus phoenicea to show positive results for the presence of terpenoids.
Test for Saponins. About 2 g of the dried powdered sample of Juniperus phoenicea was
mixed with 3 drops of olive oil and shaken vigorously, then observed for the formation of emulsion. Sponins were absent in Juniperus phoenicea.
Biological Activities of Flavonoids
Micro-Organism. The following bacteria clinical isolates were obtained from stock culture of pathological strains, preserved at the Microbiology Laboratory, Faculty of Science, University of Raparin, Rania-Kurdistan-Iraq: Escherichia coli, Staphylococcus aureus, Klebsiella pneumoniae, and Candida albicans.
Antimicrobial Activity. The disc diffusion method as described by national committee for
clinical laboratory standards, was used to determine the growth inhibition of bacteria by the plant extract. Discs containing different concentrations (100 and 200 mg/ml) of dissolved extract were prepared using sterile Whatmann filter paper No. 1, (6 mm in diameters). The discs were dried at 50oC. Overnight cultures of each of the bacterial isolates was diluted with sterile normal saline to give inoculums size of 106 cfu/ml. Nutrient agar medium was prepared, sterilized, cooled and poured into sterile Petri dishes to a depth of 4 mm (about 25 ml per plate) to solidify. Pure cultures of the test organisms were used to inoculate the Petri dishes. This was done by spreading the inocula on the surface of the prepared nutrient agar plate using sterile cotton swabs which have been dipped in the diluted suspension of the organism. The discs were then aseptically placed evenly on the surface of the inoculation and gently pressed down to ensure contact using a pair of forceps. The plates were finally incubated at 37oC for 18–24 h. Amoxcillin (25 mg) was included in each of the inoculated plates as positive control. Plates prepared using the same procedures without extract or antibiotic were equally set as negative control. The plates were examined after 24 h for clear zone of inhibition. Antibacterial activity by the extract was measured and recorded using a pair of calipers and compared to the standard antibiotics as in this study.
Extraction and Isolation
Isolation of Flavonoids from the Barks of J. Phoenicea
Thin-Layer Chromatography of the Crude Products. Silica gel 60F254 and water were
mixed to form a slurry which was spread over clean glass plates. These plates were used without activation. Small amount of the crude product of Juniperus phoenicea was dissolved in 95% ethanol and applied as concentrated spots on silica gel plates. Many solvent systems have been employed for the separation of flavonoids using TLC. However, the solvent system that achieved the best separation was n-BuOH–HOAc–H2O, (3:1:1). Only one spot was detected by spraying with 3% solution of ferric chloride FeCl3 in ethanol.
Preparative Thin-Layer Chromatography. Small amount of the crude product of Juniperus
phoenicea was dissolved in the minimum amount of ethanol and applied on (20 x 20 cm) silica gel plates as a narrow strip. The plates were developed with the solvent system n-BuOH–HOAc–H2O, (3:1:1) and the chromatograms were located under UV light. The sole major band was scratched and the product extracted from silica gel with ethanol. After filtration, the solvent was removed in vacuo to leave a solid (compound 1).
1-[2,4-dihydroxy-3-(2-hydroxy-3-methyl-3-butenyl)-6-methoxyphenyl]-3-(4-
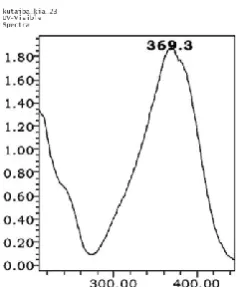
hydroxyphenyl)-2-propen-1-one: yellow crystalline needles; UV (LC-PDA) λmax 369 nm;
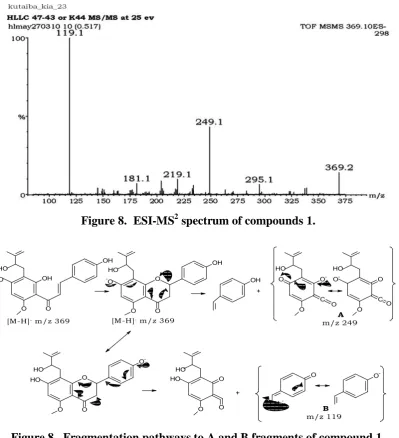
IR (film) 3375, 2952, 1622, 1525, 14769 and 1433, 1270 cm-1; NMR (360 MHz, MeOH-d4); HRESIMS [M - H]-369.1421 m/z calcd for C21H22O6 (1.8 ppm); ESIMSMS product ions m/z (% base peak) A fragment 249, B fragment 119, other product ions 295, 219, 181.
RESULTS AND DISCUSSIONT
he results of the phytochemical analysis show that, flavonoids, tannins, alkaloids and terpenoids are present in the extract. Steroids and saponins were not detected (Table 1). The extract produced a dose dependent zone of inhibition in all the organisms tested except for C. albicans where the extract did not show any activity. However, the effects observed were less than those produced by the standard agent (Amoxicillin) (Table 1).
Table 1. Phytochemistry and Antimicrobial screening of leaves of alcoholic extract of
Juniperus phoenicea
Saponins Terpenoids
Steroids Flavonoids
Alkaloids Tannins
Tests
- +
- +
+ +
Zone of Inhibition (mm)
Extraction Conc.(mg/mL) Staphylococcus aureus Klebsiella pneumoniae Escherichia coli
200 14 15 15 100 12 10 12 Amoxicillin (25) 17 18 19
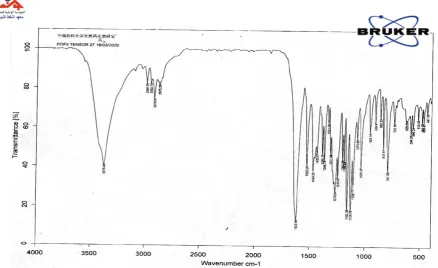
Compound 1 was isolated as a yellow crystalline needles from ethanolic extract of the barks of Juniperus phoenicea. The ethanolic extract of the plant was subjected to preparative TLC on silica gel and the TLC plates were developed with the solvent syste n-BuOH–HOAc–H2 O, (3:1:1) to obtain compound 1. The structure of compound 1 was elucidated on the basis of MS, IR, UV, 1H NMR and 13 C NMR spectroscopic data, including 2D NMR experiments. The IR spectrum of compound 1 (Fig. 1) showed characteristic absorption bands at υ (KBr)
[image:7.595.82.521.377.645.2]3375 (OH), 2952 (CH-stretching), 1622 (C=O), 1525, 14769 and 1433 (C=C, Ar), 1270 (CO) cm-1. The presence of conjugated carbonyl at 1622 cm-1 indicated that compound 1 belongs to: flavones, flavonols, chalcones or aurones.
Figure 1. IR (KBr, disc) spectrum of 4.
Figure 2. UV spectrum of compound 1.
The chalcone skeltone of compound 1 can easily be distinguished from the remaining classes of flavonoids by the two set of doublets at δH7.79 and 7.68 (each 1H, d, J=15.5 Hz) in the 1 H-NMR spectrum and its corresponding carbons resonating at δC128.4 and 143.5 in the 13 CNMR spectrum, assigned to α- and β-carbon atoms respectively. [14-16]
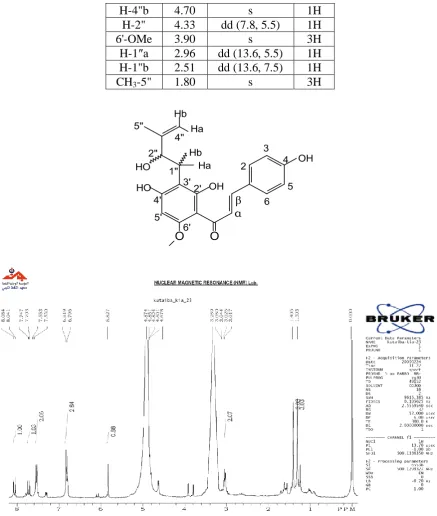
The 1H NMR spectrum (Fig. 3) of compound 1 showed a number of signals characteristic of chalcone and 2-hydroxy-3-methyl-3-butenyl moieties. [17-19] The chalcone skelton of 1 was identified by a characteristic two 1H doublets with same coupling constants (J = 15.5 Hz) resonating at δ 7.79 and 7.68 assigned to the olefinic α- and β-protons respectively. Two 2H doublets resonating at δ 7.5 (J2,3/6,5= 8.5 Hz) and 6.83 (J3,2/5,6= 8.5 Hz) are due to the
aromatic H-2,6 and H-3,5, respectively, of the B-ring and their coupling constants showed that they are ortho-coupled. A singlet at δ 3.90 (s, 3H) was assigned to a methoxy group. Another singlet resonating at δ 6.03 (s, 1H) was assigned to H-5'. The presence of a
2-hydroxy-3-methyl-3-butenyl moiety was identified by the geminal protons of the C-4′′ terminal double bond resonated at δ 4.79 and 4.70 as two singlets, while the protons of the C-1′′ methylene group resonated separately as a double doublet at δ 2.96 (H-C-1′′a, J = 13.6 and
5.5 Hz) and 2.83 (H-1′′b, J = 13.6 and 7.5 Hz). The oxymethine proton of the moiety was observed as a doublet (J = 8.9 Hz) at δ 4.33, and the methyl group protons (H-5′′) resonated at δ 1.80.
Integ Mult (J)
ppm 1H
1H d (15.5)
7.79 H-α
1H d (15.5)
7.68 H-β
2H d (8.5)
7.50 H-2,6
2H d (8.5)
6.83 H-3,5
1H s
6.03 H-5'
1H s
O O
OH
OH
HO HO
Hb Ha Hb
Ha 5"
1" 2"
4"
2' 3' 4' 5'
6'
2 3
4
[image:9.595.80.518.69.586.2]5 6 αβ
Figure 3.1H NMR spectrum of compound 1 in MeOH-d4.
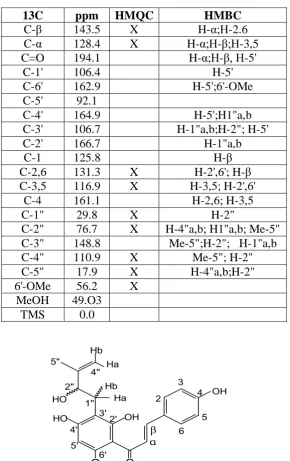
The 13 C-NMR spectrum (Fig. 4) of compound 1 showed resonances for twenty one carbon atoms with two methyl, two methylene, eight methine and nine quaternary carbons in the molecule. The chalcone skeleton of 1 was further supported by the presence of two characteristics olefinic carbons resonating at δ C 128.4 (α-C) and 143.5 (β-C). The downfield signal at δC194.1 was assigned to the ketonic carbonyl carbon. The downfield chemical shift
of the C=O ketonic carbon indicated the presence of an O-methy group at the adjacent C-6' 1H
s 4.70
H-4"b
1H dd (7.8, 5.5)
4.33 H-2"
3H s
3.90 6'-OMe
1H dd (13.6, 5.5)
2.96 H-1″a
1H dd (13.6, 7.5)
2.51 H-1"b
3H s
O O OH OH HO HO Hb Ha Hb Ha 5" 1" 2" 4" 2' 3' 4' 5' 6' 2 3 4 5 6 α β
position in A-ring. [16] The other signals at δC 106.4 (C-1'), 166.7 (C-2'), 106.7 (C-3'), 164.9 (C-4'), 92.1 (C-5'), 162.9 (C-6'), 29.8 (C-1"), 76.7 (C-2''), 148.8 (C-3"), 110.9 (C-4") and 17.9 (C-5") further supported the presence of a chalcone skeleton and 2-hydroxy-3-methyl-3-butenyl substituted A-ring. The carbons of the aromatic B-ring resonated at δC 125.8 (C-1), 131.3 (C-2,6), 116.9 (C-3,5) and 161.1 (C-4), indicated a C-4 substituted B-ring. The methyl carbon signal at δC 56.2 (C-6') indicated the presence of O-methyl group in the molecule.
[image:10.595.156.447.292.754.2]The complete 13C-NMR chemical shift data for 1, when compared with the reported data, indicated that the aglycone is a chalcone having 2-hydroxy-3-methyl-3-butenyl as a side chain20. The complete 13C-NMR and multiplicity data of compound 1 are presented in Figure 4. HMBC HMQC ppm 13C H-α;H-2.6 X 143.5 C-β H-α;H-β;H-3,5 X 128.4 C-α H-α;H-β, H-5' 194.1 C=O H-5' 106.4 C-1' H-5';6'-OMe 162.9 C-6' 92.1 C-5' H-5';H1"a,b 164.9 C-4' H-1"a,b;H-2"; H-5' 106.7 C-3' H-1"a,b 166.7 C-2' H-β 125.8 C-1 H-2',6'; H-β X 131.3 C-2,6 H-3,5; H-2',6' X 116.9 C-3,5 H-2,6; H-3,5 161.1 C-4 H-2" X 29.8 C-1"
H-4"a,b; H1"a,b; Me-5" X
76.7 C-2"
Figure 4. 13C NMR spectrum of compound 1 in MeOH-d4.
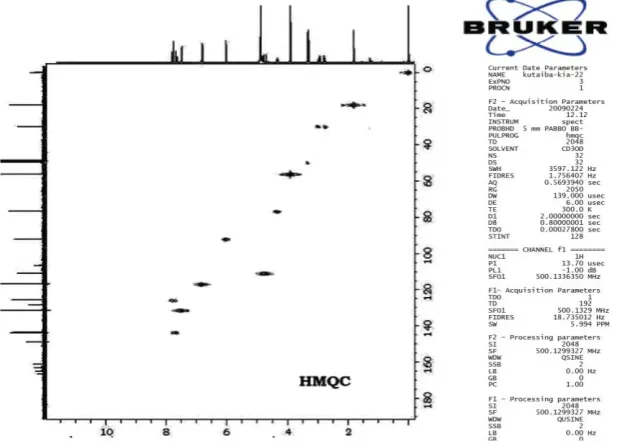
The HMQC technique was used to establish the direct one-bond 1H-13C connectivities. The protons of rings A, B and C i.e. H-5' (δH6.03), α-H (δH7.79), β-H (δH 7.68), H-2,6 (δH7.50) and H-3,5 (δH6.83) showed one-bond correlations with C-5' (δC 92.1), α-C (δC128.4), β-C (δC 143.5), C-2,6 (δC 131.3) and C-3,5 (δC116.9), respectively (Fig. 5). Protons signals of
the prenyl moiety, i.e. H-1"a (δH 2.96), H-1"b (δH 2.78), H-2" (δH 4.33), H-4"a (δH 4.79), H 4"b (δH 4.70) and H-5" (δH 1.80) showed direct connectivities with C-1" (δC 29.8), C-2" (δC
[image:11.595.144.453.525.748.2]1H COSY NMR spectrum of compounds 1 showed coupling between the doublets of H-2,6 (δH 7.50), H-3,5 (δH6.83) of aromatic B-ring (Fig. 6). The α-H (δH7.79) showed correlation with the β-H (δH7.68). Interactions of the C-1" methylene protons (δH2.96 and
[image:12.595.139.476.226.454.2]2.78) with the C-2" methine proton (δH 4.33) was observed. The latter (H-2") showed coupling with the C-5" methyl protons (δH 1.80). Intractions of the C-4" methylene protons (δH 4.79 and 4.70) with the C-5" methyl protons (δH1.80) was observed.
Figure 6. 1H-1H COSY NMR spectrum of compounds 1 in MeOH-d4.
Structure 1 was finally assembled with the help on Heteronuclear Multiple Bond Connectivity (HMBC) experiment (Fig. 7). The H-5' (δH5.93) showed two-bond couplings with C-4' (δC 164.9) and C-6' (δC162.9), three-bond couplings with C-3' (δC 106.7) and C-1' (δC 106.4). The H-2,6 (δH7.50) of aromatic B-ring showed coupling with C-2,6 (δC131.3),
C-3,5 (δC 116.9), C-4 (δC161.1) and β-C (δC 143.5), while H-3,5 signal (δH6.83) was found to be coupled with C-3,5 (δC 116.9), C-4 (δC 161.1) and α-C (δC128.4). The α-H (δH7.79) showed coupling with α-C (δC128.4), β-C (δC143.5) and C=O (δC 194.1), while H-β (δH
7.68) signal was found to be coupled with C-2,6 (δC 131.3), C-α (δC 128.4), C-1 (δC 125.8) and C=O (δC 194.1). The O-methyl protons (δH 3.90) were found to be coupled with C-6' (δ
C-3' (δC106.7), C-2' (δC166.7), C-4' (δC 164.9), C-2" (δC 69.495) and C-3" (δC 148.8). The H-2" (δH4.33) showed coupling with C-3' (δC 106.7), C-1" (δC 29.8), C-3" (δC 148.8), C-4" (δC110.9) and 5" (δC17.9), while Me-5" (δH1.80) signal was found to be coupled with C-2" (δC 76.7), C-3" (δC 148.8) and C-4" (δC 110.9). The H-4"a,b (δH4.79, 4.70) showed
[image:13.595.104.496.198.457.2]heteronuclear ineractions with C-2" (δC76.7) and C-5" (δC17.9).
Figure 7. 1H-13C HMBC NMR spectrum of 1 in MeOH-d4.
Figure 8. ESI-MS2 spectrum of compounds 1. O O OH OH -O HO O OH O O -O HO OH O O C
O- O
O C O O -O HO HO +
[M-H]- m/z 369 [M-H]- m/z 369 A
m/z 249 O O O HO HO HO HO O -O O O O
CH2
-O
-+
B
[image:14.595.99.499.71.510.2]m/z 119
Figure 8. Fragmentation pathways to A and B fragments of compound 1.
O O OH OH -O HO O OH O O -O HO OH O O C
O- O
O CO O -O HO HO +
[M-H]- m/z 369 [M-H]- m/z 369 m/z 249 A
O O O OH HO HO O -+ B m/z 119 -O O O O -OH OH CH
-Figure 10. Alternative pathway to B fragments observed as prominent peak at m/z 119
in the negative ion ESMS spectrum of compound 1.
[image:14.595.106.496.538.645.2]REFERENCES
1. Timberlake, C.F., and Henry, B.S., Endeavour, 10, 31 (1986). 2. Winkel-Shirley, B., Plant physiology 126, 485 (2001).
3. Andersen, Ø.M., and Markham, K.R., Flavonoids: Chemistry,Biochemistry and Applications, CRC Press: Boca Raton, 2006.
4. Taylor, L.P., and Grotewold, E., Current opinion in plant biology, 8, 317 (2005). 5. Treutter, D., Plant biology, 7, 581 (2005).
6. Harnly, J.M., Doherty, R.F., and Beecher, G.R., Journal of agricultural and food chemistry, 54, 9966 (2006).
7. Tammaroand, F., and Xepapadakis, G.,Journal of Ethanopharmacology, 16, 167 (1986). 8. Jonkov, S., and Naidenov, G., Folla Med. (Plovdiv)., 16, 291 (1974).
9. Cunliffe, W.J., British Journal of Clinical Practice, 28, 314 (1974).
10.Sofowara, A., Medicinal plants and Traditional medicine in Africa. Spectrum Books Ltd, Ibadan, Nigeria, 289 (1993).
11.Trease, G.E., Evans, W.C., Pharmacognsy 11th edn. Brailliar Tiridel Can. Macmillian publishers, 1989.
12.Harborne, J.B., Phytochemical methods, London. Chapman and Hall, Ltd., 49 (1973). 13.Mabry, T.J., Markham, K.R., and Thomas, M.B., The Systematic Identification of
Flavonoids, Springer-Verlag, New York, 1970.
14.Kitanaka, S., and Takido, M., Chem. Pharm. Bull., 40, 249 (1992).
15.Nikolov, N., Seligmann, O., Wagner, H., Horowitz, R.M., and Gentili, B., Planta Medica, 44, 50 (1980).
16.Agrawal, P.K., Carbon-13 NMR of Flavonoids, Elsevier Science Publishers, Amsterdam, 1989.
17.Markham, K.R., “Techniques of Flavonoids Identification”, Academic Press. London, 1982.
18.Markham, K., Isolation techniques for flavonoids, in The Flavonoids, Harbone, J.B., Mabry, T.J., and Mabry, H., Eds., Academic Press, New York, 1975.
19.Nkengfack, A.E., Sanson, D.R., Tempesta, M.S., and Fomum, Z.T., J. Nat. Prod., 52, 320 (1989).