Alleviating Labour Shortages
Forum Report No. 19
November 2000
PUBLISHED BY THE NATIONAL ECONOMIC AND SOCIAL FORUM
Copies of this Report may be obtained from the: GOVERNMENT PUBLICATIONS SALES OFFICE
Sun Alliance House, Molesworth Street, Dublin 2.
or
THE NATIONAL ECONOMIC AND SOCIAL FORUM Frederick House, 19 South Frederick Street, Dublin 2.
Price: IR£5.00 €6.35
(PN 9208) ISBN 1-899276-23-8
TH
E
N
A
TI
O
N
AL
ECONOMIC
AN
D
SO
C
IA
L
FORUM
Contents
Page
Foreword 5
Section I Introduction and Overview 9
Section II Labour Market Assessment 23
Section III Employment and Non-Employment 39
Section IV The Participation Challenge 51
Section V A Comprehensive Welfare to Work Strategy 65
Section VI Individual or Joint Taxation? 79
Section VII Women Returning to the Labour Market 93
Section VIII Immigration Policy 103
Annex I References 119
Annex II Project TeamÕs Terms of Reference 119
Terms of Reference and Constitution of the Forum 123
Membership of the Forum 124
Forum Publications 126
Foreword
Since 1994, Ireland has experienced an unprecedented growth in employment and as a corollary, a dramatic fall in unemployment. This success has, however,
brought new labour market challenges as labour and skill shortages and associated recruitment difficulties have emerged across the economy. It is against this
background that, in December of last year, the Forum established a Project Team to prepare a Report on Labour Shortages. A draft of this Report was considered by the Forum at its Plenary Session in Dublin on October 10th last. At this meeting, members also heard a keynote address on a range of policy issues from the T‡naiste and Minister for Enterprise, Trade and Employment, Ms. Mary Harney T.D. Subject to a number of comments, which are now incorporated in the text, this Plenary fully endorsed the Report.
Labour market policies can help address recruitment difficulties in a number of ways including developing workforce skills, promoting more efficient labour market matching and supporting the expansion of the labour force. While a comprehensive policy response requires action in all these areas, this Report focuses on policies to facilitate the expansion of the workforce.
Overall, the Report attempts to do two things. First, in Sections II-IV, it places the issue of labour shortages in perspective. It discusses the nature and extent of the problem and examines the potential for mobilising additional labour supply from domestic sources. It then sets out a broad policy agenda to ensure that effective opportunities for labour market participation are available to all. Second, in Sections V-VIII, the Report discusses specific policies that can help alleviate labour shortages. It considers policy in four areas: welfare to work, taxation, supports for women returners and immigration policy.
Section I provides an overview of the Report as a whole and includes a summary of the specific recommendations made. We hope that this Report will be taken into account by all relevant interests and assist the development of more effective policies to manage our new found prosperity in as efficient and socially just way as possible.
Section I
Introduction
and Overview
1.1 Since 1994, Ireland has experienced an unprecedented expansion in
employment that has brought widespread benefits. As the labour market has tightened, unemployment has fallen dramatically and participation has increased. As a result, living standards have risen and consistent poverty has been alleviated.
1.2 This success, however, has brought new labour market challenges as labour and skill shortages and associated recruitment difficulties have emerged across the economy. While rising wage rates can be expected to bring labour supply and demand into equilibrium over time, labour supply policies can help address recruitment difficulties by developing workforce skills, promoting more efficient labour market matching and supporting the expansion of the labour force. A comprehensive policy response requires action in all three areas. The focus of this Report is on the third of these, namely policies to facilitate the expansion of the workforce.
Labour Shortages in Perspective
1.3 The two key factors determining the labour supply challenge over the medium-term are the performance of the economy and the evolution of participation rates. Without updated medium-term forecasts for growth and participation, it is not possible to quantify overall labour requirements. However, comparing different scenarios helps to identify the relevant policy issues (Section II).
1.4 Scenario 1: The ESRI Medium-Term Review Central Forecast sees the economy growing at 5.1% per annum on average in the 2000 Ð2005 period and employment growing at 2.1% per annum. In such a scenario,
employment would increase by 176,000 and the overall participation rate would have to increase from 58.9% today to 61% by 2005 to match forecast employment expansion. In this scenario, modest increases in participation rates would mean that no significant increase in immigration would be necessary to meet labour supply requirements.
1.5 Scenario 2:Higher growth rates would imply a much greater challenge. If
annual growth were one per cent higher on average than in the above
scenario, employment would grow by 268,000 and participation would have to increase to 63.8% by 2005 to match employment growth. Failing this, immigration would have to increase. However, there is considerable uncertainty about the feasibility and even the desirability of such a higher growth scenario.
Expanding the Workforce
1.6 The relative emphasis to be given to immigration or participation policies is an important question in its own right. Immigration is an important
mechanism for meeting specific skill shortages. However, it places additional demands on infrastructure including housing. In the present context of supply constraints, this exacerbates existing problems in these areas. This suggests some caution about relying on immigration to expand labour supply in aggregate terms. Our analysis of participation in the Irish labour market shows that considerable potential remains for mobilising domestic labour supply (Section III). This is the central theme of our Report.
1.7 We identify four key challenges to employment policy (Section IV). These are:
¥
The labour market situation of the least skilled;¥
Supporting older people in the labour market;¥
Addressing barriers to womenÕs employment; and,¥
The right to work of people with disabilities. .1.8 The labour market situation of the least skilled:There are two
complementary ways to address this challenge. First, there are measures to address education and skill deficits both before young people enter the labour market and among adults. A particular challenge is to ensure that priority is given to addressing the education and training needs of the least skilled, regardless of their current employment or social welfare status. In order to do this the focus of training policy in the current labour market context must be clarified.The second complementary approach is to Ômake work payÕ at the lower end of the labour market through the development of:
10
¥
The minimum wage;¥
Targeted tax relief, especially through increasing basic tax credits;¥
In-work benefits; and,¥
Other welfare to work policies.1.9 Supporting older people in the labour market:The challenge here is to restructure retirement and early retirement incentives on the one hand and ensure opportunities for remaining in employment on the other. Many of the rules incorporated in social security and tax systems present an all or
nothing choice to older workers. Reform should, therefore, focus on measures that allow for a more gradual withdrawal from the labour market according to individualsÕ preferences and abilities. Specific Irish research is required to clarify the relative roles of incentives to withdraw versus
effective exclusion from the labour market as factors determining the fall in participation of older workers. As a priority, labour market policy must address both the prevention of long-term unemployment of older workers and the re-integration of older men and women into the labour market.
1.10 Addressing barriers to womenÕs employment:The barriers to employment facing women are broadly of two types. First, there are the difficulties faced by parents of young children in particular in combining work and family responsibilities. This issue can be addressed through the provision of time, money and services. Time flexibility is a crucial element in enabling parents, men and women, to reconcile employment and childcare responsibilities. Currently, some £250 million is committed to childcare supply measures over the period of the National Development Plan (2000-2006). However, as we are starting from a very low base of provision, ongoing substantial investment will be required. Support for childcare costs should be introduced as a priority. It has not been possible to reach a consensus on the best way forward on this issue, which, in any case, is being addressed in the context of the Programme for Prosperity and Fairness (PPF). Second, women face additional obstacles when seeking to return to work after a period of absence caring for children. Both the tax and social welfare systems incorporate specific disincentives to women returning to work. In addition, being out of employment for relatively long periods of time poses additional obstacles Ð in terms of familiarity with the current labour market, skills that have become obsolete and even loss of confidence
Section I - Introduction and Overview
in oneÕs ability to make the transition back into work.
1.11 The right to work of people with disabilities:People with disabilities constitute a relatively large proportion of the working age population and employment among this group is significantly lower than for the population as a whole. The Department of Enterprise, Trade and Employment, in consultation with stakeholders in the disability sector, has formulated a three-year (2000-2003) strategy aimed at improving employment
opportunities. While much progress has been made in recent years, there is a long way to go to ensure that the rights of people with disabilities are fully provided for.
1.12 We discuss these four key challenges in Section IV, setting out a broad policy agenda for ensuring that effective opportunities to participate in the labour market are extended to all. In doing this, we deliberately touch on a wide range of policy issues. Clearly, it is not possible to address each of these issues in depth. Rather we select particular policy areas for more in-depth discussion. The role of welfare to work policy, tax individualisation and the provision of specific guidance and employment supports to women returning to the labour market are addressed in Sections V-VII respectively. Finally, we consider immigration policy in Section VIII.
1.13 A summary list of specific recommendations follows in Box 1.1.
12
Section I - Introduction and Overview
13
Box 1.1
Summary List of Recommendations
(Number references are to corresponding paragraphs in the Report)
Labour Market Assessment
2.13 Outreach to and technical assistance for small businesses developing recruitment and retention strategies should be a priority for the National Employment Service.
2.14 An efficient job placement service within the National Employment Service is essential.
2.31 Updated medium-term forecasts for growth and participation are required.
The Participation Challenge
4.14 Every effort should be made to facilitate old and new Pre-Retirement Allowance (PRETA) claimants into paid employment. It would be useful, therefore, to review the operation of PRETA to ensure that adequate supports are put in place for the reintegration of the older long-term unemployed.
4.30 The PPF working group to review costs of disability should include in its terms of reference the real costs of people with disabilities returning to work and coping with the transition to work.
A Comprehensive Welfare to Work Strategy
5.8 The Department of Social, Community and Family Affairs (DSCFA) should develop a comprehensive welfare to work strategy to ensure that the social welfare system facilitates access to paid employment
opportunities for all, regardless of social welfare category.
14
Forum Report No. 19 - Alleviating Labour Shortages
and Cross Departmental Team should be assisted by a Welfare to Work Advisory Group made up of representative groups of different claimant categories, representatives from the welfare to work information
infrastructure and the Social Partners.
5.12 We support the recommendation of the ÔReport of the P2000 Working Group on WomenÕs Access to Labour Market OpportunitiesÕthat qualified adults in households where the claimant is eligible to participate in active labour market programmes should be eligible for Job Start and Workplace.
5.17 Information leaflets encouraging qualified adults to take up employment should be clear and realistic about the implications for both the claimant and the qualified adult.
5.18 The Forum supports administrative individualisation as a first step towards a gender equitable social welfare system and it urges a speedy conclusion to the work of the PPF Working Group examining this issue. Welfare to work outcomes for qualified adults should be taken into account by this Group.
5.19-5.25 A more comprehensive welfare to work strategy will necessitate a wider overview of the interaction between secondary benefits and decisions to return to work.
5.21-5.23 The implementation of the tapering of rent allowance will require specific monitoring.
5.24 Unemployed people and lone parents can retain the medical card for three years after going back to work. We strongly urge that Health Boards and other agencies publish accessible information on this provision and ensure that this policy is fully implemented.
Section I - Introduction and Overview
15
original value of the disregard is maintained. An additional systematic review of disregards should take place every five years. Future tapered disregards should follow a consistent formula to enable those with low numeracy levels to self calculate, for example based on Ò5Ó
-25%/50%/75% or £5/£10/£15/£20/£25/£30.
5.33 Measures to support decision-making and risk-taking should include a guarantee of a return to original payments if the attempt at returning to work does not succeed.
5.34 Ð5-36 Access to quality and relevant information is a vital part of efforts to support the transition from social welfare into work. There is still a need for a blueprint or national strategy to develop a comprehensive and integrated information infrastructure.
5.38 The Welfare to Work Policy Unit should also be responsible for monitoring information technology developments in welfare to work information and advice, including the REACH initiative, developments in Comhairle and the mainstreaming of good practice initiatives from the Centres for the Unemployed.
5.39 Welfare to work information services are heavily dependent on
Community Employment. To avoid dilution of this infrastructure, these should be identified as Ôessential servicesÕ. The Standing Committee on the Labour Market should address this.
5.40 Consideration should be given to naming specific sub-groups (e.g. Refugees, asylum-seekers with permission to work, homeless people, people leaving prison and the Traveller Community) as eligible categories for welfare to work supports and to targeting advertising within certain communities of interest.
5.41 FçS should ensure that Welfare to Work modules are standard on all labour market programmes as well as on all CE Supervisors training.
16
Forum Report No. 19 - Alleviating Labour Shortages
Individual or Joint Taxation?
6.11 We do not find the arguments for income splitting compelling in principle. Furthermore, there are strong arguments in terms of personal rights and respect for the autonomy of all individuals to favour individual taxation.
6.20-6.21 The overall distributional effect of the present policy of band individualisation is regressive. This is of concern given the PPF
commitment to Òdevelop the structure of the tax system to deliver benefits and focus resources in an equitable manner.ÓWhile we support individual taxation in principle, greater priority needs to be given to limiting these regressive effects through ensuring that the other elements of an overall personal tax reform package comprise measures favouring those on lower incomes and/or all taxpayers equally.
6.27 We recommend that consideration be given to Ôadministrative
individualisationÕ of income tax for married couples. This would mean changing the current default option to separate assessment with the option of joint assessment on one spouse at the joint request of the couple
6.30 Ð6.31 The Home Carers Allowance (HCA) has introduced a new barrier to married women wishing to return to the paid labour force. The HCA should not be increased further. (Beyond this, however, there was a divergence of views on how the distortions brought about by the HCA should be addressed).
Women Returning to the Labour Market
7.11 Ð 7.15 To maximise their considerable resource potential, we recommend the setting up of a National Support Programme for Women Returners. The core elements of such a Programme should include the establishment of women returners as a priority group within FçS Employment Services and Training provision. The structures required to implement this
Programme should include the establishment of a National Advisory Committee including the Social Partners.
Section I - Introduction and Overview
17
implemented without delay. This will involve co-ordination between the Departments of Social, Community and Family Affairs; Enterprise, Trade and Employment; Education and Science; and the Social Partners. A clear timetable for implementation should be established. The outcomes for women arising from these recommendations should be tracked and
monitored in a transparent manner to assess their effectiveness in targeting women and increasing their access to education and training.
7.24 In its ÔAction Programme on Long-term UnemploymentÕ, FçS set a percentage target for participation of the long-term unemployed in mainstream training programmes. For the purposes of this target, the definition of long-term unemployed should include long-term qualified adults.
7.25 FçS is committed to ensuring that ÒFçS services reach key groups such as long-term unemployed women, women returners, women with disabilities, traveller women and early school leavers.ÓDeveloping this approach will require specific participation targets, support measures and organisational initiatives in relation to each of these groups.
7.26 A specific target should be set for provision of mainstream training programmes on a part-time basis.
Immigration Policy
8.35 With the growing significance of economic immigration, it is important that Irish policy in this area is clearly defined. We therefore welcome the fact that the Government has moved to update the legislative basis for policy. We hope that publication of this draft legislation will provide the opportunity for a more considered and better informed public debate on immigration policy in general and economic immigration in particular.
8.37 Consideration should be given to allowing people who have been working in accordance with a work permit for an extended period (of perhaps two or three years) to then qualify for a more open working visa type
arrangement.
18
Forum Report No. 19 - Alleviating Labour Shortages
Authorisations and Work Visas. This should be kept under review and returned to if it is seen to act as a barrier to attracting designated workers to Ireland.
8.41 Consideration should be given to issuing Work Authorisations/Visas for a longer duration in the first instance. An initial duration of at least three years would seem to be in line with emerging practice in countries such as the UK, Germany and the US. In addition, the longer-term options open to authorisation/visa holders must be clarified to enable employers and the National Employment Service to positively promote a clear package to prospective workers.
8.42 The Work Visa Scheme is applied to designated occupations. The specific categories designated should be kept under review to ensure that they continue to match identified needs.
8.43 The marketing of the Work Visa/Work Authorisation Scheme requires attention.
8.44 Third country nationals legally resident in EU Member States, even those who have lived there for many years, are not accorded freedom of
Report Preparation
1.14 The ForumÕs Project Team on Labour Shortages was set up in December 1999. The final membership of the Team was as follows:
Aileen OÕDonoghue, Irish Business and Employers Confederation (Team Chairperson)
Councillor Tadgh Curtis, Association of Municipal Authorities Frank Doheny, Department of Enterprise, Trade and Employment Helen Johnston, Independent Government Appointee
Camille Loftus, Irish National Organisation of the Unemployed Senator Paschal Mooney, Fianna F‡il
Orla OÕConnor, National WomenÕs Council of Ireland Gearoid OÕMaoilmhic’l, National Youth Council of Ireland Manus OÕRiordan, Irish Congress of Trade Unions
Deputy Gerry Reynolds, Fine Gael
The following also served for periods on the Team:
Mike Allen, formerly Irish National Organisation of the Unemployed Brendan Butler, Irish Business and Employers Confederation
Mary Coleman, Irish Cooperative Organisation Society Gr‡inne Healy, National WomenÕs Council of Ireland Senator Helen Keogh, formerly Progressive Democrats
Forum Secretariat: Laurence Bond
1.15 The Team met regularly between December 1999 and October 2000. A copy of the terms-of-reference agreed by the Team and the Management
Committee in February last is attached as Annex II.
1.16 A consultant, Ms Mary Murphy, was commissioned to prepare background material on Welfare to Work Issues, from which we have drawn extensively in Section V.
1.17 The Forum considered a draft of this Report at its Plenary Session in Dublin on 10 October 2000. Subject to a number of comments, which are now incorporated in the text, this Plenary fully endorsed the Report.
Section I - Introduction and Overview
Acknowledgements
1.18 Many people, too numerous to mention individually, provided invaluable assistance to the Team in preparing this Report. Particular thanks are due to the following who met with the Team and whose advice and expertise facilitated its work: Professor John Fitzgerald, Professor Jerry Hughes and Mr. James Williams of the ESRI; Ms. Mary Murphy; Mr. Paul OÕDoherty; Mr. Glen Carr, Ms. Liz Carter, Ms. Carol Conway, Mr. Peter Davitt, Ms. Patricia Lee, Ms. Fiona Nolan, Mr George Ryan and Ms Marian Vickers; Ms. Frances Byrne, Ms. Mary Flavin, Ms. Judy Maloney, Ms. Sinead Togher and Ms. Maggie Phayre.
20
Section II
Labour
Market
Labour Market
Assessment
2.1 Our examination of labour market developments in this Section provides the essential context for the remainder of this Report. We begin with a
discussion of recent labour market pressures. This is followed by a brief discussion of the importance of training and labour market matching for facilitating adjustment in this new context. However, our focus is on labour supply. We introduce this theme by considering recent and prospective trends in labour demand and supply. Following this assessment, we set out our broad approach to expanding the work force.
A High Pressure Labour Market
2.2 Since 1994, Ireland has experienced an unprecedented expansion in
employment that has brought widespread benefits. As the labour market has tightened, unemployment has fallen dramatically and participation has increased. At the same time, living standards have risen and consistent poverty has been alleviated. Employers have benefited from strongly growing demand and expanded business opportunities. Many people have benefited from wider job opportunities and higher earningsÐ including many of those who in earlier years had suffered the worst consequences of slack labour markets - less-educated young people, women, and the manual working class. Until recently, all of this had largely occurred without any apparent loss of output or employment growth due to labour shortages, and with only modest effects on inflation. However, this is now no longer the case.
2.3 Employers now identify labour and skill shortages and associated recruitment difficulties as a major problem. As late as 1996, the private sector vacancy rate was only around 2%, little different than it had been at the beginning of the decade. In late 1999, a national survey of private sector vacancies found a vacancy rate1of 6.5%. This was an increase on the 5.8%
rate recorded the previous year. In 1998,227% of firms reported vacancies
23
1 Vacancies are defined as Òunmet demand for labour, where the positions are currently unoccupied, available immediately and the firm is actively searching for workersÓ. The vacancy rate is measured as vacancies/employment+vacancies.
and most of these firms said that they considered at least one current vacancy Ôhard to fillÕ (Williams and Hughes, 1999). When asked to rank seven possible difficulties facing Irish companies, ÔDifficulties in Recruiting StaffÕ was ranked as most problematic by 38% of all firms in a nationally representative sample, which was as least twice as many as for any other single reason (Nolan, OÕNeill and Williams, 1999). Shortages are not restricted to the private sector. There are also large numbers of vacancies in the public sector. Staff shortages are posing significant difficulties to public service providers in many areas, including medical and social care services.
2.4. Alongside the recruitment difficulties faced by employers, a tight labour market presents new challenges to macroeconomic management. In particular, there is an increased risk of wage adjustment overshooting with adverse consequences for competitiveness. As the National Competitiveness Council recently argued ÒPervasive skill and labour shortages are
increasing the risk of overheating and a much sharper than expected economic slowdownÓ(2000a:7). The recent rise in inflation has also heightened concerns about overheating in the economy (International Monetary Fund, 2000; Department of Finance, 2000).
2.5 Addressing skill shortages and facilitating an expansion of labour supply can also help to minimise the risk of a hard landing for the economy. However, insofar as an expansion of total labour supply is achieved by expanding the overall population - i.e. through immigration Ð it places additional demands on infrastructure including housing (Duffy et al, 1999). This may have negative consequences in the present context of
infrastructural supply constraints. More generally, insofar as there are risks of overheating, labour supply measures can help macroeconomic adjustment only as part of a balanced package in which supply and demand-side
policies are brought together in a coherent manner.
2.6 While all regions in Ireland have experienced employment growth in recent years, not all have grown at the same rate and the labour market is not equally tight across all parts of the country. Regional policy can, therefore, play an important role in easing labour market and other tensions that arise in an economy operating at, or close to, full employment. This underlines the urgency of putting in place a National Spatial Strategy.3
24
Forum Report No. 19 - Alleviating Labour Shortages
2.7 As with any market, the labour market has ways of reducing shortages. Tight labour markets generate higher wages and other incentives Ð such as better benefits and more flexible work arrangements Ð to encourage new entrants to the market. As wages increase, employers seek fewer workers, while more people are attracted into the labour force. Rising wage rates can be expected to bring labour supply and demand into equilibrium over time. However, in practice market adjustment takes time and is not a perfect mechanism so that wages may overshoot as noted above. Thus, labour supply policies can play an important role is assisting adjustment to tighter labour markets by
developing workforce skills, promoting more efficient labour market
matching and supporting the expansion of the labour force. The focus of this Report is on the third of these, namely policies to facilitate the expansion of the workforce. However, we emphasise at the outset that a comprehensive policy response to our rapidly changing labour market requires action in all three areas.
Developing Workforce Skills
2.8 Skill shortages are a significant factor in the persistence of vacancies. In the 1998 vacancy survey cited above, firms reporting difficulty filling vacancies were asked to indicate which of nine suggested options were responsible for their recruitment difficulties. Shortage of applicants with the right practical skills was the single most frequently cited reason (cited by 46% of firms) followed by shortage of applicants with the right practical experience (43%). These were followed by Ôtoo much competitionÕ (37%) and Ôlack of
qualificationsÕ (20.9%) (Williams and Hughes, 1999).
2.9 The distribution of vacancies also highlighted the importance of specific skill shortages. Sectoral vacancy rates were grouped closely around the 6% average i.e. the distribution of vacancies by sector broadly followed that of overall employment. However, occupational vacancy rates were more widely dispersed with the highest vacancy rates found in higher/technical occupations. Six of seventeen broad occupational groups had vacancy rates above 10% including: Engineering Professionals (11.1%); Computer Professionals (14.8%); Engineering Technicians (10.8%); Science
Technicians (10.9%); Computer Technical Staff-Associate Professional level (14.1%); and, Security (10.8%).4In some of these occupations, labour is in
Section II - Labour Market Assessment
25
short supply internationally and countries are competing to attract or retain specialist staff. In these occupations, our ability to attract skilled people to Ireland is an important competitive issue.
2.10 In late 1997, the Government established the Expert Group on Future Skills Needs under the aegis of Forf‡s. Following publication of its first report, the Government, in April 1999, allocated an additional £75 million to provide 5,400 third level places for the electronics and software sectors. In its second report, published in March 2000, the Expert Group recommended 1,150 additional third level places for the pharmaceutical, chemical, food and biotechnology sectors and recommended initiatives to improve the availability of skills for research and for the construction sector. Apart from addressing specific higher skill gaps, policies to upskill the labour force will play a crucial role in promoting labour market adjustment and ensuring competitiveness in the long run. The challenge here is to ensure that the required priority is given to addressing the training needs of the least skilled while having due regard to other training policy objectives (CSF Evaluation Unit, 1999).
Labour Market Matching
2.11 While the occupational vacancy data suggest specific skill shortages in higher/technical occupations, in most cases these are small occupational groups accounting for a relatively small share of total vacancies. Relatively high vacancy rates and associated recruitment difficulties exist across the economy.
2.12 Delays in adapting recruitment practices to a very different labour market also directly contribute to the persistence of vacancies. In a buyers market, which is what we have been used to in Ireland until recently, prospective workers compete with each other for available jobs and the onus falls on the worker to sell him or herself to the employer. In our new sellers market, employers must compete with each other to recruit and retain available workers and the onus is on the employer to market job offers to the prospective employee almost as they would market a product. This means identifying the ÔmarketÕ and responding to what the ÔcustomersÕ (i.e. employees or prospective employees) want. Firms looking for staff need to compete on wages but also on non-pay factors such as working conditions, flexibility, family issues and in-work training.
26
2.13 A tighter labour market has already stimulated greater employer innovation in these areas, serviced in part by a rapidly growing private recruitment industry. While many firms have been actively adapting to the changing labour market, it appears that such change has come about more quickly in larger firms with professional human resource departments. Some employers may have particular difficulties in adapting to the changing labour market and greater efforts to support them may be required. Small employers in particular may have the greatest difficulty finding and retaining qualified workers, yet many are not familiar with new recruiting techniques. Thus, greater outreach to and technical assistance for small businesses by the National Employment Service should be a priority. The ÔMind the GapÕ package developed for the UK Skills Task Force provides a useful model here (see www.dfee.gov.uk/recruit/index.htm).
2.14 Public policy can also help match workers to employers, particularly by providing information about available job openings, job search assistance and help for employers in developing effective recruitment and retention practices. As Williams and Hughes, the ESRI authors of the National
Vacancy Survey argue: ÒThe increase in vacancies in recent years highlights the importance of having an efficient job placement function within the public Employment Service. Research in other countries shows that improvements in job-matching by the public Employment Service can significantly reduce the duration of vacanciesÓ(Williams and Hughes, 1999:xii).
Recent Labour Market Trends
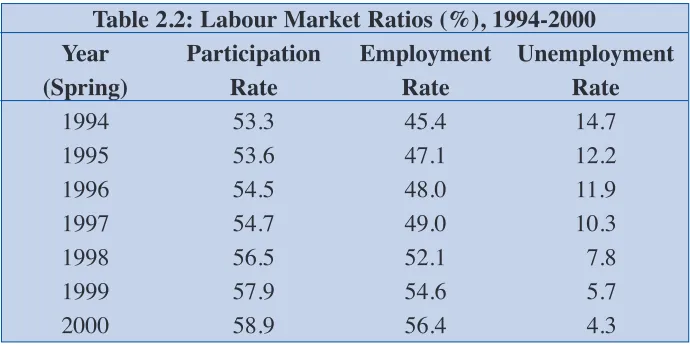
2.15 The emergence of general labour shortages across the economy must be seen in the context of the transformation in the labour market that has taken place within a relatively short period. Since 1994, Ireland has experienced unprecedented growth in employment. In the six years from April 1994 to April 2000, employment increased by 450,000, or significantly more than a third (37%). Where did all these extra workers come from? Some came from unemployment, which fell by 136,000 over the six years. This fall combined with the strong growth of the labour force brought about a rapid fall in the ILO unemployment rate, from 14.7% in 1994 to 4.3% in 2000. Most new jobs were filled as a result of a rapid expansion in the labour force, which grew by 314,000 (data on trends in the Irish labour market are set out in Tables 2.1 and 2.2.). This rapid growth in the labour force came
Section II - Labour Market Assessment
about through increases in the working age population in combination with increasing participation rates.
Table 2.1: Labour Market Trends ('000s), 1994-2000
Year Population Labour At Work Unemployed
(Spring) 15+ Force
1994 2687.4 1431.6 1220.6 211.0
1995 2723.3 1459.2 1281.7 177.4
1996 2766.7 1507.5 1328.5 179.0
1997 2815.0 1539.0 1379.9 159.0
1998 2869.7 1621.1 1494.5 126.6
1999 2915.4 1688.1 1591.1 096.9
2000 2962.6 1745.6 1670.7 074.9
Source: CSO Quarterly National Household Survey
Table 2.2: Labour Market Ratios (%), 1994-2000
Year Participation Employment Unemployment
(Spring) Rate Rate Rate
1994 53.3 45.4 14.7
1995 53.6 47.1 12.2
1996 54.5 48.0 11.9
1997 54.7 49.0 10.3
1998 56.5 52.1 07.8
1999 57.9 54.6 05.7
2000 58.9 56.4 04.3
Source: Table 2.1
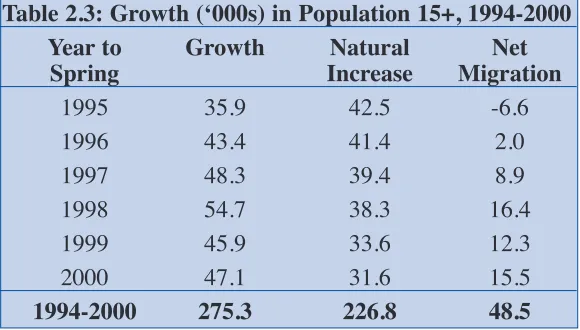
2.16 Between 1994 and 2000 the working age population (15+) grew by 275,300, most of which (226,800) was accounted for by natural increases (Table 2.3). Ireland experienced a baby boom between the mid-1950s and the late 1970s that has been feeding through into the labour force over subsequent decades. Until relatively recently this was either offset by emigration or translated directly into higher unemployment. However, in the booming economy of the last six years it contributed to the rapid growth in employment. Fertility declined quite sharply after 1980 and thus the natural increase has been falling. While this year (2000) it will add around 27,000 to the population of working age, this will fall to around 12,000 in 2008 (Hughes, McCormick and Sexton, 2000). Nevertheless, the natural increase will continue to contribute strongly to labour supply over the medium term.
28
[image:23.595.126.471.330.503.2]Table 2.3: Growth (Ô000s) in Population 15+, 1994-2000
Year to Growth Natural Net
Spring Increase Migration
1995 35.9 42.5 -6.6
1996 43.4 41.4 2.0
1997 48.3 39.4 8.9
1998 54.7 38.3 16.4
1999 45.9 33.6 12.3
2000 47.1 31.6 15.5
1994-2000 275.3 226.8 48.5
Source: CSO Population and Migration Estimates
2.17 Net immigration also contributed to the growth in the working age population. IrelandÕs pattern of migration has moved from a situation of heavy net emigration in the 1980s through to fluctuating around zero in the first half of the 1990s, and then to relatively strong net immigration since 1996 (CSO various; Punch and Finneran, 1999). Between 1994 and 2000, net immigration added 48,500 to the population of working age with much of this concentrated in the second half of the period (Table 2.3). Thus, net migration accounted for only a small part of total labour force growth in recent years. However, in the medium-term, net immigration is expected to continue at close to the level reached in the last few years, while the natural increase will fall. Immigration will, therefore, account for a higher share of growth in the working age population in the future.
2.18 Net immigration is the product of gross inward and outward flows (Table 2.4). Since the mid-1990s, gross emigration has fallen somewhat, while gross immigration has increased. Irish nationals have typically accounted for around one half of annual inflows, although in the most recent year this fell to 43%. Over time, as the reservoir of potential immigrants among Irish nationals abroad declines, the composition of immigration by country of origin can be expected to change.
Section II - Labour Market Assessment
Table 2.4: Gross and Net Migration (Ô000s), 1994-2000
Year All 15 plus
to Spring Gross Gross Net Gross Gross Net
Immigration Emigration Migration Immigration Emigration Migration
1995 31.2 33.1 -1.9 25.9 32.5 -6.6
1996 39.2 31.2 8 32.6 30.6 2
1997 44 29 15 37.6 28.7 8.9
1998 44 21.2 22.8 36.8 20.4 16.4
1999 47.5 29 18.5 41.2 28.9 12.3
2000 42.3 22.3 20 37.3 21.8 15.5
1994-1999 248.2 165.8 82.4 211.4 162.9 48.5
Source: CSO Population and Migration Estimates
2.19 The labour supply effects of a growing population of working age have been reinforced by increased participation, especially by women. The
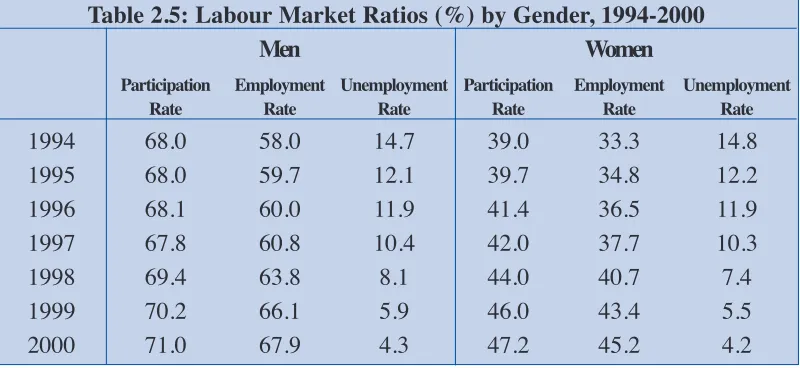
participation rate Ð i.e. the proportion of those of fifteen years or over who are in the labour force Ð increased by 5.6 percentage points from 53.3% in 1994 to 58.9% in 2000. Participation increased much more rapidly among women than men (Table 2.5). Male participation increased by 3 percentage points to 71% between 1994 and 2000 while female participation increased by 8.2 points to 47.2% in 2000.
Table 2.5: Labour Market Ratios (%) by Gender, 1994-2000
Men Women
Participation Employment Unemployment Participation Employment Unemployment
Rate Rate Rate Rate Rate Rate
1994 68.0 58.0 14.7 39.0 33.3 14.8
1995 68.0 59.7 12.1 39.7 34.8 12.2
1996 68.1 60.0 11.9 41.4 36.5 11.9
1997 67.8 60.8 10.4 42.0 37.7 10.3
1998 69.4 63.8 8.1 44.0 40.7 7.4
1999 70.2 66.1 5.9 46.0 43.4 5.5
2000 71.0 67.9 4.3 47.2 45.2 4.2
Source: Derived from CSO Quarterly National Household Survey
Future Scenarios
2.20 Recent employment trends have been highly exceptional when compared to historical experience in Ireland. Nevertheless, the consensus among
30
[image:25.595.100.500.450.634.2]economic forecasters is that employment will continue to grow strongly over the medium-term, although at a declining rate compared to the last five years. The ESRI Medium-Term Review (Duffy et al, 1999) is the only model-based, medium-term forecast available and to date it has provided the framework for medium-term Government planning in the National
Development Plan. Here we discuss the implications for labour supply of this forecast. Since this is not the only possible scenario for the medium term, later we consider the implications of lower and higher growth rates.
2.21 The ReviewÕs Central Forecast sees a slowing in the growth rate of GNP from 6.7% per annum between 1995-2000 to an average of 5.1% between 2000 and 2005. It forecasts a corresponding fall in the rate of growth in employment, from 4.4% in the last five years to 2.1% over the next five years. Calibrating these forecasts to the latest Quarterly National Household Survey (QNHS) data for March-May 2000 suggests that employment will increase by 176,000 in the five-year period 2000-2005.
2.22 One of the most remarkable features of the recent boom is that unemployment has continued to fall further than many commentators thought possible. While the unemployment rate can probably fall further in the short-term, it is impossible to determine exactly what will happen over the medium-term. If the unemployment total were to remain unchanged, the unemployment rate would in any case fall to 3.9% by 2005. Higher or lower unemployment would respectively increase or decrease the pressure on labour supply. However, a significant increase in the unemployment rate could only occur because of a downturn in the economy, thus changing the overall scenario. Here, for simplicity, we assume no change in the number of unemployed over the period.
2.23 Given our unemployment assumption, meeting the demand for labour would require that labour supply increase by the same amount as employment i.e. 176,000 or roughly 35,000 per year on average. It is important to remember here that the factors underpinning IrelandÕs recent exceptional labour supply growth, i.e. natural increase, increased participation and net immigration, will continue to operate in the years ahead.
2.24 In the CSOÕs latest population projections, the population of working age is expected to increase to 3.15 million by 2005 (CSO, 1999). This projection assumes net immigration of approximately 15,000 per annum over the
Section II - Labour Market Assessment
period.5Taking this forecast as given, the overall participation rate would
have to increase from 58.9% in 2000 to 61% by 2005 to match forecast employment expansion. Lower (higher) participation would necessitate higher (lower) immigration than that assumed by the CSO. Clearly, the evolution of participation rates over the medium term is one of the key factors determining the labour supply challenge.
2.25 In recent years, participation rates have increased more rapidly than expected. Both the CSO and ESRI had forecast a participation rate of 59% for 2005, and as we have seen, this has already been achieved. In the absence of updated forecasts, it is only possible to speculate on what will happen over the medium-term. However, participation rates can be expected to continue their increase. As the rate of increase required for participation to reach 61% by 2005 is considerably lower than that achieved in recent years, it seems likely that growing participation will continue to meet a large part of labour supply requirements. There remains considerable scope for policy to influence outcomes in this area.
2.26 What are the implications of this assessment for immigration requirements? Based on the ESRI forecasts for employment outlined earlier, the
Government has estimated that some 200,000 workers or a gross immigration total of 336,000, would be required to meet labour supply needs over the seven-year period from 1999 to 2006.6This represents annual
gross immigration of around 48,000 per annum. (As the estimated requirement was front-loaded in the first year, the requirement for 2000-2005 was 46,400 per annum). These estimates are not dramatically higher than the level of gross immigration recently achieved which has averaged 44,400 per annum since 1996 (See Table 2.4).
2.27 In addition, the assumptions underpinning this calculation, while not unreasonable, tend to support an estimate of the immigration requirement that is at the higher end of the plausible range. For example, it assumes unemployment remaining constant at 95,000 through to 2006, which seems high, as we have seen above. Second, it assumes gross emigration of 27,000 per annum over the period. Again, this may be on the high side as
32
Forum Report No. 19 - Alleviating Labour Shortages
5 See ÔPopulation and Labour Force Projections 2001 - 2031ÕCSO July 1999. The higher migration assumption (MI) used here sees a gradual decline in net immigration over the period as follows: 1996-2001: +20,000 per annum; 2001-2006: +15,000 per annum; 2006-2011: +10,000 per annum.
emigration has fallen in recent years. Thus, for example, since 1996 gross emigration has averaged around 25,000 per annum (see Table 2.4). Third, it assumes that migrantsÕ labour market participation rates are in line with overall participation. Higher participation assumptions (in line for example with the age and/or education profile of migrants) would tend to lower the immigration requirement.7Finally, overall assumptions about participation in
the economy as a whole may also prove an underestimate as we have seen above.
2.28 Clearly, an update of these forecasts is required for planning purposes. In the meantime, it seems reasonable to conclude that fairly modest increases in participation rates relative to recent experience would mean that no significant increase in immigration would be necessary to meet the labour supply requirements implied by the ESRI Central Forecast. However, as both the CSO and the ESRI have forecasted immigration as declining over the medium term, maintaining present levels may still present a challenge.
2.29 We should emphasise that this broad conclusion refers to the employment scenario implied by the ESRI Central Forecast outlined above. What happens if growth diverges from this forecast? A range of external and/or domestic factors could bring about lower than forecast growth. If growth falls below the above forecast, the required labour supply will likely also fall.
2.30 More important for our purposes here is the possibility of higher growth than that forcast by the ESRI. It is already evident that growth in the current year will be higher than expected. Since the beginning of the boom forecasts have generally underestimated the rate of expansion and this could happen again. Assuming growth in productivity remains as predicted in the Central Forecast, any increase in the growth rate would be directly reflected in the rate of employment growth. We have estimated that adding one quarter of a percentage point to the annual rate of growth of employment would mean that employment over the five years to 2005 would increase by 198,000 rather than 176,000. Adding half a per cent would produce 221,000 jobs and a one per cent increase would result in 268,000 jobs over the period. Based on the projected working age population of 3.15 million in 2005, and assuming no change in unemployment as in our discussion of the ESRI
Section II - Labour Market Assessment
33
scenario, these figures would require participation rates in 2005 of 61.7%, 62.4% and 63.8% respectively. Again, lower participation rates would require higher immigration.
2.31 In such a higher growth scenario the labour supply challenge would clearly be much greater. However, without updated medium-term forecasts for growth and participation, it is simply not possible to quantify overall labour requirements. What we have presented here is an illustrative scenario. Given recent concerns about overheating, it is not clear how feasible any higher growth scenario might be. While the rate of growth in labour supply is one of the determinants of the growth rate, other factors such as infrastructural constraints may make higher growth over this period unsustainable. This raises issues of macroeconomic analysis and planning that remain the subject of considerable debate.
2.32 It also raises broader societal questions about the appropriate strategic objectives of economic and social policy over the medium-term. It is now widely acknowledged that job-creation per seis no longer the appropriate overriding objective of national policy. However, it is not clear what strategic objective, if any, should replace it. The authors of the ESRI Quarterly Economic Commentary have recently suggested that:
ÒDevelopment can be interpreted as qualitative increase in economic well-being in contrast to the quantitative increases implied by growth. It is clear that an economy many need to grow in order to develop, but there comes a point when continued growth can be at the expense of developmentÓ. (McCoy, Duffy and Smyth, 2000)
Expanding the Workforce
2.33 According to the Expert Group on Future Skills Needs: ÒAppropriate responses to general labour shortages aim to expand the overall supply of labour in the economy. Such responses could include attracting new entrants into the labour market, seeking to encourage those who have left the labour force to rejoin, increasing the hours worked by the existing workforce, assisting the unemployed to gain jobs, and raising immigration to augment the domestic labour supply.Ó(2000:21) It is the last of these options Ð that of policies to raise immigration Ð that has received most attention in recent public debates.
34
2.34 We have already seen that without updated medium-term forecasts for growth and participation, it is not possible to quantify overall labour
requirements. We suggested earlier that it seems reasonable to conclude that fairly modest increases in participation rates would mean that no significant increase in immigration would be necessary to meet the labour supply requirements implied by the ESRI Central Forecast. However, over the medium-term, even relatively small increases in the annual growth rate above that forecast would imply a much greater challenge to participation and/or to immigration policy.
2.35 The relative emphasis to be given to immigration or participation policies is an important policy question in its own right. Recently the ESRI has warned that immigration to date, by adding to population growth, has increased pressure on infrastructure, particularly in terms of demand for housing. Given supply constraints, this has added to house price inflation.
Immigration flows are driven in the first instance by the performance of the economy rather than by Government policy and this will continue to be the case. However, the additional costs associated with increased immigration over the short to medium-term suggest some caution in actively pursuing expansion of the labour supply in aggregate terms from this source. It is important, therefore, to emphasise that considerable potential remains for mobilising domestic labour supply. This, the central theme of our Report, is addressed in Sections III Ð VII. Immigration policy does, however, have an important role, particularly in meeting specific skill shortages and we discuss this in more detail in Section VIII.
Section II - Labour Market Assessment
Section III
Employment
and
Employment and
Non-Employment
3.1 While Irish participation and employment rates have increased among men and especially among women, many adults remain outside the labour force. Identifying those population groups with significantly lower than average employment rates highlights where there may be potential for additional labour supply from domestic sources. In this Section, we compare Irish employment rates8with those of other EU countries and present a
breakdown of employment rates within the Irish population. We then briefly report the main findings of recent Irish econometric analysis of labour force participation.
Ireland in Europe
3.2 Achieving a significant increase in the employment rate is a central objective of the European Employment Strategy. At the EU Summit in Lisbon in March of this year, Member States agreed an overall objective of raising the employment rate from an average of 61% (1998) to Òas close as possible to 70% by 2010 and to increase the number of women in
employment from an average of 51% today to more than 60% by 2010.... Member States should consider setting national targets for an increased employment rateÓ(Presidency Conclusions).
3.3 Earlier (Table 2.2) we reported employment rates for Ireland calculated for the population aged fifteen years and over, in line with national practice.9It
is therefore important to note here that the EU targets quoted above and all comparisons presented in this sub-Section are calculated for the Ôworking age populationÕ aged between fifteen and sixty-four. This excludes from the comparison, differences arising both from cross-country differences in participation among older people (which in general are not very large) and differences in the proportion of the adult population that is elderly (which are more significant).
39
8Comparisons of labour market activity may be based on a number of measures. Here we use the
employment rate rather than the participation rate or any other measure. The main effect is that a country or population group with lower unemployment such as Ireland will compare more favourably than if the participation rate is used. This should be kept in mind in the following discussion.
3.4 Much of the debate on European employment rates has been motivated by comparisons with other OECD countries, especially the US.10In 1973,
overall employment rates in the US and in OECD Europe were equal at 65%. By 1998, the US rate (74%) exceeded the European rate (60%) by fourteen percentage points, reflecting increased divergence in both
unemployment and participation. Female employment rates account for two thirds of this gap. Over this period, womenÕs employment rate increased from 43% to 49% in Europe and from 48% to 67% in the US. Back in 1973, the male employment rate in Europe, at 87%, exceeded the US rate of 83%. By 1988, the European rate had fallen to 72% while the US rate was 81%.
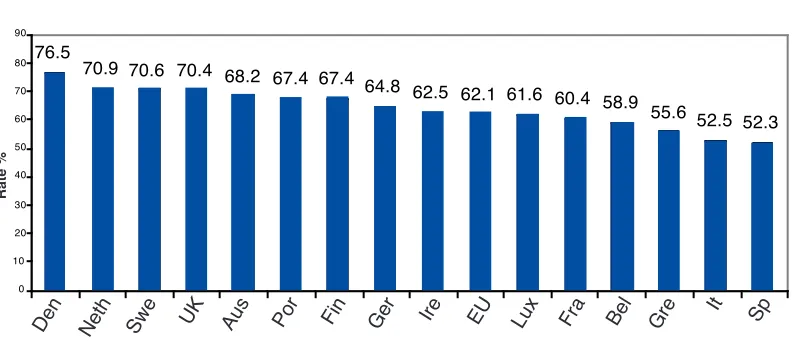
3.5 The latest EU Labour Force Survey (Eurostat 2000) shows that within the EU in April 1999, national employment rates diverged widely from 76.5% in Denmark to 52.3% in Spain.11IrelandÕs rate at 62.5 % (in 1999) was
marginally above the overall EU rate12of 62.1%, ranking ninth of fifteen EU
[image:34.595.101.499.381.557.2]Member States (Figure 3.1).
Figure 3.1: Employment Rates in EU, 1999.
Source: EU Labour Force Survey, 1999 (Eurostat 2000)
3.6 Male employment rates vary from 81.2% in Denmark to 67.1% in Italy (Figure 3.2). Ireland, at 73.6%, ranks seventh. Among prime age men (25-49), employment rates are closely grouped in a ten percentage point range between 84.5% in Finland and 93.8% in Luxembourg. IrelandÕs rate
40
Forum Report No. 19 - Alleviating Labour Shortages
10 Data in this paragraph from Freeman, 2000.
11 All EU comparisons in this sub-Section are from the EU Labour Force Survey for April 1999 (see Eurostat, 2000).
12 Note that EU rates refer to employment rates calculated by Eurostat for the EU as a whole, rather than the mean of national employment rates. Given the above average population size among the low employment countries, the EU rate is typically below the country mean.
76.5
70.9 70.6 70.4 68.2 67.4 67.4
64.8 62.5 62.1 61.6 60.4 58.9
55.6 52.5 52.3
0 10 20 30 40 50 60 70 80 90
Den Neth Swe UK Aus Por Fin Ger Ire EU Lux Fra Bel Gre It
Sp
of 87.5% ranks eighth. Among younger (15-24) and older (50-64) men, employment rates diverge much more widely between Member States. IrelandÕs rate of 49.8% for younger men ranks fifth and lies midway in the range between DenmarkÕs 69.5% and BelgiumÕs 27.5%. Among older men, the Irish rate of 69.5% ranks fourth in the EU and lies close to the top of a range running from 74.6% in Sweden to 51.1% in Belgium. IrelandÕs
[image:35.595.101.502.238.414.2]relatively high rate here reflects in part the influence of high participation of older men in agriculture.
Figure 3.2: Male Employment Rates in EU, 1999.
Source: EU Labour Force Survey, 1999 (Eurostat 2000)
3.7 Female employment is the main factor in the divergence of Member StatesÕ employment rates. Female employment rates vary widely from 71.6% in Denmark to 37.3% in Spain (Figure 3.3). IrelandÕs rate of 51.4% is just below the EU rate (52.6%) and ranks tenth.
Figure 3.3: Female Employment Rates in EU, 1999.
Source: EU Labour Force Survey, 1999 (Eurostat 2000)
Section III - Employment and Non-Employment
41
81.2 80.3
76.9 76.7 75.7 74.4 73.6 72.4 72.1 71.6 71.6 70.2 67.8 67.5 67.5 67.1
0 10 20 30 40 50 60 70 80 90 100
Den Neth UK Aus Por Lux Ire Ger Swe EU Gre Fin Sp Bel Fra It
71.6 68.9
64.6 63.7 61.3
59.7 59.6 57.1 55.6
52.6 51.4 50.2 48.5
40.3 38.1 37.3
0 10 20 30 40 50 60 70 80 90
Den Swe Fin UK Neth Aus Por Fra Ger EU Ire Bel Lux Gre
It Sp
Rate %
[image:35.595.97.505.550.707.2]3.8 With regard to female employment in particular, the usefulness of the EU rate as a benchmark for the performance of individual Member States is questionable. This is particularly clear when we focus on prime age women alone. Here IrelandÕs (and LuxembourgÕs) employment rate of 63% occupies a position between a group of three countries with very low rates (Spain, Italy and Greece with rates from 50% to 54%13) and the ten remaining
countries where rates range upwards from 69% in France to 80.5% in Denmark. Arguably, the relevant challenge for Ireland is to join the high employment countries rather than simply match the EU rate.
3.9 The pattern of rates for younger women is similar to younger men. IrelandÕs rate of 43% for younger women ranks sixth and lies midway in the range between DenmarkÕs 63% and ItalyÕs 21%. Among older women, the Irish rate of 32.8% ranks tenth in the EU, between ItalyÕs 22.5 % and SwedenÕs exceptional 70.6%.
[image:36.595.98.493.493.630.2]3.10 Finally, it is useful to compare countries in terms of employment equality, rather than simply in terms of overall rates. We do this by ranking countries on the ratio of female to male employment rates (Figure 3.4). IrelandÕs female to male ratio is 70%, placing us eleventh in the EU. Again, the divergence among countries is striking, ranging from 53% in Spain to 94% in Sweden.
Figure 3.4: Ratio (%) of Female to Male Employment Rates, 1999.
Source: EU Labour Force Survey, 1999 (Eurostat 2000)
42
Forum Report No. 19 - Alleviating Labour Shortages
13These three countries also have very low employment rates among younger (15-24) and older (50-64) women.
96 92
88 85
83 79 78
77 76 74 73 70
65
57 56 55
0 20 40 60 80 100 120
Swe Fin Den Fra UK Por Aus Ger Neth Bel EU Ire Lux It Gre Sp
3.11 In summary, IrelandÕs rapid employment growth in recent years has brought an improvement in our employment rate relative to other Member States and this trend is likely to continue over the medium-term. Nevertheless, a
comparison with other EU countries suggests that there remains
considerable potential for expanding the workforce by increasing rates of employment participation, particularly among prime age and older women.
Disaggregating Irish Employment Rates
[image:37.595.101.501.496.645.2]3.12 In this sub-Section, we look in more detail at employment rates in Ireland. The data are from special tabulations of the CSOÕs Quarterly National Household Survey, March to May 1999, unless stated otherwise. Figure 3.5 plots male and female employment rates by age. Note that, in this and the next figure, the base used for calculating employment rates is the relevant population aged 15-64, excluding students. We use this narrower base as it gives a clearer picture of the impact of age and educational level per seon labour market participation. Broadly, both male and female rates fall with age. The only exception here is among younger men where the employment rate for those aged 25-34 is higher than for the under 25s. While the overall pattern is similar, female rates are lower than males at all ages and the decline is much more marked among women than among men, particularly in the initial child-bearing years.14
Figure 3.5: Male and Female Employment Rates by Age, 1999.
Source: CSO Quarterly National Household Survey, March to May 1999, special tabulation.
Section III - Employment and Non-Employment
43
14 Note that while we refer to rates declining with age, these data only provide a snapshot of the population at a particular point in time.
86 90 88 82
62 79
71
58
47
26
0 20 40 60 80 100 120
15-24 25-34 35-44 45-54 55-64
Age
Male Female
3.13 Figure 3.6 plots male and female employment rates by educational level. As will be noted, employment rates increase with educational level for both men and women. Female rates lie below male rates across the education spectrum and show a consistent increase across that range. At higher educational levels, male employment rates increase more slowly as they begin to approach something like Ôfull participationÕ. As a result, the disparity between male and female rates narrows at higher educational levels.
Figure 3.6: Male and Female Employment Rates by Education, 1999.
Source: CSO Quarterly National Household Survey, March to May 1999, special tabulation.
3.14 WomenÕs employment rates are lower than menÕs at all educational levels and at all ages. Broadly these differences decrease with successively higher levels of education but increase with age. This picture suggests that some additional factor specific to women is present. The main factor here is withdrawal from the labour market following marriage (among older cohorts in particular15) and more generally following the birth of children.16
44
Forum Report No. 19 - Alleviating Labour Shortages
15 Almost from the foundation of the Irish State married womenÕs waged employment was actively
discouraged. The most visible expression of this attitude was the marriage bar that required women to give up their civil service jobs on marriage. Similar provisions were also common in the private sector. The marriage bar was only finally abolished in 1973. Not coincidentally, this was the year Ireland joined the EEC. We joined at a period when equality policy was developing significantly at European level. A Directive on Equal Pay was adopted in 1972 and a wider Equal Treatment Directive in 1976. In Ireland, these Directives gave rise to the Anti-Discrimination (Equal Pay) Act 1974 and the 1977 Employment Equality Act. The recent Employment Equality Act (1998) extends and develops existing legislative provision for gender equality in employment and extends the scope of legislation to prohibit discrimination on a wide range of additional grounds.
16 According to Fahey and FitzGerald "Between 1981 and the early 1990s...the presence of children rather than marriage became the crucial factor affecting participation. In other words, mothers had much lower
participation rates than women who had no children, irrespective of marital status"(Fahey & FitzGerald,
1997:67). 62
84 91 92
95 27 46 65 74 87 0 20 40 60 80 100
Primary Lr. Sec Upr. Sec Non-Univ 3rd Degree+ Level of Education Achi
Male Female
Rate %
3.15 The latest data available on parental status come from the 1997 Labour Force Survey. Figure 3.7 plots female employment rates by parental status and age. Mothers here are women with resident children of any age. The effect of parenthood on womenÕs employment is very evident. Indeed, its impact is even greater than the simple differences in employment rates shown here as mothers are over-represented among those working part-time. The impact of parenthood on overall female employment rates is
[image:39.595.100.500.305.456.2]significantly greater among women in their thirties and older (indicated in the figure by the declining divergence in the rates for ÔfemalesÕ and ÔmothersÕ) because the proportion of mothers in this population is much higher.
Figure 3.7: Female Employment Rates (%) by Age and Parental Status, 1997.
Source: CSO Labour Force Survey, April 1997, special tabulation.
3.16 Among older women, the distinction between mothers and other women is very small. In part, this reflects the independent influences of age and education. However, it is also a function of the definition of ÔmotherÕ in the data. Many older women categorised here as employed and as non-mothers are, in fact, women whose children are reared and no longer resident with them, but who have not returned to the labour market. While this pattern may have a ÔculturalÕ explanation in terms of older womenÕs orientations to paid employment, other factors may also be important. Older women might have caring responsibilities, other than for children, for example caring for parents or other elderly people, for family members with disabilities and so on. In addition, the negative effect on potential earnings of prolonged withdrawal from the labour market, especially at relatively low educational levels, might mean that the return from employment is
insufficient to motivate participation. Specific tax and/or welfare provisions
Section III - Employment and Non-Employment
45 65 51 39 22 46 46 36 21 85 73 51 23 10 30 50 70 90 110
25-34 35-44 45-54 55-64
Age
Females Mothers Non-Mothers
may reinforce this. We return to these issues below.
Econometric Analysis of Participation
3.17 The above outline of labour market data is consistent with the results of multivariate analyses. Callan and Doris (1999) and Callan ed. (2000, Chapter 7) analyse male and female participation using data from the 1994 Living in Ireland Survey. These studies found a small negative effect of age per seon male and female employment up to age fifty-five and a larger effect thereafter. The presence of younger children in the household has a large negative impact on womenÕs employment, as expected. However, teenage children have a small positive effect. This appears to reflect the lower childcare cost of older children, possibly combined with a greater need to earn income to meet the higher costs of maintaining them. It is important to remember here that this refers to the independent effect of older children per se. Other variables (such as Ôyears spent on household dutiesÕ), which at least in part are related to withdrawal from the labour market to have children, continue to have negative effects.
3.18 HusbandsÕ unemployment is another important negative influence on womenÕs participation, reflecting both shared characteristics of spouses and disincentives arising where unemployment payments are assessed on family income. Another interesting finding is that higher numbers of children reduce male participation, (a finding also reported by Murphy and Walsh, 1996). As this effect holds regardless of the age of children, it probably reflects disincentive effects arising from additional Child Dependant Allowances in the social welfare system rather than the demands of childcare.
3.19 Although the models presented by Callan and Doris and Callan ed. do not include education as a variable, earlier studies (Callan and Farrell, 1991) demonstrated its positive impact on both male and female participation arising directly from the impact of education on earnings. Earnings are included as a variable in the later models and have the expected positive effect.
3.20 Married female participation is significantly more responsive to earnings than is that of males. This difference is perhaps the most robust finding in economic analysis of labour supply and participation rates. This is generally
46
Section III - Employment and Non-Employment
47
taken to indicate that the participation decision is largely influenced by economic considerations as opposed to factors such as social attitudes or legal norms (except insofar as such factors operate through their impact on earnings). It is also interesting to note that female labour supply elasticities (i.e. the measure of the responsiveness of participation to a unit increase in earnings) reported in these studies are lower than those of earlier Irish studies. According to the authors, this arises from the considerable growth in female participation that has already taken place.
3.21 While younger children have a strong negative impact on Irish womenÕs participation, there are no representative Irish studies to-date on the impact of childcare costs per se. Research elsewhere generally confirms that the cost of childcare impacts negatively on womenÕs participation, although there is considerable uncertainty about the magnitude of these effects, especially given uncertainty about the role of unpaid care (Blau, 2000; Anderson and Levine, 1999). Recent studies suggest both larger impacts on the participation of lower as against higher skilled women, reflecting the fixed cost character of childcare (General Accounting Office, 1994; Anderson and Levine, 1999) as well as a greater negative impact on
Section IV
The
The Participation
Challenge
4.1 In this Section, following our earlier analysis, we map a broad policy agenda to ensure that effective opportunities for part