
An investigation of aluminium intermetallic phases using
57Fe Mossbauer spectroscopy and complementary
techniques.
REEDER, Andrew J.Available from Sheffield Hallam University Research Archive (SHURA) at: http://shura.shu.ac.uk/20269/
This document is the author deposited version. You are advised to consult the publisher's version if you wish to cite from it.
Published version
REEDER, Andrew J. (2000). An investigation of aluminium intermetallic phases using 57Fe Mossbauer spectroscopy and complementary techniques. Doctoral, Sheffield Hallam University (United Kingdom)..
Copyright and re-use policy
ProQuest Number: 10700914
All rights reserved INFORMATION TO ALL USERS
The quality of this reproduction is dependent upon the quality of the copy submitted. In the unlikely event that the author did not send a com plete manuscript and there are missing pages, these will be noted. Also, if material had to be removed,
a note will indicate the deletion.
uest
ProQuest 10700914
Published by ProQuest LLC(2017). Copyright of the Dissertation is held by the Author.
All rights reserved.
This work is protected against unauthorized copying under Title 17, United States C ode Microform Edition © ProQuest LLC.
ProQuest LLC.
789 East Eisenhower Parkway P.O. Box 1346
Mossbauer Spectroscopy and Complementary Techniques.
Andrew J. Reeder
A thesis submitted in partial fulfilment of the requirements of Sheffield Hallam University for the degree of Doctor of Philosophy.
June 2000
DEDICATION
This work is dedicated to my mum and dad.
Ann, who died suddenly on the 16th January 1999, and Lyle.
“If you can dream - and not make dreams your master; If you can think - and not make thoughts your aim;
If you can meet Triumph and Disaster And treat those two impostors just the same
ACKNOWLEDGEMENTS
I would like to thank the following people for their contributions, whether intellectual, emotional or material, in the production o f this work.
The first people I would like to thank are my supervisors. Dr. Sue Forder for being a constant thorn in my side (meant in the nicest possible way), and Prof. John Brooks who I could never pull the wool over his eyes. Also, everyone at Alcan International, especially Dr. Paul Evans and Dr. Havovy Cama, for providing the materials for this study, and guidance in the intricate world o f solidification.
Next I would like to thank my colleagues. Dr. Julian Hamer and Dr. John Davidson, who were research students at the time I started this work, for introducing me to the
Mossbauer Lab. Between the pair o f them they armed me with enough knowledge about the Mossbauer world in room 820, so that I could take everything in my stride. The
surface studies would not have been in this thesis without the help o f Dr. Mike Rignall, the mountaineer.
That only leaves the technicians. I would like to thank them all for providing materials, and gossip within the School o f Science and Maths at Sheffield Hallam University.
Especially Charlie, for his perseverance with the M ossbauer Laboratory, Kevin Blake, the surface studies bloke from Doncaster. Last, but not least, Nick Lewus for lending me a PC, and also providing hours o f endless sarcasm.
Thanks also to the variety o f colourful characters I have met, while I was working as a doorman in a number o f clubs in Sheffield. They provided me with an education that cannot be taught by any academic. In particular: Jeff Robinson, Roger Bell, Charlotte Akpinar, and Darren ‘M ucker” Bullimore. These people stood by me in quiet, and not so quiet, times.
I would like to mention Darren Wilson and his long time girl friend Alex O ’Dea, for always dragging me away from my studies when I needed it. We shared some hectic, and relaxing, times in a variety o f nightclubs and front rooms in Sheffield and Birmingham. To Darren - no pain no gain! Paul “Faz” Farrell and Richard ‘D ick” Walker should also receive some acknowledgement, for just being long time good friends who believed in me.
A. J. Reeder
A thesis submitted in partial fulfilment of the requirements of Sheffield Hallam University for the degree of Doctor of Philosophy.
Pure intermetallic compounds Al3Fe, AlmFe, AlxFe, a c-AlFeSi, and Al6(Fe,Mn) have been extracted from Bridgman grown model aluminium alloys by dissolving the aluminium matrix in butanol. The resultant transmission Mossbauer spectra for each intermetallic compound were interpreted according to their crystal structure. Variable temperature 57Fe Mossbauer studies have enabled the Debye temperature 6b of each compound to be determined.
The crystal structure of Al3Fe contains five different Fe sites within the unit cell. Four of the iron, Fe(l)-Fe(4), sites are approximately identical and produced a 6b = 434 ± 5 K. The remaining Fe site, Fe(5), produced a 6b = 488 ± 5 K, and the combined spectral areas a 6b = 452 ± 5 K. There is only one individual site within the crystal structures of AlmFe, AlxFe, and Al6(Fe,Mn), which produced a 6d of 358 ± 5 K, 360 ± 5 K, and 352 ± 5 K respectively. The ternary intermetallic
compound, a c-AlFeSi, has two different Fe sites within the unit cell. Fe(l) had a 6b = 297 ± 5 K, and Fe(2) 6b = 329 ± 5 K. The combined spectral areas of these two sites produced a 6b = 311 ± 5 K. The variation in the 6b values was attributed to changes in the Al-Fe shortest bond within the Fe centred A1 polyhedra. The Fe centred A1 polyhedra are a common feature of all the intermetallic compounds studied. The iron atom in all the intermetallic compounds may have existed in a Fe2+ oxidation state.
A Direct Chill-cast ingot was grown and two samples, A and B, were taken from regions within the ingot containing a mixture of two intermetallic compounds. Alloy sample A was found to contain the intermetallic compound combination Al3Fe + Al6Fe. The intermetallic combination AlgFe + a c- AlFeSi was found to exist in alloy sample B. Transmission Mossbauer spectroscopy was
performed on the extracted phases and the insitu phases to determine the relative proportions of the intermetallic compounds within the two alloy samples. Alloy sample A had 50:50 ± 5 % Al3Fe + Al6Fe, whereas alloy sample B had 30:70 ± 5 % Al6Fe + a c-AlFeSi.
Complementary Techniques”, 2000.
CONTENTS
1. INTRODUCTION 1
1.1 DEFINITION OF A LIGHT METAL 1
1.2 PRODUCTION OF ALUMINIUM AND ALUMINIUM ALLOYS 3
1.2.1 THE CASTING OF ALUMINIUM ALLOYS 6
1.2.1.1 FORMATION OF INTERMETALLIC COMPOUNDS DURING DC-CASTING 8
1.3 ALUMINIUM-IRON SYSTEM 17
1.3.1 AlaFe 18
1.3.2 THE METASTABLE STATE 22
1.3.2.1 AlraFe 27
1.3.2.2 AlsFe 29
1.3.2.3 AlxFe 30
1.4 ALUMINIUM-IRON-SILICON SYSTEM 32
1.4.1 an-AlFeSi 34
1.4.2 a c-AlFeSi 39
1.5 MOSSBAUER STUDIES AND INTERPRETATION 42
1.5.1 EARLY MOSSBAUER STUDIES 42
1.5.2 AlaFe 43
1.5.3 AlgFe 46
1.5.3.1 THE PHASE TRANSITION Al6Fe -» Al3Fe 48
1.5.4 AlmFe 49
1.5.5 AlxFe 50
1.5.6 otH-AlFeSi 51
1.5.7 a c-AlFeSi 54
1.5.7.1 TERNARY PHASE TRANSITIONS 55
REFERENCES 57
2.1 INTRODUCTION 62
2.2 THEORY OF THE MOSSBAUER EFFECT 65
2.2.1 THEORETICAL LINE WIDTH OF THE EMITTED 14.4 keV y-RAY 69
2.2.2 RECOIL-FREE NUCLEAR RESONANCE ABSORPTION 71
2.3 EXPERIMENTAL 76
2.3.1 MOSSBAUER y-RAY SOURCE 76
2.3.2 TRANSMISSION MOSSBAUER ABSORBER PREPARATION 78 2.3.3 INSTRUMENTATION USED FOR MOSSBAUER SPECTROSCOPY 80
2.3.3.1 TRANSMISSION MOSSBAUER SPECTROSCOPY 82
2.3.3.2 TRANSMISSION MOSSBAUER SPECTROMETER OPERATION 82
2.3.3.3 y - RAY DETECTION 84
2.3.3.4 THE CRYOGENICS SYSTEMS 87
2.3.3.4.1 THE HELIUM GAS ‘DISPLEX’ CRYOGENIC SYSTEM 87 2.3.3.4.2 THE LIQUID NITROGEN CRYOGENIC SYSTEM 90
2.3.3.5 BACKSCATTER MOSSBAUER SPECTROSCOPY 91
2.3.3.5.1 CEMS MOSSBAUER SPECTROMETER OPERATION 92
2.3.3.5.2 ELECTRON DETECTION 94
2.4 EXPERIMENTAL OBSERVATION OF THE MOSSBAUER EFFECT 96
2.4.1 HYPERFINE INTERACTIONS 97
2.4.1.1 ISOMER SHIFT 98
2.4.1.2 NUCLEAR QUADRUPOLE INTERACTION 101
2.4.1.3 MAGNETIC HYPERFINE INTERACTION 106
2.5 MOSSBAUER DATA ANALYSIS 110
2.5.1 SPECTROMETER CALIBRATION 110
2.5.2 COMPUTER FITTING 112
2.5.3 ANALYSIS OF VARIABLE TEMPERATURE DATA 113
2.5.3.1 TEMPERATURE DEPENDENCE OF THE ABSORPTION AREA, LNAT 114 2.5.3.2 TEMPERATURE DEPENDENCE OF THE ISOMER SHIFT, ISODS 117
2.6 OTHER TECHNIQUES 121
2.6.1 SCANNING ELECTRON MICROSCOPE 121
Complementary Techniques”, 2000.
2.6.3 SURFACE ANALYSIS, SAAES AND SAXPS 122
REFERENCES 124
3. THE PROJECT 126
3.1 BRIDGMAN FURNACE SAMPLES 126
3.2 DC-CAST SAMPLES 127
REFERENCES 128
4 VARIABLE TEMPERATURE MOSSBAUER SPECTROSCOPY 129
4.1 ALLOY PREPARATION 129
4.1.1 THE BRIDGMAN FURNACE 129
4.1.2 BUTANOL EXTRACTION 131
4.1.3 MOSSBAUER ABSORBER PREPARATION 132
4.1.4 Al3Fe 133
4.1.4.1 THE Al3Fe SPECTRUM 138
4.1.4.1.1 DEBYE TEMPERATURE ANALYSIS 140
4.1.4.1.2 RESIDUAL ASYMMETRY WITHIN THE SPECTRUM 143
4.1.4.1.3 OXIDATION STATE 148
4.1.4.1.4 STUPEL CALCULATION 149
4.1.5 AlxFe 151
4.1.5.1 THE AlxFe SPECTRUM 155
4.1.5.1.1 OXIDATION STATE 157
4.1.5.1.2 ASYMMETRY WITHIN THE SPECTRUM 157
4.1.6 AlmFe 158
4.1.6.1 THE AlmFe SPECTRUM 162
4.1.6.1.1 OXIDATION STATE 163
4.1.7 a c-AlFeSi 164
4.1.7.1.1 DEBYE TEMPERATURE ANALYSIS 171
4.1.7.1.2 STUPEL CALCULATION 172
4.1.7.1.3 OXIDATION STATE 174
4.1.8 Al6(Fe,Mn) 175
4.1.8.1 THE Al6(Fe,Mn) SPECTRUM 179
4.1.8.1.1 OXIDATION STATE 182
4.1.9 CONCLUSIONS 183
4.1.10 FUTURE WORK 187
REFERENCES 189
5 DC-CAST INGOT SAMPLES 192
5.1 ALLOY PREPARATION 192
5.1.1 PROCEDURE FOR THE DE-CONVOLUTION OF THE MOSSBAUER SPECTRA
FOR SAMPLE A AND B 192
5.1.2 SAMPLED 193
5.1.3 SAMPLE B 199
5.1.4 RELATIVE PROPORTION OF THE INTERMETALLIC COMPOUNDS WITHIN
SAMPLE A AND B 205
5.2 INITIAL SURFACE STUDIES APPLIED TO ALLOY SAMPLE B (CEMS, SEM, EDS) 209 5.2.1 THE APPLICATION OF CEMS TO THE Al-Fe SYSTEM 209
5.2.1.1 Fe/Al MULTI-LAYERS 209
5.2.1.2 ION IMPLANTATION STUDIES 210
5.2.2 CEMS STUDY OF ALLOY SAMPLE B 213
5.2.2.1 ANALYSIS OF THE CEMS SPECTRA OF ALLOY SAMPLE B 218
5.3 SAXPS AND SAAES 225
5.3.1 FUNDAMENTALS OF THE AUGER PROCESS 225
5.3.1.1 THE AUGER TRANSITIONS 226
5.3.1.1.1 j-j COUPLING 227
5.3.1.1.2 L-S COUPLING 228
Complementary Techniques”, 2000.
5.3.1.2 DEPTH RESOLUTION OF THE AES PROCESS 230
5.3.2 FUNDAMENTALS OF THE X-RAY PHOTOELECTRON SPECTROSCOPY 232
5.3.2.1 DEPTH RESOLUTION OF THE XPS PROCESS 233
5.3.3 SAAES AND SAXPS SPECTRA 235
5.3.3.1 INTERPRETATION OF THE SAAES AND SAXPS SPECTRA
FROM THE UNETCHED SURFACE 239
5.3.3.2 INTERPRETATION OF THE SAAES AND SAXPS SPECTRA
FROM THE KI ELECTRO-ETCHED SURFACE 241
5.4 CONCLUSIONS 243
5.5 FUTURE WORK 249
REFERENCES 250
6 GENERAL CONCLUSIONS 252
7 POSTGRADUATE STUDY 258
7.1 COURSES AND CONFERENCES 258
7.2 PUBLICATIONS 259
CHAPTER 1
INTRODUCTION
The introduction is divided into two parts. The first part is concerned with the general properties of aluminium, and its production from the ore bauxite to the DC casting of commercial alloys. The second part covers the main issues of this thesis, which are: where the common aluminium intermetallic compounds are formed within the aluminium matrix, their crystallographic structure, and finally the Mossbauer interpretation of known aluminium intermetallic compounds.
1.1 DEFINITION OF A LIGHT METAL
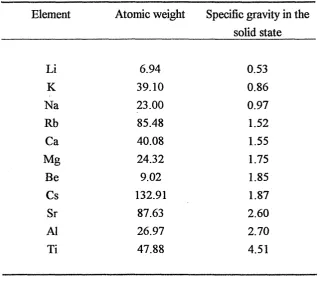
Metals are often divided according to their specific weights into two main classes: the heavy metals and light metals. The dividing line between heavy and light metals is not laid down by any law, but is fixed arbitrarily. However, a specific weight of 3.8 constitutes a suitable dividing line between light and heavy metals, since the specific gravities of all commercial alloys, which can claim to be considered a light metal, lie below this limit.
The term light metal has been traditionally given to both aluminium and magnesium, because they are frequently used to reduce the weight of components and structures. On this basis titanium also qualifies and beryllium should be included, although it is little used in the construction of engineering components. These four metals have a specific gravity ranging from 1.7 to 4.5 which compares with 7.9 and 8.9 for the older structural metals, iron and copper, and 22.6 for osmium, the heaviest of all metals. The other elements in Table 1.1 are lighter than titanium but, with the exception of boron, in the form of strong fibres contained in a suitable matrix, none is used as a base material for engineering purposes. The reason being that all of the other elements are either alkali or alkaline metals, and are far too reactive to even be considered for any engineering purpose.
Complementary Techniques”, 2000.
great stimulus to the development of alloys during the last 50 years. Strength to weight ratios has thus been a dominant consideration, and these are particularly important in engineering design when parameters such as stiffness of resistance to buckling are involved. Concerns with the aspects of weight saving should not obscure the fact that light metals possess other properties of considerable technological importance.
Typically the high corrosion resistance and high electrical and thermal conductivities of aluminium, the machinabilty of magnesium, and the extreme corrosion resistance of titanium [2].
Element Atomic weight Specific gravity in the
solid state
Li 6.94 0.53
K 39.10 0.86
Na 23.00 0.97
Rb 85.48 1.52
Ca 40.08 1.55
Mg 24.32 1.75
Be 9.02 1.85
Cs 132.91 1.87
Sr 87.63 2.60
A1 26.97 2.70
[image:15.617.120.442.234.515.2]Ti 47.88 4.51
Table 1.1 Compilation of the light metallic elements arranged in order of their specific gravities [1].
aluminium. This is due to the remitting of the scrap requires only 5% of the energy needed to produce the same weight of primary aluminium from the ore bauxite [3].
1.2 PRODUCTION OF ALUMINIUM AND ALUMINIUM ALLOYS
As is often the case, the potential military application of this new metal was seized upon by Napoleon the Third, as he foresaw its use in lightweight body armour for his guards. The first commercial preparation of aluminium occurred in France in 1855 when H. Sainte-Claire Deville reduced aluminium chloride with sodium. During the period 1855-59, the price of aluminium per kilogram fell from $200 to $30, and when the aluminium cap was placed upon the top of the Washington Monument in 1884 it was still classed a semiprecious metal. This all changed in 1886, as two independent discoveries by Charles Martin Hall in the United States and Paul Heroult in France led to the development of an economically feasible method for the production of
aluminium by electrolysis.
Aluminium is obtained from bauxite, which is the collective name given to ores usually containing 40-60% hydrated alumina together with the main impurities Fe2C>3, SiC>2,
and TiC>2. The name bauxite originates from the Les Baux, the district in Provence,
France where the ore was first mined. Bauxite is formed by surface weathering of aluminium bearing rocks such as granite and basalt under tropical conditions, and the largest reserves are found in Australia, Guyana, and Brazil. However, immense amounts of aluminium are also present in clays, shales, and other minerals but it is difficult and uneconomic to extract the metal from these resources.
Production of aluminium from bauxite involves two distinct processes that are often operated at quite different locations. The first process is the extraction of alumina,
AI2O3, from bauxite, which is almost exclusively achieved by the Bayer process [4].
Complementary Techniques”, 2000.
Al20 3(5) + 2OH (aq) + 3H20 —> 2^Al(OH)4
J
(aq) Equation 1.1The solution is then diluted with water, and alumina trihydrate is formed, see Equation
1.2:
{Al(OH)4j (aq) + H30 + (aq) -> Al(OH)3(s) + 2H20 Equation 1.2
The final process to form alumina involves the heating of alumina trihydrate at 240°C, see Equation 1.3:
2Al(OH)3(s) -> Al20 3(5) + 3H20(g) Equation 1.3
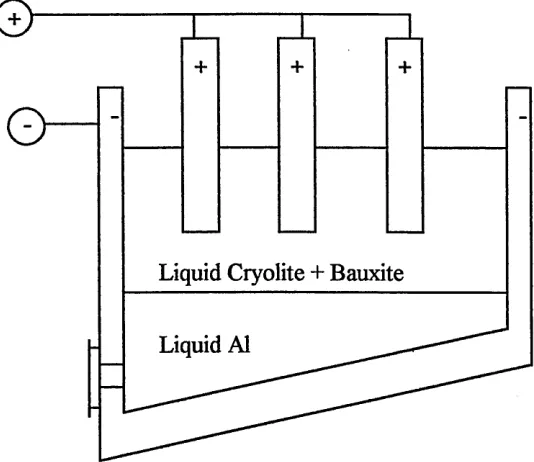
Alumina has a high melting point, 2040°C [5], and is a poor conductor of electricity. The key to the successful production of aluminium lies in dissolving the alumina in
molten cryolite, Na2AlF6, and a typical electrolyte contains 80-90% of this compound
and 2-8% alumina together with additives such as aluminium and calcium fluorides, croylite was first obtained from relatively inaccessible sources such as Greenland, but it is now made synthetically.
Liquid Cryolite + Bauxite
[image:18.612.147.414.59.290.2]Liquid A1
Figure 1.1 Schematic cross section from a multi-anode aluminium production cell.
The exact mechanism for the electrolyte reaction in the cell is uncertain, but it is probable that the current carrying ions are: Na+, A1F4‘, A1F63‘, and one or more
complex ions such as AIOF32". At the cathode it is probable that the aluminium fluoride ions are discharged to produce aluminium metal and F ions while, at the anode, the
complex ions dissociate to liberate oxygen which forms CO2. The summary of the
reactions that occur within the cell are shown below in Equation 1.4-1.6:
Oxid\3^C(s) + 20 2~ —> C02 (g)+ 4e~
J
Equation 1.4Refif:4|^4/3+ + 3e~ —» Al{p^ Equation 1.5
Complementary Techniques”, 2000.
1.2.1 THE CASTING OF ALUMINIUM ALLOYS
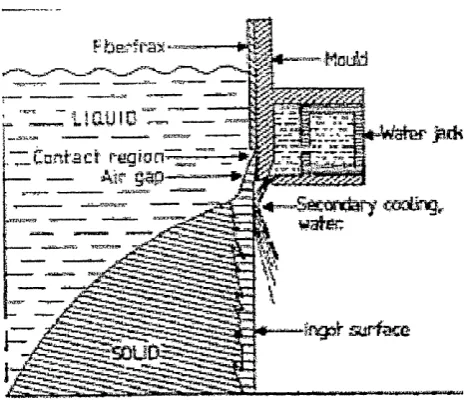
The most common industrial method for producing aluminium ingots is the Direct Chill (DC) casting process, as it promotes a uniform ingot structure. Most commonly, the vertical process in which the molten alloy is poured into one or more fixed water cooled moulds having retractable bases casts ingots. The actual solidification process can be summarised as follows:
The outer skin solidifies in direct contact with the water cooled mould. Solidification shrinkage causes loss of thermal contact between the mould and the solidified material, with an accompanying decrease in solidification rate. Secondary cooling becomes effective a few millimetres below the mould, causing a rapid increase in solidification rate. Due to an increasing path length for heat transport, there is a gradual lowering of the solidification rate towards the ingot centre [6].
iiaum
Caniaci' mg 'wri
— . Aj t
§3p-Fig 1.2 Cross section of a DC casting process
Note: The author apologises for the clarity of the image. This was due to the poor quality of the original image
[6].
The aluminium and aluminium alloys that are produced are classified in the following manner:
Aluminium (99.0% min. and greater) - lxxx
Aluminium alloy groups (by major alloying element) Cu - 2xxx
Mn - 3 xxx
Si - 4xxx
Mg - 5 xxx
Mg+Si - 6xxx
Zn - 7 xxx
Other elements - 8xxx
Unused elements - 9xxx
[image:20.616.167.402.80.280.2]Complementary Techniques”, 2000.
when expressed to the nearest 0.01%. The second digit in the designation indicates modifications in impurity limits, or alloying elements. When the second digit is zero it indicates unalloyed aluminium having natural impurity limits. In the groups 2xxx to 8xxx the last two digits in the designation have no special significance, and are only used to identify different alloys in the group. The second digit indicates modifications to the alloy, and thus if the digit is zero it indicates the original alloy.
1.2.1.1 FORMATION OF INTERMETALLIC COMPOUNDS DURING DC- CASTING
Commercial purity Aluminium and aluminium based alloys usually contain a certain amount of Fe and Si. These elements are present either as unwanted impurities, or they are added deliberately to provide special material properties. The way that the Fe and Si is distributed in the as cast material depends strongly upon the solidification rate during casting. An extreme example is provided by splat quenching and related techniques, which allow solid solutions to be formed even when the Fe content is several wt. % [5].
Process Solidification rate, °C s'1
Hunter engineering 200-700
Pressure die casting 20-80
DC casting 0.5-20
Book mould casting *0.1
Shell mould casting «0.01
Table 1.3 Solidification rates for several industrial processes [7].
the grain boundaries and between the dendrite arms. Nevertheless, taking into
consideration that the solidification rates in industrial casting processes varies by 5 to 6 orders of magnitude (Table 1.3), it is not unexpected that large microstructural
differences are observed depending upon the casting method used.
When a pure metal solidifies crystal begins to form independently from a nucleus, or centre of crystallisation. The nucleus will be a simple unit of the appropriate crystal lattice, and from this the crystal will grow. The crystal develops by the addition of atoms according to the lattice pattern it will follow, and rapidly begins to assume in visible proportions, what is termed as a dendrite. These forms of crystal skeleton act like a backbone, and from which secondary and tertiary arms begin to sprout in a rigid geometrical pattern. There are several theoretical models that exist to predict the primary dendrite spacing in a steady sate unidirectional solidified alloy [8-13], which can be defined by:
AjG = K, Equation 1.7
where A/ = is the primary dendrite spacing,
Ki = is a function of a the alloy concentration,
G = is the thermal gradient across the alloy,
V= is the growth velocity of the alloy.
Complementary Techniques”, 2000.
If the metal is pure then no evidence of dendrite growth will be seen once solidification is complete, since all the atoms are identical. However, commercial purity A1 and Al- based alloys contain Fe and Si as the main impurities, or they can be added deliberately to provide special material properties. These impurities are present in the final part of the liquid to solidify, due to their low solid solubility in aluminium, see Table 1.4.
Element Solid Solubility
wt % at %
Fe 0.052 0.025
Si 1.65 1.59
Mn 1.82 0.90
Cu 5.65 2.48
V 0.6 0.32
[image:23.616.138.354.172.393.2]Cr 0.77 0.40
Table 1.4 Solid solubility of some elements in A1 [14].
The rate at which a molten metal is cooling when it reaches its freezing point affects the size of the grains that form. A slow fall in temperature, which leads to a small degree of undercooling at the onset of solidification, promotes the formation of relatively few nucleation points, and the resultant grains will be large. Rapid cooling, on the other hand, leads to a high degree of undercooling being attained, and the onset of solidification results in a large number of smaller grains.
thus the grains towards the centre of the ingot will be larger [6a], This variation of grain size, and thus the variation in secondary dendrite spacing, with the solidification rate across the ingot was investigated by Westengen [6], and a expression was
evaluated for an alloy containing 0.30 wt% Fe and 0.11 wt% Si:
v = 3.57 x 10⁴.<T2-56 Equation 1.8
where v = solidification rate
d = secondary dendrite spacing
A further effect of the relatively rapid solidification rates observed in DC casting is a change in the types of intermetallic particles found. Some of these changes can be explained based upon the phase diagram. However, this method is limited by the fact that metastable phases can occur as a result of the high solidification rates [7,15], The solidification rate varies substantially across the thickness of an industrially processed ingot, and thus the distribution of the different types of intermetallic phases will vary. In the early 1950s Altenpohl [16,17] observed some peculiar patterns on ingot cross sections, which were treated in a ferrous chloride etching reagent. The interior of the ingots showed different etching characteristics compared with the outer part. It was also noted that these zones reacted differently towards sulphuric acid anodising. The internal zone was termed “fir-tree”, due to its appearance. It has been suggested that the differences in etching characteristics are caused by different types of intermetallic compound [18].
In a study by Westengen [6] a commercial purity aluminium ingot was cast at 100 mm min.'1, with a chemical composition corresponding to a AA1050 alloy, Al-0.25 wt% Fe
0.13 wt % Si, by the level pour method [19], and was grain refined using AlTi5Bl.
Complementaiy Techniques”, 2000.
diffraction and energy dispersive X-ray analysis. A summary of the observed phases is given in Table 1.5.
However, the distribution of the phases varied according to what region was examined. In the outer zone otT and AlmFe dominates, with a trace level of etc, and in the inner zone Al<sFe and AlxFe dominates, with trace levels of Si, Pm, and Al3Fe.
The following solidification sequence would be expected, which can be used to predict the formation of intermetallic compounds during rapid solidification. This sequence takes into account the alloys tendency for microsegregation [6]:
1. As the temperature of the liquid is lowered below the liquidus, A1 with some Fe and Si in solid solutions forms, with an accompanying enrichment of the melt until the
eutectic valley liq—>A1 + Al3Fe is reached.
2. The above reaction is suppressed by the rapid solidification and the liquid composition follows the eutectic valley until it reaches the peritectic point liq + Al3Fe—»A1 + etc. 3. At sufficiently high solidification rate the composition of the remaining liquid reaches a
second liq + etc—>A1 + p.
Phase Structure Lattice Parameters nm
Main Elements
Ref.
A1 fee a = 0.404 A1 [5]
ac bcc a =1.256 Al,Fe,Si [20]
CtH hexagonal a =1.23
c = 3.70
Al,Fe,Si [21]
CXt tetragonal a =1.23
c = 3.70
Al,Fe,Si [6]
Al3Fe monoclinic a =1.549 Vp = 107°
b = 0.808 c= 1.247
Al,Fe [22]
AlgFe orthorhombic, c-centred
a = 0.649 b = 0.744 c = 0.879
Al,Fe [23]
AlmFe tetragonal,
body centred
a = 0.884 c = 2.16
Al,Fe [7]
AlxFe unknown defect structure Al,Fe [6]
Pm monoclinic a = 0.89 VP = 92°
b = 0.49 c = 4.16
Al,Fe,Si [6]
Si fee a = 0.542 Si [5]
Table 1.5 Summary of observed phases by Westengen [6].
Complementary Techniques”, 2000.
The investigated samples from this study were taken from regions 15 mm from the surface with an estimated solidification rate of 10°C s'1, and 50 mm from the surface, with a solidification rate approximately 5°C s'1. That compared well with the phase distribution found within the foils, and the published information.
High temperature annealing of the foils for 5 hours at 590°C eliminated the presence of the “fir-tree” zones after caustic etching. The main change in the phase distribution was that the dominant metastable phase AIJFe in the outer region transformed to Al3Fe, and the dominant metastable phase A^Fe also transformed to Al3Fe. It implies that the different etching characteristics displayed across the ingot were attributed to the presence of AlmFe and AkFe.
Intermetallic Solidification rate, °C s'1 Ref.
AlmFe / Al9Fe2 > 10 [7, 15, 24,25]
AleFe 1-10 [7,15,24]
AlxFe 0.5-5 [25]
Al3Fe <1 [7,15, 24,25]
Table 1.6 Solidification regimes to form different intermetallic compounds.
Ping Liu et al [27] also performed an investigation on three DC-cast Al-Fe-Si alloys,
with an emphasis being placed upon the role of solidification rate, iron content, and alloy purity (presence of trace elements) in determining which aluminium intermetallic
phases appear in as-cast structures. Two alloys had an Fe content of «0.25 wt % and
«0.50 wt %, and an Si content of «0.125 wt %, giving an Fe/Si weight ratios of 2 and 4, and they were prepared from commercially pure aluminium. The main trace elements present were Mn, V, Zn, Ca, and Cu. The third alloy was prepared from high purity
aluminium 99.99 wt % Al, and 0.25 wt % Fe - 0.125 wt % Si were added to the melt.
The alloys were cast, and sample foils were taken from positions within the ingot corresponding to a solidification rate of approximately 10°C s'1 and 1°C s'1.
The usual aluminium intermetallics were found in the sample foils by selected area electron diffraction: Al3Fe, ac-AlFeSi, Al6fe and AlmFe. These were consistent with the results by both Westengen [6] Per Skjerpe [26]. However, three additional phases were also discovered, and are summarised in Table 1.7.
The intermetallic phase observed in the alloy containing a Fe/Si ratio = 4, at the slower solidification rate, was Al3Fe. At the higher solidification rate six different intermetallic phases were observed, but predominantly Al3Fe and AlpFe were discovered on the grain boundaries. The remaining phases were only present as isolated precipitates, in small volume fractions. After annealing both the samples at 600°C for 24 hours the only remaining phase was Al3Fe.
Complementary Techniques”, 2000.
Phase Structure Lattice Parameters nm
Main Elements
AlpFe bcc a =1.03 Al,Fe
qi orthorhombic,
c-centred
a =1.27 b = 3.62 c = 1.27
A, Fe, Si
Q2 monoclinic a =1.25 Vp = 109°
b = 1.23 c = 1.93
A, Fe, Si
Table 1.7 Summary of the additional phases discovered Ping Liu et al [27].
The high purity alloy, with a Fe/Si ratio = 2, contained only Al3Fe at the slower solidification rate, but at the higher solidification rate the dominant intermetallic phase was occ-AlFeSi, with low levels of Al3Fe and AlpFe. However, after annealing, again at 600°C for 24 hours, the only intermetallic phases present were Al3Fe and ac-AlFeSi, at the slower and higher solidification rates respectively.
1.3 ALUMINIUM-IRON SYSTEM
It has already been stated that Fe is the dominant impurity in commercial grades of aluminium, as it is often unintentionally added through the use of steel tools for melting and casting. However, in some alloys of aluminium iron is often added intentionally, and amongst the most common is the Al-Cu-Ni group as it increases the high
temperature strength. Fe is also added to the Al-Fe-Ni alloys, to increase the corrosion resistance of the material in steam at elevated temperatures, and the most common example of all is household foil, where 1-1.5% Fe is added to the aluminium to
increase the strength of the material. These are just three examples where the addition of Fe is of benefit, where there are many.
AtSbFe 50 30 20 40 1400 2000 Liq. 1600 1200 1600 1**3
Liq.+ F sAI
Liq.
1400
1000
1.8% 928°K
J12Q0 -6 .0 4
Complementary Techniques”, 2000.
In the liquid state aluminium-iron alloys show clustering, which decreases from the melting point up to about 50 K above it. After that the atomic distribution becomes
random [31]. There is a eutectic, Al-Al3Fe, which is found at the aluminium rich end of
the equilibrium phase diagram, see Figure 1.3, at 928 K, with a probable composition within the range 1.7%-2.2% Fe [32]. The uncertainty of the eutectic position results from nucleation difficulties, which favour a divorced eutectic. The equilibrium solid solubility is in the order of 0.03%-0.05% at the eutectic temperature [33, 34, 35], and it decreases to values in the order of O.OOx at 700 K [36,37]. However, by rapidly quenching the liquid supersaturated solid solutions can be produced, containing up to
approximately 8% Fe [38, 39], in which the iron atoms are not randomly distributed
but clustered [40,41].
1.3.1 Al3Fe
The phase in equilibrium with aluminium is usually designated Al3Fe, or Ali3Fe4, which
forms directly from the liquid at 1420 K [42], and not by a reported peritectic reaction
[32]. Black [43, 44] first proposed the correct structure of Al3Fe, and it was
determined to have a monoclinic unit cell, space group C2/m, with 100 atoms per unit cell. The unit cell parameters were found to be: a = 15.849A, b = 8.0831A, c = 12.476A, and P = 107.74°. However, previous studies [45, 46, 47], using single crystals, had reported that the unit cell was orthorhombic. This more symmetrical pseudo-symmetry can be attributed to the fact that the compound has a strong tendency to twinning [43].
The actual structure of Al3Fe can be described in terms of alternate puckered and fiat layers of atoms perpendicular to the b-axis, see Figure 1.4. Both layers can be
a puckered layer in between. This structure is summarised as the packing of pentagonal biprisms and skinny birhombohedra [48, 49].
Fig 1.4 Atomic layer arrangements in Al3Fe. (a) puckered layer and (b) flat
layer. Open circles are Al atoms, and filled circles are Fe atoms [53].
This arrangement of atoms produces five different types of Fe sites; four having grossly the same environment while the fifth has a unique environment. Both classes are situated in a symmetry that is less than cubic, see Table 1.8.
The Fe sites 1-4 are arranged as in the 12-fold co-ordination of a close packed structure, and the number is reduced to ten either by missing out two atoms or by
missing out one atom, and by having one atom more than 2.80 A away. However, for
the Fe site 5 with 9 Al neighbours the packing arrangement is different. Fe site 2 has no other neighbours apart from the ten Al atoms, which are in direct contact. The Fe
site 3 and 4 have a Fe atom neighbours at 2.91 A, and 3.01 A respectively, and Fe site
Complementary Techniques”, 2000.
central Fe atom. Fe site 5 has approximately the same mean distance as the Fe site 2, but it has two other Al neighbours at 3.3 A and 3.4 A, and if an allowance is made for the effects of these, it can be said that the mean Al-Fe distance for the 9 Al neighbours is shorter than for the ten Al neighbours.
Fe Site No. of Al-Fe Bonds Al-Fe Bond Length, A
1 1 0 2.429 - 2.839
2 1 0 2.422 - 2.713
3 1 0 2.257 - 2.758
4 1 0 2.400 - 2.754
5 9 2.306 - 2.644
Table 1.8 Summary of the different types of Fe sites [44]. Site 3 has a Fe-Fe bond length of 2.906A, and site 4 has a Fe-Fe bond length 3.005A. The variations in the Al-Fe distances may be explained in terms of stacking effects.
An attempt to determine the electron configuration in Al-rich alloys containing transition metals was undertaken by Black [50]. The conclusion of this study on various alloys was that the geometry of the structures does suggest that there are localised and probably direct bonds between Al and transition metals. Also due to this similarity in Al-Transition Metal bonding there are several iso-structural compounds, for example AI1 3C0 4 [51].
Fig 1.5 Polyhedra co-ordinations for the two different Fe site (a-b), and the Al sites (c-f). Contacts with central atoms are shown by full lines, neighbouring atoms that are not in direct contact are shown by broken lines. Fe atoms are shaded [43,44].
Complementary Techniques”, 2000.
)•
(a)
(b)
O
A
l
• Fe
Fig. 1.6 The stacking of pentagonal biprisms [48].
1.3.2 THE METASTABLE STATE
exist above the transition temperature, and the low temperature phase can similarity exist at temperatures slightly above the transition temperature [55].
This principal can be illustrated by plotting the potential energy of the structure against
some convenient dimension z of the lattice, which increases monotonically during the
transition. A hypothetical plot is shown in Fig. 1.7, where the values of zA and zB of the lattice are the equilibrium values in the initial and final states, at the absolute
temperature.
Lattice dimension
Potential energy
Fig 1.7 Condon-Morse curve illustrating a hypothetical plot of atomic energy against a lattice dimension for a solid undergoing a phase change [54,56].
Since the atoms have random thermal energies, their total energy is higher then Ei or
E2, and thus the mean total energy per atom is EA in one phase and EB in the other, when the temperature of both the phases is identical. The differences Ea-Ej and Eb-E2,
A. J. Reeder, “An Investigation of Aluminium Intermetallic Phases using "'Fe Mossbauer Spectroscopy ana Complementary Techniques”, 2000.
points x,x’ and y,y* on the potential energy curves correspond to the turning points of the vibrating atoms, with the energies Ea and Eb respectively.
The phase change occurs since the energies Ea and Eb are mean values, and if the
energy barrier Ecis not too high there may be atoms with enough energy to surmount
it, and hence make the transition to the state B. Once there, the atoms may lose their energy by collision with neighbouring atoms, so they are then trapped in the potential
well. The energy difference Ec-Ej,in this case, is referred to as the activation energy.
The net phase transition rate is the difference between the two flows of atoms in opposite directions, i.e. atoms changing from state A to state B, and atoms changing
from state B to A. The former rate ta may be defined as the number of atoms which
make the A-B transition in unit time, and the number must be proportional to the following factors:
1. The number ha of atoms in phase A with energies higher than
Ec-2. The frequency with which the atoms approach the barrier.
3. The relative thermodynamic probability of phase B compared to phase A.
The number nA is given by the Boltzmann expression, see Equation 1.9, integrated
over the energy range above Ec, see Equation 1.10, [56].
A. Hie factor C is assumed to be constant in this case, but it depends very weakly upon E.The result is as follows:
Equation 1.9
Equation 1.10
c
n, = — exp-
kT
e c- e x
K kT Equation 1.11
The factor C can be evaluated by extending the range of the integration down to E},
for then the number obtained is equal to the total number of atoms NA in state A.
Therefore:
hence,
C_
kT Equation 1.12
»a = n aexp- EC~ E XkT Equation 1.13
The frequency of the atoms approaching the barrier may be taken to be the frequency
of vibration vA of the atoms in phase A. In most solids this is around 1013 Hz. The final
factor to be evaluated is the thermodynamic probability of phase B relative to phase A.
It will be assumed that the thermodynamic probabilities WA and WB of the phases A and
B can be defined, and that their ratio yields the required relative probability [56].
The rate, rA, at which the phase change occurs is therefore, proportional to the
products of all the factors discussed, and is expressed in Equation 1.14.
WB %T Ec - E x
rA = KvA -^ - Na exp- — ---
-A aWa a F V kT Equation 1.14
K is a constant that is only dependant on the geometry of the interface between the
Complementary Techniques”, 2000.
Equation 1.15
Thus, the net phase transition rate is defined in Equation 1.16.
- J - &
Equation 1.16
However, when the temperature of the solid at the transition temperature, Tt, the two
phases exist at equilibrium, and the net phase transition rate is zero, Equation 1.17.
Consider a example of when the solid discussed in this case is cooled instantaneously from a temperature well above Tt, to a temperature well below Tt. Initially the number of atoms in phase A will be negligible, and the net phase transition rate is then equal to
rB, Equation 1.18.
If the low temperature satisfies the criteria Ec-E2 » kT then the phase transition rate can be regarded to be zero. Thus, by super-cooling the solid very rapidly to a low temperature before the phase transition can begin, it can effectively be halted. The number of atoms able to surmount the energy barrier is reduced to the extent that the high temperature phase appears to be stable. This is the simplified criterion for the formation of metastable phases [56],
Equation 1.17
referring to the Al-Fe equilibrium phase diagram. However, the crystal structure of the main Al-Fe metastable phases present within a DC-cast ingot have been investigated by many authors, and they are: AIJFe, AlxFe, and Al6Fe. Each of these phases will be discussed in detail for this study.
1.3.2.1 AlmFe
The metastable intermetallic phase AlmFe was first discovered by Mikki et al [7], as a
solid precipitate within a DC-cast ingot, with a body centred tetragonal unit cell where
a = 8.84 A and c = 21.6 A. The value of m has been measured by energy dispersive
spectroscopy to be 4.4 [6], 4.2 [26], and 4.0 [58]. However, it was not until 1988 when Skjerpe [57] first proposed a comprehensive crystal structure model for this metastable phase.
The crystals obtained by Skjerpe were formed from a DC-cast Al-0.25 wt% Fe 0.13
wt % Si alloy of commercial purity. Ingot samples were taken from 25 mm,
corresponding to a solidification rate of 6 °C s'1, and 100 mm, corresponding to a solidification rate of 1 °C s'1, from the surface of the ingot. The crystals were extracted
from the aluminium matrix using butanol, using the method described by Simensen et
al [59], and TEM and HREM studies were performed.
The possible structure model was determined, assuming the space group 14/mmm, and it predicted a single Fe site in layers along the (001), separated by two or three layers of Al atoms. The crystal density was not known for AlmFe, but an estimate was used by assuming a crystal density between Al3Fe [43] and AleFe [60], which have densities of
3.77 g cm'3 and 3.45 g cm'3 respectively, and since m = 4.0-4.4 there are 20-22 Fe
Complementary Techniques”, 2000.
1001)
♦
[1001
---Fig 1.8 Possible structure of AlmFe viewed in the <100> direction. Shaded areas represent Fe atoms [57].
A similar study was undertaken by Chandraseken et al [61] on a rapidly solidified
super purity Al-Fe alloy. The unit cell determined was body centred tetragonal, with a lattice parameters of a = 8.89 A and c = 21.5 A, which was in good agreement with reported values [6, 26, 27]. There were no streaks, or super-reflections, observed in the analysis which indicates that the crystals were free from stacking faults and disorder, but these were observed in previous studies [6, 26, 27, 58]. However, the space group obtained was 14/mm, and not I4/mmm as reported [6, 26, 27, 58], and the reason for this could be attributed to the absence of these stacking faults, and disorder, within the Structure.
In all the studies performed upon AlmFe [6, 26, 27, 58, 61] Si is present within the particles, and the morphology is consistent with AlmFe being formed by a metastable eutectic reaction. Thus it is possible that the formation of this particular metastable
o _ o _ o
o o o
o O CD
o o cp
o o o
_ C> O _ CD
o O CD
o o o
o o o
phase may only occur in conjunction with an impurity atom, which stabilises the formation of the phase. In this case Si fulfilled this stabilising role.
1.3.2.2 AleFe
The binary metastable phase A^Fe was first reported by Hollingsworth et al [23], but a
phase change of AbFe was reported by Bradley et al [63] but was never confirmed. A
copper stabilised form of AlgFe, however, has been investigated by Keller et al [64, 65,
66], and was confirmed by Phragmen [67]. Phragmen investigated the aluminium rich comer of the Al-Cu-Fe phase diagram, and assigned the formula (FeCu)(Al6Cu) to the a-phase, and Phillips [68] also drew the same conclusions from his study. The
structure of this phase was refined by Black et al [69] who found that the copper
atoms were evenly distributed amongst the aluminium sites, and the structure was iso- structural with AltfMn [70, 71].
Complementary Techniques”, 2000.
Author Intermetallic
Phase
Unit Cell Parameters, A
Nicol [70] AlfiMn Orthorhombic
Black et al [69]
Hollingsworth et al
[23]
Walford [60]
(FeCu)(Al6Cu) Orthorhombic
AleFe
AlgFe
Orthorhombic
Orthorhombic
a = 6.497 b = 7.552 c = 8.870 a = 6.434 b = 7.460 c = 8.777 a = 6.492 b = 7.437 c = 8.788 a = 6.464 b = 7.440 c = 8.779
Table 1.9 Comparison of the literature values for AfoFe, and its iso-structural compounds.
Within the orthorhombic unit cell there was only one Fe site determined, with 10 Al
atoms surrounding, and having a mean Al-Fe bond length of 2.511 ± 0.056 A.
1.3.2.3 AlxFe
The crystal structure of the metastable phase AlxFe has not been unequivocally established [6, 26]. Westengen [6] partially failed to index the observed diffraction patterns, but suggested that the unit cell was orthorhombic, due to the structure
containing stacking faults. Young et al [25] elaborates on this defective structure, and
atoms is variable, which implies that the lattice parameters can vary over an
appreciable range. However, the structure model Young et al [25] suggest for AlxFe (x
1.4 ALUMINIUM-IRON-SILICON SYSTEM
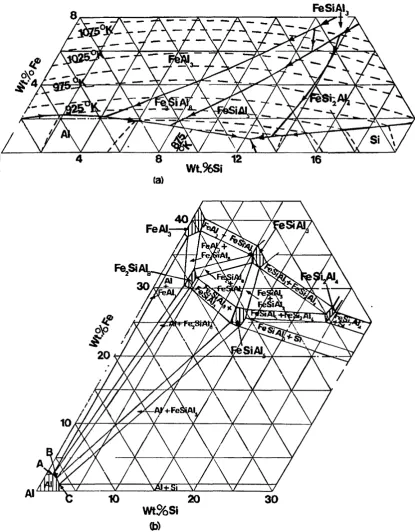
There are two main ternary equilibrium phases that form with aluminium, they are a H- AlFeSi and PM-AlFeSi. However, another equilibrium phase, 8i-AlFeSi, is often present in high silicon alloys, and a fourth yM-AlFeSi forms in high iron and high silicon alloys [5]. The invariant reactions in the aluminium comer of the equilibrium phase diagram are shown in Table 1.10, and the liquidus curves are shown in Fig. 1.7a
[5, 26], along with the probable phase distribution in the solid state Fig, 1.7b [5].
Reaction Temperature, K. Reaction Type
Liq. -> Al + AlsFe 928 Eutectic
Liq. —>> Al + Si 850 Eutectic
Liq. —» Al + Si + pM 849 Eutectic
Liq. + A^Fe -» a H + Ym 983 Peritectic
Liq. + yM -> a H + Pm 948 Peritectic
Liq. + Ym -> 8X + Pm 973 Peritectic
Liq. + AbFe -» Al + aH 903 Peritectic
Liq. + an —> Al + Pm 885 Peritectic
Liq. + 8t—> Pm + Si 869 Peritectic
Table 1.10 Invariant reactions at the aluminium end of the Al-Fe-Si system [5].
FteSiAl
Wt96Si
[image:46.614.65.481.58.591.2]Wt$6Si <b)
Complementary Techniques”, 2000.
1.4.1 ctH-AlFeSi
The crystal structure of the equilibrium phase an-AlFeSi has been investigated by many
authors [6, 21, 26, 72, 73, 74, 75], who concluded that it had a hexagonal unit cell, a =
12.3 A and c = 26.3 A, and a space group P63/mmc. However, the most
comprehensive study regarding the crystal structure of CtH-AlFeSi was performed by
Corby et al [76], using the anomalous-dispersion methods. This technique was
successfully applied to the determination of the crystal structure of ALFe [77], which allowed the complete crystal structure to be resolved, and is described fully elsewhere [78].
The crystal structure that was determined by Corby et al [76] confirmed that the unit
cell was hexagonal, a = 12.3 A and c = 26.3 A, and had a space group P63/mmc. On
further analysis of the structure it was revealed that there were 5 independent Fe sites, and 26 independent Al sites. A summary of the Fe sites is given in Table 1.11.
Fe Site No. of Al-Fe Bonds Al-Fe Bond Length, A Symmetry
1 9 2.35-2.72 12(k)
2 10 2.34-2.81 12(k)
3 10 2.29-2.62 12(k)
4 12 2.38-2.69 6(h)
5 12 2.45-2.93 4(f)
Table 1.11 Summary of the different types of Fe site [76].
There are three significant features of the structure of ctH-AlFeSi that are directly
visible when digesting the information reported by Corby et al [76]. The first feature is
are in direct contact with at least one Fe atom. Thirdly, the smallest Al-Fe bond length involves the Al atoms which themselves are bonded to the smallest number of Fe atoms. This is illustrated by considering Al(9) which has only one Fe neighbour, Fe(3),
and the Al-Fe bond length is the smallest in the structure at 2.29 A. Similarly, Al(15)
also has only one Fe neighbour, Fe(3), and has the next smallest Al-Fe bond length at
2.34 A. The overall mean Al-Fe bond lengths for those with two Fe neighbours is 2.47
A, whilst those with three Fe neighbours the mean Al-Fe bond length is 2.59 A. This is
similar to features observed by Black [79] in other Al-Fe structures.
As no Fe atom is in contact with any other Fe atom, the structure can be described in terms of Al linkages between Fe-centred polyhedra [79]. The five such polyhedra are shown in Fig. 1.10, and those Al atoms masked by others are shown with an arrow indicating their position.
The polyhedra centred on Fe(l) and Fe(2) are shown together in Fig. 1.11. The Al(16) atoms provide the self-linkages between the Fe(l) polyhedra, and the Al(12) atoms play a similar role for the Fe(2) polyhedra. The two different types of polyhedra are
linked together by Al(6) and Al(7) atoms into one continuous sheet (type sheet A),
while Al(18) and Al(20) at a height XA lie on this polyhedral sheet and link it to its mirror imaged ’.
The polyhedra centred on Fe(3) are shown in Fig 1.12, with Al(8) at height zero, and Al(10) and Al(13) providing the self linkages which form the continuous puckered type
sheet B. The sheet contains the unit cell origin, and thus exhibits centro-symmetry
unlike the type sheet A.
Their common atoms Al(6), Al(13), and Al(14) link the two types of sheet. The remaining Fe atoms serve to reinforce the joining of the sheets with Fe(4), lying in the mirror height XA, joining A to A ’, whilst Fe(5) joins A to B. The sheets finally stack in
Complementary Techniques”, 2000.
The main features of this structure are consistent with the features shown by AkFe [43, 44], (FeCuXAUCu) [47], and AleFe [60] as all of these structures show similar Fe- centred polyhedra. However, because of the difficulty of distinguishing Al atoms from Si atoms, it was not possible to determine the possible role of Si within this structure. It is possible to speculate that formation of ctH-AlFeSi may be stabilised by a small amount of a third element, in this case Si, which plays no obvious role in the crystal structure. This is common with many Al-Fe containing intermetallic metastable phases [6, 26,47, 57, 60].
Fc(5)
Fig 1.11 The type sheets formed from Fe(l) and Fe(2)-centred polyhedra, and
the numbers identify the polyhedra. The mean height of this sheet is 3.86 A
above the basal plane. The mirror plane at height XA (6.56 A above the basal
plane) contains the Fe(4) atoms, with the positions shown by pairs of arrows,
which serve to join the sheet to its mirror image A’ at 9.26 A above the basal
plane. The apparent hole at (1/3,2/3) is occupied by Fe(5) which serves to bind
this sheet to the sheet type B. Shaded atoms are Al(6), Al(13), and Al(14)
Fig 1.12 The type B sheet formed from the Fe(3)-centred polyhedra. The mean
level of this sheet is in the basal plane. The Fe(5) atom at 2.63 A above the
basal plane, position shown by a vertical pair of arrows, serves to bind this
sheet to the type A sheet above. The Fe(5) atom at 2.63 A below the basal
1.4.2 otc-AlFeSi
The crystal structure of the metastable phase Oc-AlFeSi was determined by Cooper [80] in 1967. The actual investigation used single crystals, with a chemical composition
defined by microprobe analysis of Fe4MnSi2Ali9. This was close to the chemical
composition of Fe5Si2Al2o reported by Phragmen [47], and since the atomic radii of Fe
and Mn are similar [4] it is assumed that the Mn directly substitutes for Fe.
The density of the crystals was determined by the flotation method to be 3.59 ± 0.06 g cm’3, which agrees with the calculated value of 3.62 g cm'3, for an ideal unit cell consisting of 100 Al, 14 Si, and 24 Fe atoms [80]. The unit Cell was obtained by diffraction techniques, and was found to be cubic with a cell size of 12.56 A and space group Im3, which agreed with the structural information obtained by Phragmen [47]. However, the structure of otc-AlFeSi was not discussed in detail by Cooper [80], but it was discussed with reference to otc-AlMnSi [81]. This Mn ternary intermetallic
compound is an isomorph of a c-AlFeSi, which can be explained in terms of the similar free electron to atom ratios, and the parameters are compared in Table 1.12.
The crystal structure of <Xc-AlMnSi was obtained, and refined, by Cooper et al [81], which was based upon the structure reported by Bergman of a unit cell containing 138
atoms [82]. Cooper et al [81] performed diffraction experiments on single crystals, and
discovered that the unit cell was cubic, a = 12.68 A space group Pm3, with a density of 3.62 + 0.06 g cm’3. This agreed with a calculated density of 3.62 g cm'3, based upon a unit cell containing 100 Al, 14 Si, and 24 Mn atoms.
Complementary Techniques”, 2000.
Author Intermetallic Unit Space Group Parameters
Phase Cell
Cooper [80] otc-AlFeSi Cubic. Im3 a = 12.56 A
Cooper et al [81] otc-AlMnSi Cubic Pm3 a =12.68 A
Table 1.12 Comparison of otc-AlFeSi and a c-AlMnSi [80, 81]
Cooper et al [81] used a maximum contact distance of 2.84 A for the manganese and
aluminium atoms, and the co-ordination of the polyhedra is described as follows. The manganese atom Mn(l) has ten aluminium neighbours, at an average distance of 2.63
A. this includes two short bonds to atoms Al(3), 2.46 A, and Al (4), 2.43 A. The
manganese atom Mn(2) has nine aluminium neighbours, with only one short Al-Mn
bond measuring 2.27 A, Al(5). The bond to atom Al(5) is a direct complement to Al(4)
in the Mn(l) environment, and is a feature of many Al-Transition Metal systems, as described earlier [50]. The difference in changing the co-ordination number of the Mn centred ployhedra from 10-fold to 9-fold only affects the number of coplanar bonds, and in this case the number of Al-Mn coplanar bonds reduces from 4 to 3.
The structure of the complete unit cell can be described as a complex three-
dimensional network of polyhedra. However, it can alternatively be described in terms of layers of manganese atoms parallel to the (100) planes, and linked by aluminium atoms, but in the case of ctc-AlMnSi this layering is not as marked as in other aluminium alloys of transition metals [25, 43, 44, 51, 60, 68, 70, 71, 76, 80].
The refinement of the crystal structure of otc-AlFeSi by Cooper [80] defined two iron 10-fold and 9-fold co-ordination polyhedra, Fe(l) and Fe(2), similar in atomic
composed of two types of unit cell. In one type of unit cell, sites Al(7), Al(9), and Al(l 1) are occupied, and in the other sites Al(8), Al(10), and Al(12) are occupied. This yields an average structure that belongs to the space group Im3, although each type of unit cell, when considered separately, is primitive. The way that these two different types of unit cell interlock is not shown in the literature, or how the polyhedra are connected together, but the iron atoms are arranged parallel to the (100) plane, as in otc-AlMnSi. Table 1.13 shows a comparison of the iron and manganese polyhedra observed in otc-AlFeSi and a c-AlMnSi.
Intermetallic Phase Site No. of Al- Trans.
Met. Bonds
Al-Trans. Met. Bond Length, A
Oc-AlMnSi Mn(l) 10 2.43 - 2.84
Mn(2) 9 2.27 - 2.62
a c-AlFeSi Fe(l) 10 2.43-2.81
Fe(2) 9 2.43 - 2.68
Table 1.13 Summary of the Transition Metal sites in a c-AlFeSi and otc-AlMnSi
[80, 81].
Complementary Techniques”, 2000.
1.5 MOSSBAUER STUDIES AND INTERPRETATION
It has already been stated that the main impurity element within aluminium is iron, and due to the very low solid solubility of iron in aluminium the iron forms intermetallic compounds in the final part of the solid that solidifies. Since iron is present in all the common intermetallic compounds, Mossbauer spectroscopy can be used to analyse them. The information that this produced using this technique gives a detailed insight into the iron environment, both structurally and dynamically, and the theory is clearly explained in Chapter 2.
The advantages of using this technique to analyse the aluminium intermetallics are summarised below:
Only a very small quantity of the sample is required, typically in the order of a few milligrams.
The samples can be in several forms: sheets, foils, single crystals and polycrystalline powders.
The technique is non-destructive.
Mossbauer spectroscopy can be used to study both bulk and surface properties.
Since each aluminium intermetallic phase has a unique crystal structure, therefore, they can be identified by their characteristic spectra.
Variable temperature Mossbauer spectroscopy can be used to study the lattice dynamics of the different phases.
1.5.1 EARLY MOSSBAUER STUDIES
content in industrially cast aluminium being typically less than 1 wt% [1], and are only mentioned in passing.
However, a more relevant study was performed by Bush et al [88], who used the
Mossbauer effect to investigate precipitation in a dilute solution of iron in aluminium. The alloy used in this investigation contained 0.05 wt% Fe, and it was 57Fe enriched by 68%. Initially the Mossbauer spectrum for the alloy showed only a single Lorentzian, 8 = 0.77 mm s"1, which is a characteristic of iron dissolved in a paramagnetic matrix. After the alloy was annealed for 128 hours at 320°C a phase transition occurred, and the Al3Fe intermetallic was formed. Mainly using X-ray diffraction techniques proved this, but Mossbauer spectroscopy was also used. The Mossbauer spectrum was de- convoluted into two Lorentzian lines, 8 = 0.43 mm s"1 and 8 = 0.72 mm s"1, but no physical justification was given for this regarding the crystal structure of the alloy.
Since then there has been a considerable amount of work done in the area of dilute Al- Fe alloys, which utilises the very high resolution of the Mossbauer technique. This has enabled very fine, and detailed, structural information to be published in this area, including: monomers [89, 90, 91], dimers [92], vacancy [93, 94, 95, 96, 97, 98], interstitial [99, 100], grain boundary [101], cluster [92], AlFe solid solution [83, 86], and anti-domain boundary [83, 86],
However, this study only concerns the Al-Fe and Al-Fe-Si intermetallics, each of which shall be discussed in detail separately.
1.5.2 Al3Fe
Complementary Techniques”, 2000.
Al-Fe bond lengths. However, Black [43, 44] determined the crystal structure of
Al3Fe, and it was found to contain five different iron sites, so this de-convolution of
the spectrum has no physical significance. However, Preston et al [102] and Stickels et
al [103] described the crystal structure of this intermetallic in their studies, but attributed their three Lorentzian line interpretation procedure to computer ease.
Author Lorentzian Isomer Shift,
mm s'1
Width, mm s'1
[102] 1 0.01 0.27
2 0.20 0.27
3 0.38 0.27
[103] 1 0.01 0.25
2 0.21 0.29
3 0.38 0.25
[104], [105] 1 0.01 0.27
2 0.19 0.27
3 0.38 0.27
Isomer shifts relative to a-iron.
Table 1.14 A summary of the three Lorentzian line de-convolution approach for the Mossbauer spectrum of Al3Fe.
The interpretation of the Mossbauer spectrum for Al3Fe, according to the literature, seemed to evolve with time. Instead of the three Lorentzian line de-convolution approach, several authors [107, 108, 109] have suggested a two quadrupole de- convolution interpretation. These authors made no physical justification to the change in the interpretation of the Mossbauer spectrum for Al3Fe in their studies. However,
The crystal structure of Al3Fe has been discussed in detail previously, see Chapter
1.3.1, and can be summarised as flat and puckered layers of atoms perpendicular to the
b axis. In the flat layer there are four different types of iron sites, with some similarities in their local environment. In the iron sites 1, 3, and 4 there are 11 nearest neighbours, but one of the neighbouring atoms is more than 2.8 A away and, therefore, can be assumed to be too far away from Fe atom to pose any significant effect to the
Mossbauer interaction [110]. The iron site 2 has only 10 nearest neighbours, but their mean nearest neighbour bond lengths is the shortest of the four sites. Aluminium atoms dominate the puckered layer, and in this layer the iron atoms have a single distinct position at the centre of a pentagon of aluminium atoms. Thus the five different types of iron sites can be distinguished into two classes:
1. Four different sites, but with a rather similar atomic environments in the flat layer. 2. One site with a unique atomic environment, in the puckered layer.
Both of the above classes are situated in a symmetry which is less than cubic, and so the spectrum of Al3Fe can be expected to consist of two quadrupole interactions, with the observed experimental parameters for several authors shown in Table 1.15.
The quadrupole interaction arising from the puckered layer of atoms yields a doublet, with a very small splitting. This is due to the single iron site in this layer being in a near symmetrical environment with aluminium atoms as the nearest neighbours.
The other four iron sites in the flat layer of atoms produce a quadrupole interaction with a larger splitting, as they are in a more asymmetric environment. This larger splitting would arise from a larger electric field gradient across the iron atom, inherent
in the more asymmetric environment. The line broadening observed by Chittaranjan et
al [110] was attributed to the distributions of sites, but no attempt was made to
Complementary Techniques”, 2000.
Author Isomer Shift, mm s'1 Quadrupole Splitting, mm s'1
[107] 0.20 0.38
0.20 0
[108] 0.197 ±0.006 . 0.396 ± 0.006
0.196 ±0.006 <0.06
[109] 0.20 0.40
0.20 0
[110] 0.20 ±0.23 0.42 ± 0.01
0.20 ±0.17 0.08 ± 0.05
Isomer shifts relative to a-iron.
Table 1.15 A summary of the two quadrupole splitting de-convolution approach for the Mossbauer spectrum of Al3Fe.
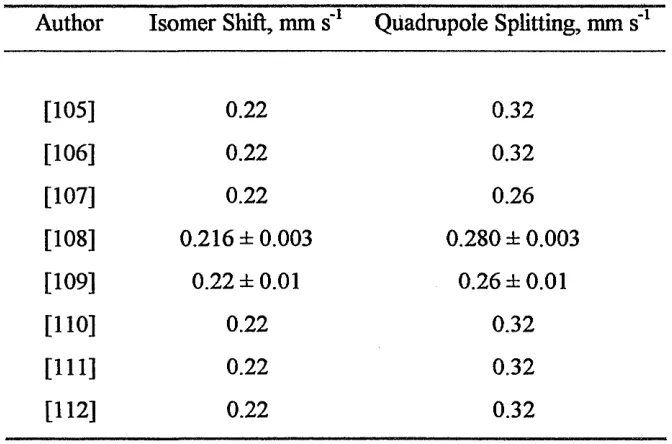
1.5.3 Al6Fe
The crystal structure has been defined completely defined by Walford [60], and it was discovered that there was only one distinct iron site within the unit cell. The
implications of that discovery, to the observed Mossbauer spectrum, were that only one quadrupole interaction component could be physically justified for the spectrum. This procedure was followed by a variety of different authors, who published
Mossbauer parameters for this compound [104, 105, 107, 108, 109, 110, 111, 112], see Table 1.16 for a comparison of the literature values.
Chittaranjan etal [110] compared the local atomic environments of the iron sites
be illustrated by comparing the literature values for the isomer shifts for Al3Fe, see
Table 1.15, and Al6Fe, see Table 1.16. However, the corresponding quadrupole
splittings were different, and this can be attributed to the different Al-Fe bond lengths, which would lead to a slightly different electric field gradients, across the Mossbauer atom, in the two intermetallic compounds.
Author Isomer Shift, mm s'1 Quadrupole Splitting, mm s’1
[105] 0.22 0.32
[106] 0.22 0.32
[107] 0.22 0.26
[108] 0.216 ± 0.003 0.280 ± 0.003
[109] 0.22 ±0.01 0.26 ± 0.01
[110] 0.22 0.32
[111] 0.22 0.32
[112] 0.22 0.32
[image:60.613.77.413.171.393.2]Isomer shifts relative to a-iron.
Complementary Techniques”, 2000.
1.5.3.1 THE PHASE TRANSITION Al6Fe -» Al3Fe
Several different authors [104,105, 111, 112] have also published articles regarding the intermetallic phase transition from the metastable compound A^Fe, to the equilibrium compound Al3Fe. This important transition occurs during the
homogenising process of the aluminium ingot, which is an integral part of the industrial production process, as it alters the workability and chemical properties of the material.
Nagy et al [105] cast aluminium ingots using the DC casting method, containing 0.58
wt% Fe, and they were analysed using the Mossbauer technique. However, there was no indication where the samples were taken from within the ingot, but after analysis the as cast sample was found to contain predominantly a Mossbauer doublet attributed to Al6Fe and with a small Mossbauer singlet attributed to AlFe solid solution. After annealing the sample at 620°C for 3000 minutes the AleFe intermetallic transformed into Al3Fe, but the area fraction of the Mossbauer singlet attributed to AlFe solid solution did not change. This can be explained as the iron was saturated in the aluminium, due to its limited solid solubility [14].
This transformation was corraborated by a study by Murgas etal [111], using an
identical DC aluminium ingot, containing 0.58 wt% Fe, and the Mossbauer technique. However, the samples were taken from a region of the ingot that experienced a solidification rate of 3°C s'1, and this was confirmed by applying dendrite spacing calculations [8,9,10,11,12,13]. The annealing procedure was performed at 620°C for 240 minutes, and the resultant Mossbauer spectrum was de-convoluted into
predominately Al3Fe, with small area fractions attributed to AleFe, and AlFe in solid
solution (which also remained constant throughout the annealing process). Murgas et
Other studies by Nagy et al [104] and Vertes et al [112] investigated the kinetics of the transition Al6Fe to Al3Fe, and tried to determine a simple model for the mechanism of the process. Both authors used a DC aluminium ingot, containing 0.58% wt Fe, and the Mossbauer technique was applied to follow the transition. Samples were taken from a region of the ingot which experienced a solidification rate of 3°C s’1, and was confirmed by applying dendrite spacing calculations [8,9,10,11,12,13], as this
solidification rate favours the precipitation of the Al6Fe intermetallic metastable phase [7,15, 24]. Several samples were annealed at different temperatures, 580°C-635°C, for 240 minutes, and the area fractions were analysed using the Arvami equation [113]
combined with an Arrhenius plot. Nagy et al [104] determined the optimum activation
energy of this process to be 3.33 ± 0.14 eV, which agreed with the optimum value of
3.33 ± 0.47 eV proposed by
![Table 1.4 Solid solubility of some elements in A1 [14].](https://thumb-us.123doks.com/thumbv2/123dok_us/779118.583955/23.616.138.354.172.393/table-solid-solubility-elements-a.webp)
![Fig 1.13 Vertical section of the ternary phase diagram of Al-Fe-Si at 4% Fe[120,121].](https://thumb-us.123doks.com/thumbv2/123dok_us/779118.583955/65.612.83.421.123.373/fig-vertical-section-ternary-phase-diagram-al-fe.webp)

![Fig 2.5 The schematic variation of A /f as function of 4 [13]](https://thumb-us.123doks.com/thumbv2/123dok_us/779118.583955/92.617.49.441.385.660/fig-schematic-variation-f-function.webp)