QUICK AND SIMPLE SPECTROPHOTOMETRIC METHOD FOR
ESTIMATION OF RU486 IN TABLET DOSAGE FORM
Krina K. Shah* and Dipti B. Patel
Department of Pharmaceutical Quality Assurance, Shree S.K.Patel Collage of Pharmaceutical
Education & Research, Ganpat University, Kherva-384012, Mehsana, Gujarat, India.
ABSTRACT
A new, simple and accurate Zero Order UV- Spectrophotometric
method has been developed for quick determination of Mifepristone
(RU486) in tablet formulation. Methanol was uesd as solvent. The
method is based upon determination of RU486 at 303.8 nm. Beer’s law
obeyed the concentration range of 4 – 14 µg/ml. The % recovery was
found in the range of 96.8 – 98 %. The % RSD value was found to be
less than 0.66 %. Thus the proposed method was simple, economic,
rapid, accurate and can be succesfully applied for determination of
Mifepristone in tablet dosage form.
KEYWORDS: Mifepristone, RU486, Zero Order UV
spectrophotometry.
INTRODUCTION
As a derivative of progestine Norethindrone, Mifepristone is a synthetic, steroidal
antiprogesterone and antiglucocorticoid agent. It is used as a contraceptive, aborficiant agent
to terminate pragnancy as a competitive inhibitor of progesterone, as a treatment for
endometriosis (growth of uterus tissue outside the uterus) or fibroids (noncancerous tumors in
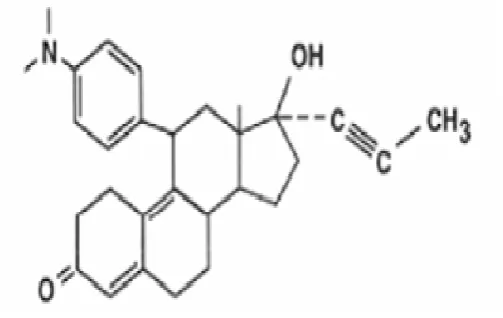
the uterus) and progesterone sensitive tumors. So Mifepristone (MPT) is chemically,
11β-[p-(Dimethylamino) phenyl]-17β-hydroxy-17-(1-propynyl) estra-4, 9-dien-3-one. The empirical
formula is C29H35NO2, Mifepristone is pale yellow powder. It is very soluble in methanol,
chloroform and acetone; and poorly soluble in water (0.00336 mg/ml). The structural formula
is shown in fig (1).
Volume 7, Issue 9, 1510-1517. Research Article ISSN 2277– 7105
Article Received on 19 March 2018,
Revised on 09 April 2018, Accepted on 30 April 2018,
DOI: 10.20959/wjpr20189-12143
*Corresponding Author
Krina K. Shah
Department of
Pharmaceutical Quality
Assurance, Shree S.K.Patel
Collage of Pharmaceutical
Education & Research,
Ganpat University,
Kherva-384012, Mehsana,
Figure 1: Structure of Mifepriston.
MATERIAL AND METHODS
Instruments
A shimadzu model 1700 (Japan) double beam UV/Visible spectrophotometer with spectral
width of 2 nm, wavelenth accuracy of 0.5 nm and a pair of 10 mm matched quartz cell was
used to measure absorbance of all the solutions. Spectra were automatically obtained by UV-
probe 2.0 systemsoftware. A sartorious CP224S analytical balance (Gottingen, Germany), an
ultrasonic bath (Frontline FS 4, Mumbai, India) was used in the study.
MATERIALS AND REAGENTS
Pure sample of MPT was provided as gift sample from Intas pharmaceuticals pvt ltd
Ahmedabad. Tablet of label claim 200 mg mifepristone was procured from local market.
Methanol AR Grade was received from S.D fine Chemicals Ltd, Mumbai, India. Whatman
filter paper no.41 was used for filtration.
Selection of solvent
It was based on solubility and stability of drug in solvent system as well as extraction of drug
from it formulation. MPT is insoluble in water but very soluble in methanol; hence methanol
was selected as a solvent for its UV spectrophotometric determination.
Preparation of solution
Preparation of standard stock solution
A quantity of standard powder equivalent to 10 mg of MPT was transffered to a 100 ml
volumetric flask. Methanol (50 ml) was added, sonicated for 30-35 min to dissove drug as
Preparation of working standard solution
An aliquot of the standard stock solution concentation 100µg/ml (1 ml) was transferred in to
a 10 ml volumetric flask and the volume was fixed upto mark with methanol to get final
concentration of 10µg/ml.
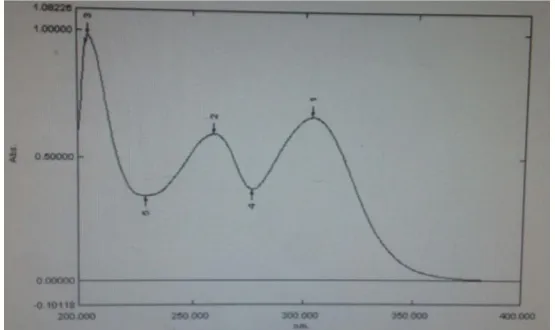
Determination of wavelenth
The working standard dolution of MPT was scanned in UV range from 200-400 nm. The
wavelenth maximawas found to be 259.2 nm and 303.8 nm (fig. 3). However, at 259.8 nm
solution did not show better absorbance response and linearity. Hence 303.8 nm was choosen
as the wavelenth for its estimation.
Zero Order Spectrophotometric method
It is the simple method for estimation of MPT in single drug formulation. In which, sample
drug is dissolved into solvent and the wavelenth maxima has to be find out. By compairing it
with standard solution concentration, the concentration of sample solution can be calculated.
Twenty tablets manufactured by INTAS (India) containing 200mg of MPT were taken, their
average weight was determined and crushed to fine powder. A quantity of tablet powder
equivalent to 10 mg of MPT was transferred to 100ml volumetric flask and dissolved in
methanol and sonicated for 30 minutes. The volume was made up to 100 ml (1000μg/ml).
The solution was filtered using Whatman paper No. 41. It was further diluted to get a solution
containing 10μg/ml of MPT. This solution was analyzed at 303.8 nm and absorbance value
obtained was substituted in equation for single point standardization to obtain the content of
MPT. Results are shown in table -1.
Ctest = Atest × Cstandard ÷ Astandard
Ctest: concentration in sample solution.
Cstandard : concentration in standard solution.
Atest : absorbance of sample solution.
Astandard -: absorbance of standard solution.
METHOD VALIDATION
The developed method was validated with respect to linearity, accuracy, intraday and
interday precision, limit of detection (LOD) and limit of quantification (LOQ) and robustness
Linearity
The calibration curve was constructed over a concentration range of 4-14 μg/ml (fig. 2).
accurately measured working standard solutions of MPT (0.4, 0.6, 0.8, 1.0, 1.2 and 1.4 ml)
were transferred to a series of 10 ml of volumetric flask and diluted to the mark with
methanol. And absorbance was measured at 303.8 nm ((λmax of MPT). The calibration curve
was assembled by constructing absorbances versus concentractions and the regression
[image:4.595.142.456.230.434.2]equations were calculated. Results are reported in table- 2.
Figure 2: Linearity curve of Mifepristone.
Precision
The precision of an analytical procedure expresses the closeness of agreement (degree of
scatter) between a series of measurements obtained from multiple sampling of the same
sample under the prescribed conditions. Precision may be considered at three levels:
repeatability, Intra day precision, Interday precision.
Repeatability
Repeatability of the method was determined by analyzing standard solution of MPT (5μg/ml)
6 times without changing the parameters of measurement. The results are reported in terms of
relative standard deviation (RSD) in Table -2.
Intermediate precision
The intraday and interday precision of the proposed method was perfomed by analyzing the
(interday) over a period of one week for three different concentrations of standard solutions
of MPT. Result was showed in Table-2.
Accuracy
Accuracy was checked by recovery study at 3 different concentration levels, i.e., a multilevel
recovery study. The tablet samples were spiked with an extra 50, 100 and 150 % of standard
MPT and the tablet formulation were analysed by proposed method. Results of the recovery
study are shown in table 4 suggested that method was accurate for the estimation of MPT in
tablet formulations. Result was showed in Table-3.
Limit of detection and limit of quantification
The limit of detection (LOD) and limit of quantification (LOD) were calculated using
signal-to-noise (i.e. 3.3 for LOD and 10 for LOQ) ratio using following equations desinated:
LOD = 3.3 X σ/S
LOQ = 10 X σ/S
Where, σ = the standard deviation of the response,
S = slope of the calibration curve.
Ruggedness
Ruggedness of the method was determined by carrying out the analysis by different analyst
and the absorbance of 5 µg/ml solution of MPT was noted. The result is shown in table-4.
RESULT AND DISCUSSION
An attempt has been made to develop a quick, economic, precise and accurate analytical
method for estimation of MPT in tablet dosage form. The proposed methods are based on
zero order spectophotometric absorption for the quick estimation of MPT in UV region using
methanol as solvent. MPT obeyed linearity in the concentration range of 4-14µg/ml in the
methanol at their respective λ-max with correlation coefficient (r2 = 0.9993). The spectrum of
Figure 3: spectrum of MPT in methanol (10µg/ml).
Table 1: Estimation of MPT in Tablet Dosage Form.
MPT tablet dosage form
Labeled claim
(mg/ml) Amount found (mg/ml) % Labeled Claim
200 mg/ml 204 102 %
Table 2: Regression Data of MPT by Zero Order Spectophotometric Method.
Parameters MPT( 303.8 nm)
Beer’s law limit (μg /ml) 4 – 14
Regression equation (y = mx + c) y= 0.0521x + 0.0373
Slope 0.0521
Intercept 0.0373
Correlation coefficient (r2) 0.9994
LOD (μg /ml) 0.2627
LOQ (μg /ml) 0.7961
Repeatability (% RSD, n =6) 0.9310
Precision (n=6) % RSD
Intraday 0.7017
Interday 1.98
Table 3: Accuracy (% Recovery Study) Data for MPT.
Drug Level Amount taken
(μg/ml) Amount added (%)
% Recovery ± S.D. (n = 3)
MPT
I 5 50 97.25 ± 0.378
II 5 100 98 ± 1.4
III 5 150 96.8 ± 1.249
Table 4: Ruggedness of MPT.
Obaservation Absorbance of
MPT 5 µg/ml % SD %RSD
Analyst 1 0.34729
0.007046 1.98
CONCLUSION
The Zero Order UV Spectrophotometric method was developed for quick determination of
MPT in tablet dosage form. Method was found to be simple, accurate, economic and quick as
can be reflected from validation parameters data. Developed method was efficiently applied
for determination of MPT in pharmaceutical formulation and therefor method can be
extended for the regular QC analysis in tablet.
ACKNOWALEDGEMENT
The authors wish to thank Intas pharmaceuticals limited for providing MPT pure drug
powder as gift sample for research work. The authors are highly thankful to Shree S. K. Patel
College of Pharmaceutical Education & Research, Ganpat University, Kherva, Mehsana,
Gujarat, India for providing all the facilities to carry out the work.
REFERENCES
1. Hazara B.G., Pore V.S. Mifepristone (RU486), the recently developed sntiprogesterone
drug and its analogues. Journal of Indian Institute and Science, 2001: 81: 287-98.
2. Tripathi KD, Essential of Medical Pharmacology, 7th edition, Hormones And Related
Drugs, Jaypee Brothers, New Delhi, 2013; 319.
3. Methods of abortion,society for the Protection of Unborn Children, 3 Whitacre Mews,
Stannary Street, London, SE11 4AB, United Kingdom.
4. Devadasu CH, Harika S, Mallikarjuna T, Adilakshmi G, Sreenath A. A
Spectrophotometric Assay for the Simultaneous Analysis of Mifepristone and
Misoprostol in Tablets Using Vierodt's and Absorbance Ratio Methods. Research Journal
of Pharmacy and Technology., 2012; 5(1): 46-9.
5. Giri A, Saritha B, Reddy VG, Reddy ST. Quantitative Determination of Mifepristone in
Pharmaceutical Samples By, Visible Spectrophotometric Method Using Ce (IV) As an
Analytical Reagent, International Journal of Pharmaceutical Sciences and Drug
Research., 2014; 6(3): 246- 9.
6. Giri A, Saritha B, Reddy VB, Reddy ST. A Simple, Visible Spectrophotometric Method
for the assay of Mifepristone In Pharmaceutical Formulations Using Fe(iii) As An
Analytical Reagent. International Journal of Innovative Pharmaceutical Sciences and
7. Giri A, Saritha B, Reddy VB, Reddy ST. Validated Visible Spectrophotometric Method
for The Estimation Of Mifepristone Using Cr (VI) As An Analytical Reagent.
International Journal of Pharmacy and Therapeutics,. 2014; 5(4): 277- 82.
8. Guo Z, Wang S, Wei D, Zhai J. Development of a high-performance liquid
chromatographic method for the determination of mifepristone in human plasma using
norethisterone as an internal standard: application to pharmacokinetic study.
Contraception,. 2007; 76: 228- 32.
9. Stith C, Hussain MD. Determination of mifepristone levels in wild canid serum using
liquid chromatography. Journal of Chromatography B., 2003; 794: 9-15.
10.Geo Z, Chu C, Yin G, He M, Fu K, Wu J. An HPLC method for the determination of ng
mifepristone in human plasma. Journal of Chromatography B., 2006; 832: 181– 4.
11.Guo Z, Wei D, Yin G, Wang S, Zhao S, Chu Y. Simultaneous determination of rivanol
and mifepristone in human plasma by a HPLC-UV method with solid-phase extraction.
Journal of Chromatography B., 2007; 856: 312- 7.
12. Mattsson C, Bailey MA, Reynolds RM, Walker BR, Andrew R. Quantitative analysis of
RU38486 (mifepristone) by HPLC triple quadrupole mass spectrometry. Journal of
Chromatography B., 2009; 877: 497-501.
13.Teng Y, Dong R, Wang B, Jiang Z, Wei C, Zhang R, “et al”. Determination of
mifepristone and its metabolites and their pharmacokinetics in healthy female Chinese
subjects. Acta Pharmaceutica Sinica., 2011; 46(10): 1241- 45.
14.Tang C, Zhong G, Chen X, Huang Z, Huang M. Simultaneous determination of
mifepristone and monodemethyl-mifepristone in human plasma by liquid
chromatography- tandem mass spectroscopy method using levonorgestrel as an internal
standard: application to a pharmacokinetic study. Biomedical Chromatography., 2009; 23:
71- 8.
15.Chavan D.D., Damle M.C., Development and validation of stability indicating HPTLC
method for estimation of Mifepristone. International Journal of Pharma Research &
Review, 2015; 4(4): 13- 9.
16.ICH Q2 (R1), Validation of Analytical Procedures: Text and Methodology, Geneva