THE
ECONOMIC & SOCIAL
RESEARCH INSTITUTE
A Study of the
Irish Cattle and Beef Industries
TERENCE J. BAKER, I~,O.BERT O’CONNOR, RORY DUNNE
THE ECONOMIC AND SOCIAL RESEARCH INSTITUTE COUNCIL 197~-73
*T. K. WHITAKER, ~+.sc. (Eta.,+.), D.eCO+’+.SC.. president of the Imtitute. *G. O’BRI EN, 1>.u’rr., Ll’i’r.l)., Chairman of~ Cotmnil.
T.J. BARI*,INGTON, Director, Institute of Publio Administration. *J. P. BEDDY, D.mCO.W.SC., U..O. (H.C.).
R. D. C. BLACK. PIl.l:+., Professor, Departnlent of l’~onomios, The Queen’s University, Bdfoat. *F. B. CHLIBB, sl.^., o.pmt+.. Professor, Department of Political Scienxe, Tdnity College, Dublin.
VERY REV. i~. CREGAN. c.~., President, St. Patrick’s "l-raining College, Drumtandra, Dublin. G. DEAN. M.D.. I’.a.C.p., Director, Medico-Social Research Board.
REV. pETER I)EMPSE’t. O.P.M.C, AP., ~ .a., PH.D., Professor, Departmenl of Applied Psychology, Unit,ersity College, Cork. N.J. 13,1BSON, a.sc. (e+¢o.~.), VH.D.. Professor, Department of I~onomies, The avow Universi(v of Ulater, Color^inc. *~V. A. HONOHAN. St.^., e.Lm., Secretary, Department of Social [Vdfare.
*THE MOST RI’~V. JAMES IGXVANAGlt. ~t.^.. s.’r.L.. Biahop of Z.erta. *KIERAN A. KI’2NNEDY. sI.F.cox.sc.. ,.PmL., PH.I).. Director of the htstit~ae.
IVOR KENNY. M.^., Director. In~*h iI,Ianagernent Institute. T. P. LINEHAN. o.E.. o.sc.. Director. Central Stalistics Office.
P. LYNCH, st./+., Associate Professor of Political I~onomy, Uniuersity College, Dublin. CHARLES McCARTHY, n.L.. Chairman, Human Sciences Committee.
*M. D. McCARTHY. st.^.. Ptl.l~., o.sc., President, Unieersity College, Cork. J, J+ McELL[GO’[7". ,~t,A,. t+t+.t~,. Past President of the Institute.
G. A. M EAGH E R, n.co~txt.. D.P.A.. Deputy Secret^or, IJepartment of I~al Gol:ernmeat. *J. F. MEENAN, sl.^., a.L., Profes+or of Political l~onomv, UniL+ersity Collegej Dublin. * C. H. M U R RA "V Secretary, Department of Finance,
J. C. NAGLE, m.cosIM.
I). N EVI N. Assismnl General Secrelary, Irish Congress of Trade Unions.
RIGHT REV. MONSIGNOR .J. NEWMAN, ~.^., D.VlI.. President, St. Patrick’s College, Ma),noolk. TADHG 0 CEARBHAILL, Setaeta~y, Department of Labour.
R EV. 1~. F. O’DOI’[ ER’I~’, M.^.. ti.D., P tl.O.. Professor, I)epartment of Logio and Powhology, University College, Dublin. D. P. O’MAHONY. M.^.. I’n.o.. n.t+., Professor, Department of Economies, O’nit¢ersity College, Cork.
LABFIRAS 0 NLIALLA| N. o.gcoN.sc.. Professor of F+conomies, Unlrwrsity College. Galway. *~V..1. I,+ RYAN, :a.^., vH.r+., Professor of Politltal Economy Trlnitv College, Dublin.
P. G. SI’IERRY. ~l.SC.. PH.D.. Confederation ofIrigh Indua~y. T. WALSH. D.SC., Dire^or, An Foras Taluntais.
A Study 9f the Irish Cattle and Beef Industries
, t
.i
Copies of thi~ paper may be obtained from the Economic and Social Research Institute, 4, Burlington Road, Dublin 4.
A Study of the Irish Cattle and Beef
Industries
TERENCE J. BAKER
ROBERT O’CONNOR
RORY DUNNE
CONTENTS
,Acknowledgements
Introduction i "
Chapter [. THE WORLD MEAT SITUATION ’
Production, Consumption, World Trade in Meat, Types of Meat
Chapter 2. BEEF AND VEAL: THE INTERNATIONAL BACK-GROUND
Production of Beef and Veal, Exports of Carcase Beef and Veal, Projections for Beef and Veal
Chapter 3" THE MARKET SITUATION FOR BEEF AND VEAL
USA, United Kingdom, The EEC Market: France, Belgium, Italy, West Germany, The Netherlands
Chapter 4. IRISH CATTLE PRODUCTION AND DISPOSAL Cattle Output, Disposal of Output, Live Exports, Dead Meat Exports, Domestic Consumption of Beef, Breeds of Cattle
Chapter 5. THE IRISH FRESH MEAT INDUSTRY
Transport, EEC Tariffs, Seasonality of Supply, Factory Throughput and Capacity, Effect of Price Seasonality, Competition from Live Exports, Economic Coniribution of the Fresh Meat Industry, Case for the Live Trade, Marketing Structure
Chapter 6. CONCLUSIONS AND RECOMMENDATIONS
Page
9
lI
41
6i
87
LIST OF TABLES
Table
I.I Estimated Average Annual Consumption of Meat Per Person in Selected Countries, for Certain,Years
Proportion of Beef and Veal in Total Consumption of Carcase Meat, 196~-1971
t4
CONTENTS
6
I.3 Estimates of Average Annual Changes in Real Producer Prices for Specified Types of Livestock in the EEC "Six", 1962-i968 20 2.1 Estimated Production of Beef and Veal in Selected Countries,
1692-197° 3°
2.2 Estimated Cortsumption Per Head of Beef and Veal in Certain
Countries, for Selected Years 3I
2.3 Exports of Carcase Beef and Veal from the Clfiet Exporting
Countries, for Selected Years 33
2.4 Distribution of Exports of Carcase Beef and Veal, i969 and t97o 34 2.5 Sources of Imports of Carcase Beef and Veal into Main Importing
Countries, 1968-197o 36
2.6 FAO Beef and Veal Balances for ~964-1966 and Projections for
198o 38
3.1 Beef and Veal Supplies in the United Kingdom for Selected Years 43 3.2 Slaughterings of Cattle in France, 1966-197x 47
3.3 Trade in Live Cattle, Beef and Veal between Belgium and Other
Countries, 1969-1971 5°
3.4 Imports and Exports in 197I for EEC (Six Countries) 58 3.5 Imports and Exports in 197x for the Nine Countries of Expanded
EEC 59
4.r Relationship Between Cows and Cattle Output, 1953-1972 64 4.2 Cow Numbers as a Percentage of Total Cattle Population in
Selected Countries for the Most Recent Year Available 66
4.3 Details of Cattle Output, 1953-1972 69
4-4 Fat Cattte Exports from Ireland, I932~-t97~ 74
4..5 Exports of Beef, 195o to 1972 78
4.6 Annual Slaughterings of Cows and Other Cattle at Export
Premises for Years, 195o-197~ 81
4.7 Retail Prices of Certain Cuts of Beef, Mutton and Pigmeat in
Recent Years 82
4.8 Percentage Distribution of Milch Cows by Breed, 1960--1971 83
4.9 Percentage Distribution of Cattle Artificial Inseminations by
Breed, 1969-1972 85
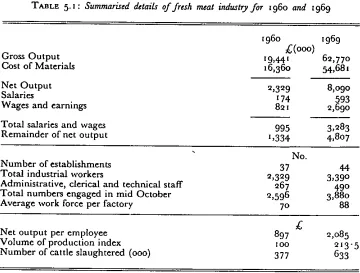
5. i Summarised Details of Fresh Meat Industry for 196o and 1969 88 5.2 Seasonality of Cattle Disposal, x963-197t 93
5.3 Average Monthly Prices of All Classes of Cattle Combined in EEC (Six) Countries Compared with those for Bullocks in
b: Dublin Market for the Years, 1969-197t 96 5.4 Classification of Factories by Number of Livestock Units
CONTENTS .7
5.5 Relationship between Quarterly Export Values of Fresh and Chilled Beef and Estimated AmountS Paid by Factories for Cattle
Producing th!s Beef, 1963-* 971 * o4
5.6 Ratios of. Annual Export Values of (a) Fresh and Ct~illed Beef .. and (b) Frozen Boneless Beef to AmountS Paid by Factories for
Cattle Producing this Beef, * 963-a 97 * i o 7
5.7 Value of Offal per Average Bovine for Representative Factories and Price per Cwt. of ~o-** Cwt. Bullocks for Years, [966/67 to
’972/73 lO9
5.8 Value to Economy of Live and Dead Cattle Exports in *971 [i3 5.9 Summarised Details of Fellmongery, Tanning and Dressing of
Leather Industry, 196o and 1969 i*5
APPENDIX TABLES
Table
la. Numbers of Livestock by Species and World Regions for Selected
Periods 25
lb. Production of the Major Meat Types by World Regions for
Selected Years 26
lc. Estimated Consumption per Person of Poultry Meat in Selected
Countries for Recent Years 27
A.* Rates per Container Charged by Different Hauliers to the Selected
Destinations 133
A.2 Average Total Transport Cost to Different Destinations for
Carcase Beef * 33
A.3 Average Total Transport Cost to Different Destinations for an
Animal Slaughtered in Ireland 134
A.4 Transport Costs per Live Animal to Different Destinations in the
Uffitcd Kingdom * 35
A.5 Estimated Total Transport Cost per Live Animal to Continental
Destinations * 36
A.6 Total Transport Cost Per Animal to Different Destinations i36 B.* Exports of Offals and By-Products for Selected Years x4o
FIGURES
Number
4. I Cattle Population, i86i-,97i 63
5.1 (a) Cattle Slaughtered at Export Premises and (b) Cattle Slaugh-tered at Export Premises Plus Certain Live Exports on a Monthly
8 CONTENTS
5.2 Average Price Per Cwt. of 8-9 Cwt. Heifers and Io---11 Cwt. Bullocks at Livestock Auction Marts (excluding Dublin) on a Monthly Basis for Years 1963-1972
94 5.3 Ratio of Monthly Export Values of "Fresh and Chilled Beef" to
Estimated Amounts Paid by Factories for Cattle which Produced
Acknowledgements
The authors wish to acknowledge the contribution of the Irish Livestock and Meant Board (CBF) who commissioned this study and who helped in various ways in supplying ideas and data, making contacts with ~ae various
people interviewed and conlmenting on earlier drafts of the ’text. In this connection particular thanks are due to Mr P. Needham, General Manager and to Mr Scan Mannion, Market Research Officer ~,ho made most of the contacts and did a considerable amount of background research for the paper, particularly in connection with transport and disposal of off-als. Thanks are also due to Mr J. R. Copeland of ,the Economic and Social Research Insti,tute who checked all the tables and helped’to prepare the text for publica,tion.
I
A Study of the Irish Cattle and Beef Industries
Introduction
T
nlS study was commissioned by The h’ish Livestock and Meat Board(CBF) and has heen prepared in close consultation ~ith,, it at all stages. W’he views expressed and conclusions reached however are solely those of the authors, and cannot ’be ’taken as representing the opinions of either CBF or the Economic and Social Research Institute.The aim of the study is to review the current situation and future develop-ment of the Irish cat.tle and beef industries in an international context, and
to suggest actions which might improve the contribution made by these industries to the national economy. To this end, world supply and demand trends for livestock and meat in general and cattle and beef i.n particular are analysed in the first two chapters. Chapter two includes projections of consumption and production of bee£ and veal on a world and regional basis. l-laving thus set the broad context within which the irish industries must operate, we turn in Chapter 3 to a more detailed consideration of the structure and likely development in the individual markets which are actual or potential outlets for Irish cattle or beef.
Chapter 4 examines past trends in the production and disposal of Irish cattle and discusses likely developmen.ts in the size and nature of cattle output in Ireland. lu Chapter 5 we analyse the position and prospects of the h’ish fresh meat industry. The contribution of this industry to the national economy is examined, its relationship with the live umde discussed and possible methods of assisting it are investigated.
Chapter 6 summarises the conclusions reached in the earlier chapters, and outlines our recommendations regarding the components of a coherent policy for the development of the ca,ttle and beef industries.
CHAPTER 1
The World Meat Situation Production
T
hE numbers of the principal meat producing species of domesticlivestock have increased substantially o~er" the past 2o years. This increase has applied to all species, and has taken place in e~ery con-tinent. As might be expected from .the increase in livestock numbers, world meat production has also risen considerably but the figures for the latter (particularly in the early post war years) are much less reliable than those for livestock numbers. Over the 2o years from ]95o to z97o, production of pigmeat increased by m9 per cent, production of bovine meat by 94 per cent, and production of mutton, lamb and goat meat by 59 per cent. In the case of the two grazing categories these percentage increases in meat pro-duction are much greater than the percentage increases in the respective numbers of livestock. This implies a considerable improvement in the output of meat per animal over the period.* The increase in pigmeat production, on the other hand, is very slightly less than the increase in stock numbers. Detailed figures of livestock and meat production will be found in the Appendix to this chapter. Statistics for ]97k and 197~ are necessarily less comprehensive ~nd reliable, but the indica.tions are that in both years there were small increases in cattle and pig numbers and a decline in sheep num~bers. World meat production appears to have risen moderately in both years, although in the case of sheep meat, this has been at the expense of a reduction in the size of the world sheep flock.Consumption
On a world basis, meat consumption is obviously more or less equal to meat production. It is primarily the rise in demaud which has stimulated the steady rise in production. The rise in total consumption can be attributed to the growth in world population, and partly to an increase in average meat consumption per head. While on a world basis the growth in population is a major factor, in the developed countries, which are of direct relevance to
*This large increase in cattle productivity appear~ very unrealistic and must be taken with great caution. (See Appendix Tabl~ la and ib).
TAnLE I. I : Estimated average annual consumption of meat* per person in selected countries, for certain yeats
A veragt t~
Country 1954-56 196o 1961 1962 1963 J964. 1965 1966 t967 Z968 ~969 197o 1971 ra c) O :Z
(it,.) O
United Kingdom 114 H7 119 124 123 119 ll6 H8 N9 Iz7 zz8 H7 I~O
Australia 217 207 2[4 214 2o~ 2o~ 196 l~9 181 177 205 193 207
New Zealand 2J 7 22{$ 223 235 240 237 230 226 225 224. 225 223 n.a,
Canada ,30 133 131 13o 136 14o 142 14o 146 zSI 149 151 161
USA 161 16z 161 164 169 174 I~ 168 178 I8] 183 186 192
Argentina 230 19o 213 216 195 17o 18o 202 213 213 220 n.a. n.a. ~C~
Ireland 96 io6 xo7 ill ii5 H7 121 121 12o 12o 127 I34 ~35
Denmark H3 12o x21 13o 126 124 ~23 125 124 128 125 J3o n.a.
Netherlands 71 77 78 86 " 86 75 80 94 Io7 Io4 xoo Io2 1o7
M
Went Germany 93 Io9 H3 :H8 H8 12o 12i x21 x24 13~ 134 I4o n.a.
Belgium 82 9o 89 94 Io7 99 ~o3 ~o3 ~o9 ~ ~ I 112 ~ 15 n.a.
¢~
France N3 I~4 H7 ~2~ ~22 ~25 z25 127 13o ~32 ~32 133 n.a.
Italy 3~ 43 42 46 52 55 56 59 63 72 73 79 82
Japan 5 8 9 H ~2 ~4. ~6 ~9 ~9 ~9 2o 23 n.a.
*Excluding poultry, n.a.----not available.
A STUDY OF THE IRISH CA’I~LE AND BEEF INDUSTRIES 15
Ireland, it is the increase in consumption per head which has been, and will continue to be, the dominant influence. Table 1.1 sets ou.t the pattern of (non-poultry) mea,t consumptiou per head in most major non-Communist developed countries. Figures for poultry meat consumption are not available for.all the countries listed and therefore cannot be included in this table. The available figures for poultry consumption are given in Table tc of the Appendix to this chapter.
It can be seen from Table ~.* that there are great differences between countries, not only in the level of per capita meat consumption, but also in its rate of growth. Of the cotmtries with a very high level of consumption, there appears to have been little change since the early Sixties in Australia, New Zealand and Argentina, while consumption per head in the USA is growing quite slowly. Of the remaining countries, per capita consumption in the UK appears to be virtually static, while most other European countries exhibit a fairly steady growth. The increase has been particularly rapid in Italy which started from a considerably lower level than the other coun.tries of Western Europe. A feature of the table is the extremely low level of meat consumption in Japan. Although there is a strong upward trend in Japanese consumption, the level is so low tha.t i’t is likely to be many years before Japan approaches European levels.
The consumption of meat per head in any country is dependent on a number of factors. These include the level and distribution of consumers’ incomes, the price of meat and of other commodities and also loca~ customs, tastes and preferences. While i.n some countries such as India, local customs and.beliefs are .the dominant factors, in the majority of cotlntries,the most important determinant of the increase in mea.t dentand is proba’bly the gTowth in real disposable incomes. In countries wi,th a low or moderate level of consumption, meat eating tends to shoav a.very fast ra.te of groweh as personal disposal incomes increase. On the other hand, the available statistics indicate tha,t as per capita consumption reaches the higher ranges it tends to level off regard’less of changes in income levels. Comparison of Australia and Ncw Zealand on ’the one hand and Italy and France on the other in Table ~.~ illustrates this dichotomy.*
It is more difftcult to illustrate the importance of price movemen,ts on demand for meat in general. This is because the prices of differen,t meats
follow different pa.tterns, and it is not possible to define wi,th’any precision the price of "lneat" as such. However, wha.t evidence there is, suggests that overall consumption of mea,t is only moderately respons.ive ’to changes in the general ’level of meat prices relative to prices of other goods and services.
16 THE ECONOMIC AND SOCIAL RESEARCH INSTITUTE
World Trade in Meat
Most of the world’s meat is consumed in the countries where it is produced, and although the volume of international trade in carcase meat has expanded. in recent years, it represents only about 5 per cent of xeorld consumption. Before .the war the proportion was about 8 per cent, but of a much smaller.
total consumption.
Very few coun,tries are significan~ con~tributors to world trade in mea.t. Australia, New Zealand, Argentina, Uruguay, France, Netherlands, Denmark and Ireland are .the main exporters, while USA, UK, West Germany, Italy, and in recent years Japan are the major importers. As might be expeGted, most of the exports of ’the European surplus countries go to the European importing countries, including the UK. The greater part of South American exports also goes to Europe. Australia and New Zealand primarily serve the US market, a~though significant quanti,ties, especially of mu’tton and lamb are sent to Japan and UK.
Types of Meat
Just as consumption of meat in general is related to personal income, relative prices and local customs and preferences, so is the breakdown of meat consumption between the different types of mea.t. Although bovine meat predominates in world consumption, the proportion it representsof total carcase meat consumption varies widely. Thus in Argentina beef accounts for about 84 per cen~ of domestic meat intake, while in Denmark beef and veal together account for less than 4o per cent, and are well behind pigmeat as a proportion of ,total consumption. The proportion of beef and veal in total meat consumption in various coun.tries for recent years is shown in Table 1.2.
In .the case of individual meats it is possible to speci[T more precisely the relationship between consumption, i~acomes and relative prices. While local tradi’tions and preferences .tend to dominate when comparing meat sumption patterns between countries at any point in time, changes in con-sumption within each country can be related ’to changes in incomes and prices. These relationships are usually measured as income and price elasticities of demand. Thus the percen,tage change in consumption of a meat per person in a country associated with a ~ per cent change in real percapita income is known as the income elasticity of demand for that meat. Similarly the percen.tage change in consumption associated with a J per cent change in the price of a meat relative to all other prices is known as the price elasticity of demand for tha~ meat.
A STUDY OF THE IRISH CATTLE AND BEEF INDUSTRIES I 7~
%
T
.5
.
NTHE ECONOMIC AND SOCIAL RESEARCH INb"rlTUTE
estimate them accurately. However, various studies indicate chat the i,ncome elasticity [’or meat in general is higher than tha’t for most other foodstuffs. There are of course considerable variations from country to country, and in high income, high meat consnming countries such as USA, Australia and New Zealand, the income elasticity of meat .tends to be low because sa~tura-tion point has been virtually reached. In the original six EEC countries on the other h~nd, the income elasticity of meat has been estimated at o.47,t indicating that a I per cent rise in real income tends to be associated with an increase of abou,t ½ per cent in meat consumption.
With regard to specific meats, various studies indicate that in most countries the income elasticity of dema,nd for beef tends to be higher than that for pork or mu.tton bu’t lower than that for lamb. For example, the income elasticity for beef in the original EEC has been estimated by FAO as o.52 compared with a pigmeat elastici,ty of o.3o) An alternative study" gives the beef and pigmeat elasticities as o.77 and o.44, respectively. T.he income elasticity of demand for poultry varies grea~tly from country to country. In the USA it is very low, indicating an approach to saturation level, whereas in most European coumries it is higher than for other meats, being estima,ted at i.oo for the EEC "Six" in the FAO study quoted above. The concept of price elasticity is more complex than that of income elasticity. Consumption of a particular type of meat is affected not only by its own price but also by prices of other goods, and in particular by prices of other mea’ts. :The effect on consumption of beef, for example, of a change in the price of, say, pork, is referred to as .the cross-price elasticity between
beet and pork.
The British National Food Survey Committee~ calcula, ted i.ts own price elasticities for the major meats in the UK for the period 1956 to 1966, with
the following
results:-Beef and Veal -1.3o Mutton aud Lamb -o.52
Pork -1.24
Poultry -1.26
These figures indicate .that heel, F, ark ~nd pouhry have high own-price elasticities, whereas that for mu’~ton and lamb is relatively low. Thus accord-ing ,to ~e figures an increase of l per cent i’n the price of beef, pork or
IFAO "Agricultural Commodity Projections 197o-8o". Rome 1971.
mSoren.~n. L. and Hathaway. D.E. "The grain Livestock Economy and Trade Patterns of the European Economic Community with projections to t97o and t975". Institute of International Agr cu ture Food, Nutrition and Rural Develop.ment, Michigan State University, 1968.
A STUDY OF THE IRISH CATTLE AND BEEF INDUSTRIES 19
poultry is associated with a decrease of about 1.3 per cent: in the consumption of these commodi’ties, whereas an increase of l per eem in the price of mutton and lamb is associated with a decline of abou, t 0.5 per cont in its consumption.
In the same exercise an attempt was made to calculate the cross elastici.ties between the various meats, but the results were disappointing. All the co-efficients derived were sta’tistically insignificant at the 95 per cent level, wich .the exception of one ~,hich had a "perverse", negative sign. Despite the absence of statistical evidence, it can nevertheless be assumed ,that there must be some degree of positive cross elasticity between meats, with consumption of lamb for instance rising in response .to an increase in the relative price of beef.
As i’n the case of income elasticities, the own price elasticities given above can be regarded as showing no more ,than approximate orders of magnitude, and cannot be used to ’provide accurate forecasts of the level of consumption of particu,lar meats. However, they do indicate that the British market is very sensitive to changes in the relative prices of mea.t, and is subject to considerable changes in the composition of meat consumption in response to shifts in relative prices.* Thus the fall in .the proportion of beef and veal
in the UK market between 1963 and 1966 shown in Table l.~ can be traced to .the steep rise in beef prices between those years.
This experience in the UK and in other conn,tries shows that if beef prices con.tinne to rise relative ’to other meats, then these other meats, and in particular ponltry, will tend .to replace more and more beef in ,the human diet. That beef and veal prices have risen relative ,to poultry and pigmeat prices i’n EEC (Six) may be seen from Table i.3. This table also shows how prices for ca, rtle, pigs and poultry have moved compared with consumer prices in general, and demonstrates ,tha,t while the real price (actual price divided by .the consumer price index) of cattle rose between 1962 and 1968, the real prices of pigs and poultry fell substantially.
These changes in relative meat prices reflect ,ehe interplay of demand and supply factors over .the period. The demand faotors have been discussed already, and provide the comext within which supply conditions can be said to determine the relative prices. A brief consideration of these supply con-ditions is therefore necessary to understand ,the relative price movements.
’THE ECONOMIC AND SOCIAL RESEARCH INSTITUTE
T.~LE t.3: Estimates of average annual changes in real producer-prices for specified types of
livestock in the EEC ’Six’, 1962-1968
Average annual change in
Money price to Consumer Real producer
livestock price index price
producers
(Percentage)
Cattle 4"3 3"5 o.8
Calves 5"5 3"5 t "9
Pigs ~-t 3’5 --2"3*
Poultry o’3 3’5 --2-9*
* Minus = decrease.
Source: Roberts, I.M. and Miller. G. L. *’An Analysis of tim EEC Market for beef andveal"
Quarterly Review of Agricultural Economics, Vol. 24 No. 3. Page 139, July, 197t.
In the case of poultry and pigmeat .the two-way relationship of supply and price is fairly normal. An increase in the price of these meats relative to the cost of producing them can be expected to result fairly rapidly in an increased supply, which in ’turn will itself tend to limi.t the increase in price. Since the early Sixties there have been far reaching changes i’u management and prodnction techniques for both poultry and pigs, which have had the effect of substantially reducirng the real cost of production of both types of meat. In consequence supplies have increased rapidly, and prices have risen by much less than the consumer price index.
The price/supply relationship with regard to sheep is also normal, as the value of the wool clip is small in relation to the value of the carcase. How-ever, there have been no dramatic reductious in the cost of producing sheep, and consequently shccp uun~hers have uot shown the same rapid increase as poultry or pigs. Nevertheless it appears probable that any substantial and sustained rise in mutton or lamb prices would resul~t in a’n increase in sheep production.
sup-A STUDY OF THE IRISH Csup-ATTLE sup-AND BEEF INDUSTRIES
plies to be in surplus, the rela.tive rise in beef prices has been reflected in only a small increase in ~tttle numbers in Europe. Even if future pricing and support policies succeed in weakening she link between milk prices and beef cattle numbers, the long period of production of beef cattle will ensure that the adjustment of European beef supplies to beef prices will be very slow, compared wi’th the adjustment of other meat species. This long pro-duction period, allied .to uncertainties concerning ,trade barriers, also militates against ’the rapid adjustment of imported supplies to changes in European beef prices.
Sttmmary
Under the stinmlus of rising population and real incomes, world demand for meat has been increasing steadily. This increase is likely to contiaaue especially in Europe. If the relative prices of different mea,ts were to remain constan,t, rising real incomes would be expected to result in consumption of beef growing more rapidly than consumption of meat as a whole.
However, relative prices .have not remained constant in the past and are unlikely to do so in the future. The much shorter production periods, and major technical developmcnt in production techniques, have increased the production of, and reduced the costs of, poultry and pigmeat relative .to beef. The resulting relative rise in beef prices has had the effect of diver, ting consumption from beef towards poultry and pigmea,t in many European coun’tries, including the UK.* The shift caused by the ra’pid changes in pig and poul’try technology compared with that of cattle is unlikely to be as great in the coming ,ten years as in the past decade. However, the link between milk prices and ca.ttle numbers, ,together with the greater dilficulty and longer time invoh,ed in increasing beef prodnction in response to higher beef prices, where these are relevant, is likely to ensure that beef prices continue to rise relative to those of other mea, ts. Nevertheless, so far as most European coun,tries are concerned, the growuh in demand for meat as a whole, and the relatively high income elasticity for beef, should combine to bring abou,t a continued rise in per capita "beef and veal" consumption in spite of the likely increase in relative beef prices.
APPENDIX TABLE xa: Numbers of livestock by species and world regions for selected periods (a)
¯. North and
Species and Period Europe USSR Central South Asia China Africa Oceania WOrld
America America Maulland
Cattle
,947-52 ’(average) loo.o 55-8
196o--65~ ~, ,, 7"o 83"5 ,969-7o ,, 124"5 95’o Pigs
1947-52 ,; 69"2 ’9"7 55"5
,96o--65.. ,, 1,3.8 57.8 76.4
,969-7° ,, ,3o’3 56-1 8z.9
1947-52 . ,, Ii9.8 76-9 39.o
t 96°’:65 ,, 134"o x33"9 37"3
1969-7o ,, 128.7 ,3o-7 28.o
Goats
1947-52 . ;,. 24.0 t5-6 .ioq
196o-65 . ,, 14"5 15-1 15"5 1969--7o ’ ,, t2"7 5"t ’4"4
Bt~ffaloes . . .
,947_52 " ,, o’5 0"3
,96o-65 ,, o’4 0"4
--’1969-70 " ,, 0"3 0"5
--(million head)
II3’4 135"8 229"8 44’5 99’2 19"7 798.2’
i5z.7 ,69.o 275.0 6i.~ 13o-2 25.4 zo13.6
’68’4 ’97"7 288"7 63"~ x5"o 30.0 t I I8.2
6653516
2o"9 68"4 4-’5 x "9 295"5
4o.2 ,94.o 5-6 2-5 556.8
8o.6 48.o e:to.o 6-5 3.2 626.6
I23.6 136.4 31.I lO5-O 145.4 773.8
121.2 177.4 64.5 126"o 2If.4 1oo5-8 ~23-I 2o5.4 7o-6 z49.1 237"3 1o7~’6
’9"9 113:~ 23.3 84"9 0-2 29t:2
~6-5 ~ 42-2 23-7 i o3-8 0-2 362-8
3oq 145"9 57"o i i9.o 0.2 384.4
-- 65.6 121-o " ,.2 -- 88-7
o- 1 85.3 ~8-o , .6 -- 1 ~5"7
o. i 9’:t. 5 29.3 v8 -- ~24.5
o
"tl
,:4
b~
,,rl
c2
(a) Excludes poultry for which reliable figures are not available.
APPENDIX T.~LE Ib: Production of th~ major meat types by worm regions for selected years
North Latin
Meat in Dressed Carcase weight ( a) Europe America America .Near East Far East Africa Oceania World
Beef and Veal (ooo tonnes)
1948-1952 (average),,
4’178 5’288 4’643 ~475 1,2268931,8931’4281,22682° 20,680
I96X-1965 7,188 8,898 5,77t 31,735
197o ,, 8,630 I 1,56o 7,135 793 1,4o3 2,072 1,483 4O, lO3
Pigmeat
1948-’x952 ,, 5,246 5,313 994 8 523 I43 s~8 I5,99t
~961-1965 ,, 9,687 5,832 1,425 8 1,3o2 177 165 28,905
197o ,, 1t,343 6,187 1,744 18 2,788 u53 225 33,369
Mutton, Lamb and Goat
1948-1952 (average) 683 299 407 496 523 553 656 4,332
1961-x965 ,, 99° 357 4~o 781 614 688 I,O75 6,298
197o I,o26 260 473 869 671 852 1,335 6,886
Total Meat (b)
1948--t952 ,, IO, IO7 IO,9OO 6,044 88O 1,939 2,124 ~,605 41,OO3 1961--1965 ,, ,7,865 I5,O87 7,616 1,435 3,143 2,758 2,466 66,939
1970 21,oO4 18,oo7 9,352 1,680 3,889 3,177 3,O43 80,358
0 0 0
(a) Data relates to the production of meat from indigenous animals, i.e. including the meat equivalent of exported live animals and excluding the meat equivalent of imported animals.
>
APP~NI~L’~ T^~r,~ I c: Estimated consumption per person of poultry meat in selected countries for recent years !
o Average
Count6’, 1955/56 t96o t96z x962 1963 x964 1965 z966 t967 1968 z969 t97°
West Germany 4"1 9"3 t t.o t~’6 t l’7 12"8 13"4 t4"3 t5"2 16.1 16"7 18"3
,.e Italy 4"1 7"9 9’t zo’2 11"7 12"1 t6’l t6"3 t6"l n.a. n.a, n.a.
Denmark 6.8 7"2 7"7 8.2 7"7 8"4 8.6 8"6 8"6 8.6 n.a. n.a. United Kingdom 6.8 t2’5 t3"9 t4’9 t4’9 15"8 x6"4 17’5 18.8 at’o 2~t.t ~3-t t"
Ireland H.9 tPo It"4 tt’7 t3’4 15’o 16-1 18.6 t8"3 21-2 22.6 2~.1
Canada a4"9 27"7 3~’t 3Po 33.0 35"1 36"7 39"3 4o"7 39"7 4.2"8 44"8 > United Stat~ 28"t 34" l 37"4 36"9 37"5 38’3 40.8 43.8 43"7 44’4 n.a. n.a. Australia 9’7 9"7 9"7 9’t 9"7 n.a. xI’5 13"8 t6"4 t8.6 19"6 n.a.
t.l n.a. ----not available.
CHAPTER 2
Beef and Veal: The International Background
Production o/ Bee/ and Veal
R
in Table tb of the Appendix to Chapter ~. As can be seen fi’om thisEGIONAL totals for world produotion of beef and veal were given table, total world production increased from about 32 million tonnes* in 1961-65 tO over 4° million tonnes in 197o, or by about 3-4 per cent per annum. Over this period the greatest increases have occurred in North America where production expanded by 6.3 million tounes. The next highest increase of ,t.4 milliou tonnes occurred in Europe, followed by Latin America with ’2-.5 million tonnes. Increases in the rest of the world have beenmuch less marked. In the Far East, Oceania and Africa, tbe respective in-creases in each case over the ~o year period have been about 0.6 million tonnes. ,The production of beef and veal in some of the most important pro-ducing countries is given in Table ~.~. A few of these countries exclude the meat equivalent of live exports from their figures for production while others include them. For this reason tbe figures are not entirely comparable. However, for any particular country .they show clearly the year to year trend. Reference to Table 2. t shows that world production of beef and veal is dominatcd by three cotmtries USA, USSR and Argentina in that order. Next in order of importance are France, Brazil, West Germany, United Kingdom and Ireland combined, Australia and Canada, with the other countries very much lower down the llst.
Consumption
Consumption per head of beef and veal in the major consuming countries is shown in Table 2.2. It can be seen that Argentina aud Uruguay have by far the highest per capita consumptiou, followed by the developed coun,tries of North America and Oceania. European consumption on the whole is considerably lower. In some Etu’opean Countries consumption has been growing quite rapidly while in others it has remained static. Thus for
TASLE 2. : : Estimated production of beef wtd veal in selected countries, t962-:97o
o
EEC 1962 1963 :964 t965 1966 1967 1968 :969 197o
(coo tons)
Belgium Lux. :92 212 tg~ 189 204
5~: 232
240 252 =
France 1,473 t,466 :,336 1.418 1,462 t, [ 1,622 t,575 1,5:9
r~
We~t Germany 1.121 Lt66 t,H8 1,o75 IA4o :,t
l,t~9
L24! t,261 O
Italy 671 623 54° 539 546 5 5 9 592 n.a. O
Netherlands 267 3o9 261 271 270 284 ~95 289 338
Total EEC (Six) 3,724 3,776 3,447 3,492 3,631 3,825 3,896 3,937 n.a.
t~
United Kingdom (a) 9o4 929 862 818 854 9o7 89t 857 933
Ireland (b) i~4 127 I I t I t I t33 2t9
:~
195 213
Denmark i75 177 t54 t52 :9t 259 2 254 233
Total EEC (Nine) 4.927 5,oo9 4,574 4.573 4,8 to 5,2 to 5.239 5,243
United States 7.~82 7,746 8,679 8,8o3 9,t89 9,365 9.~]3 9,732 9.928
Canada 633 686
7~
854 847 843 723 722
Australia 79t 9z4 t,ot o 93 t 865 89o 920
39~
New Zealand ~82 293 287 27 t 287 297 339
2,~
Argentina 2.34t 2,564 : .987 L964 2,284 2,5O9 2.559 3,7°o
Brazil
t.21~
t,t 73 t,t 39 t,o92 t.43o 1,491 1.525 n.a. n.a.
Uruguay 302 385 4o3 257 238 285 n.a. n.a.
Soviet Union 3,26o 3.6oo 3,5oo 3,8oo 3.8oo 4.3oo 4.3oo n.a. n.a.
Japan 144 t83 220 204 1,54 t44 148 n.a. n.a.
UK(c) 799 817 768 774 76t 820 784 776 866
Ireland(d) 266 292 3o2 259 289 376 3~4 ~t~ 3~
(a) Includez production from imported live cattle.
/
bl Exclude* production from exported live cattle.Exclude* production from imported live cattle. Includes production from exported live cattle.A STUDY OF THE IRISH CATTLE AND BEEF INDUSTRIES
31
M
t~
~D
t~D
C~
~-~’~ ~.
~:~
~- ~- ~:~-~
o
THE ECONOMIC AND SOCIAL RESEARCH’ INSTITUTE
Europe as a whole there is some tendency for consumption to rise in con-trast to the high consuurption countries, which, with the exception of the USA, show no upward trend.
Exports oI Carcase Bee] and Veal*
In pre-war years the world beef export market was largely domina,ted by Argentina. In 1938 that country exported about 438,ooo tons of carcase beef and veal, which was about 58 per cent of .total world exports. In that year also the next most i.mportant exporters were Australia, Uruguay, New Zealand and Brazil in that order, with Australia supplyiug about 36 per cent of total world exports?
During and immediately after the war Argentinian exports remained at a relatively high level, but in ,95o a substantial decline occurred. By 1953 her exports were only about one fourth the ]938 level and she sos only in second place to Australia, which exported in that year ,56,ooo tons as against ll3,OOO .tons in J938. After .that date, however, Argentina recovered her former doluinance and has retained it up to the present time. Countries with very much increased exports in recent years as shown in Table 2.3, are Brazil, Uruguay, New Zealand, Fra.nce, Netherlands and Ireland. Since the early J96os exports of beef from Australia, New Zealand, and France have about doubled, those from Ireland and Netherlands have increased threefold, while those from Brazil have increased even more dramatically.
The distribution of exports from the principal exporting countries is shown in Table 2.,t. As can be seen, the large European exporters like France, Ireland and the Netherlands send most of their produce to other European coun.tries; Ireland exporting mainly to UK, with France and Netherlands sending most of their beef to West Germany and I,taly.
The United Kingdom is ~the largest single impol,ter of Argentinian beef but the proportion going to this market has declined considerably over the years. In ]959 about 6o per cent of Argentinian exports went to the UK while in 197o the proportion was under ~5 per cen,I. Argentinian exports are now far more diversified than they were in the past with substantial quan-tities going to Italy, West Germa’ny, Spain, Greece, USA, France, Nether-lands and Belgium.
Australian and New Zealand exports go mainly to the USA and to a much lesser extent, ,to the United Kingdom. In recent years the Japanese market is taking some Oceanic beef but as yet the quantities taken are ra,ther
* The available foreign trade statistics give tqg~re~ for carcase beef and veal, but do not distingnish tinned meat as between beef, pigment and offals.
~See O’Connor, R., "The world meat situation with special reference 1o Ireland". Tech, Series No. ~,
A STUDY OF THE IRISH CATTLE AND BEEF INDUSTRIES 33
o
o~
¢,o
o~
CO
.o
O~
c~
lid
l.O
Ce~
O
~D
CO
oCO urscOtO c~ l--- c~ - 0~ ~’h~ 0
O
,~*
C e)
C~
--o
ir~ L,~ C~ q~ CQ~ U"~ Ohio CO 0
-0
--~ ;.
v.~.
~
>. -~
d
6=
T.~ 2.4: Distribution of exports of carcase beef atut veal, x969 and z97o Importers United Kingdom United States Belgium France Git’¢¢cc Italy Netherlands Spain Swimedand West Germany Czechoslovakia Japan Exporters
Arg’-~-~’-" AustndT- 2,ecw Zea!and Uruguay Denmark France Irel’~--~ Ate~lands
~_l~_l~0 ’97° 960 ’97° 96° 97° °°9 97°
~91 97°b =9691 97° I I I I ....
1~9 ’9./°i
9~9 ’97°t
(ooo tons) 122"~ a4"o 15.6 20.7 28"6 38q 32.5 3-/.6 IO’l 25-3 6"o 0.4 36rl 57"8 418.9
54’4 ] =3"8
25.= 2os.4 14.7 --24"4 30’7 43"o 19.o 37 "9 nq o"3 43’6 9"5 0.4 z4.7 318.8 230.2 52.4 2z.8
26’7 ~o.6 ~4’o ~3H 96.5 88.0 o.1 o,2
o.i
o.z 0-6 0"3 0.6 0.6 = -~ o,i
z6"2 =’9 3"3 ~75.x xlo’2 Eo6-9 47.6 21.3 68-z 322-7 =31"5 175"c
toI’5 i!) = t.4 84.8 ] ~ ---- 3 xa9 3o~7 a
o~4
o~
2 oqa 18.9 13"9a96
,i4
3~3
~4.4
45.5
6"5 o.2
--a a a
°~4 0.2 a a
118"7 =35"8 85"4 i.x 2-4 9"5
[ [ 19"8 =38"2 94’9 r, oh~[ r foot uan[~ ;~ countries 365;:8 318"8 230.2 275.x I 10"2
to6-9 88"2 91,2 6o’4 57"8 t7.6 89"2 H8-7 =35.8 85.4 io3.o 52"4 2 [ .647.6 2="3 68-x 14"3 36.7 l 17q = 1.6 5-1 ~3’4 [.i 2-4 9"5 9"7 Tota/
1
418.9 37t’a 25~’o 322-7 =3r5 175"o =o~.5 =27.9 77"5 69"4 ~’7 I 12"6 [ =9.8 =38.= 94’9 11~’7 ,do o o
A STUDY OF THE IRISH CATTLE AND BEEF INDUSTRIES 35
small. In ~97o lnost beef from Uruguay wen’t to West Germany, Italy and Czechoslovakia with smaller quan,tilies going to Greece, Spain and the Netherlands. None of this meat ~,ent to the United Kingdom ’that year. It might be men,tioned, that as a resuh of foot and mou,th disease precautions, only boneless beef from South Alnerican countries is now allowed imo Britain. This precaution has raised prices considerably on she British market, since cheap frozen South American carcases are no longer available.
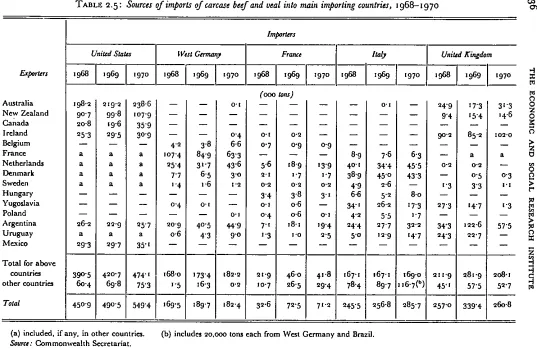
Sources of imports into ,the chief importing countries are shown in Table 2.5. This illustrates ,the principal trade flows already discussed from the point of view of the major iorporters. Because they are taken from different basic sources, the figures in Tables ~.4 and ’~.5 do .not ahvays correspond. With regard to ,she future, it is expected that there will be some important changes in the pattern and volume of trade, as the deficit between produc-tion and desired consumpproduc-tion in ,the developed countries of Europe and North America con’tiuues ’to grow.
Proiections [or Beef and Veal
Estimates of future "beef and veal" consumption and production have been made ’by two world bodies, FAO~ and OECD: The assumptions under-lying the tavo projections differ to some extent, and ,the period covered by them is not the same. Nevertheless, the two are comparable in that they project ,trends in the same direction and of roughly ,the same order of magnitude when allowance is made for the different dates referred to and the different price assumptions made.
We have chosen the FAO stndy for this discussion ra’ther ~han that of OECD as i,ts coverage is wider and because the da,te to which it refers, t98o, is more relevant for our purposes. The most important assumptions used by the FAO are that population and personal income will con.tinue to grow in line with past trends and tha’t relative prices (between meat types and between aH meat and other products) will not’ cha.nge over .the period pro-jected except in ,the cases of Denmark, Ireland and the UK, where prices are assumed to move in,to line with existing EEC levels. Also it is assumed that technology will continue ’to evoh,e as in the recent past. The projections are shown in Table 2.6.* They are presented in two blocks of four columns each, vile first block referring to the base period 1964-66 and the second to the year projected, t98o.
*FAO Agricultural Community Projectiom 197o-t98o. Vol. t l. p.81. ~OECD Agricultural Review, 197t, No. 4, P- I t5.
TABLE 2.5: Sources of imports of carcase beef and veal into main importing countries, t968-t97o
Importers
United States |fft~t Germany France Italy United Kingdom
.rte.. : 197o
V l, 197o
.197o
,97o
(ooo tons)
Australia 31 "3
New Zealand q’6
Canada
Ireland xo2.o
Belgium
France a
Netherlands
Denmark o.3
Sweden I. l
Hungary
Yugoslavia I "3
Poland
Argentina 57"5
Uruguay Mexico
I Total for above [
countriesI 39o’5 420"7 474" t 168"0 173"4 182’2 21"9 46"0 41"8 t67-t 167"s 169-o 211’9 28t"9 20~’1 other countries 60.4 69-8 75’3 P5 z6-3 0’2 ]o’7 26"5 29"4 78-4 89-7 H6-7(b) 45.1 57"5 52"7
Total 450"9 490"5 549"4 169"5 x89-7 t82.4 32.6 i 72’5 71"2 245"5 256.8 285"7 257.0 339’4 260.8
(a) included, if any, in other countries. (b) includes ~o,ooo tom each from West Germany and Brazil. Source: Commonweahh Secretariat.
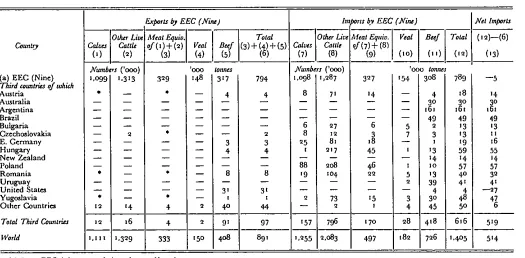
A STUDY OF THE IPdSH CATTLE AND BEEF INDUSTRIES 37
The first column in each block relates to production, the third column gives figures for consumption, and the difference between these is designa~ted "net import" for the base period and "ba’lance" for the years projected, it is the columns of imports or balances which are ’the crucial elemen.ts of each block, since these show the exten,t of every major country’s and region’s surplus or shortfall ill supplies. The countries are arranged so that they aggregate progressively down the page, eventually providing a world total, where this is appropriate.
Some of the projections for individual coun.tries are hard to accept, even on the assumptions made. The most obvious example is that of Ireland, where ~t seems highly improbable .that the negative effect on consumption of adjusting to EEC prices should so far outweigh the positive influence of continued economic growth. In our opinion, Irish consumption per capita is far more likely to be maintained, or even to increase slightly, than to fall from 37.8 lb. to 29.7 lb. as projected in tile tahle. Nevertheless, despite these reservations we think that the majority of the projections, especially those at a more aggregate level, appear reasonable on the specific, rather artificial assumptions made by FAO.
Of course the projections made in the table will not be realised in fact. A significant world imbalance, such as is projected, simply cannot exist, for consumption of meat camlot exceed production, except very marginally for a very limited period. The pricing mechanisnl will work to avoid the im-balance by forcing prices sufficiently high to restore im-balance at a lower level o[ consumption ,~an .that projected. Thus by its own logic, the price assumption underlying the projections cannot be sustained if the projections
themseh,es are at al’l accurate.
This does not imply by any means that the projections are withou,t value. By estima’ting the likely pattern o[ consumption, production and ’trade on
the artificial assumption that relative prices remain constant, the Study indicates ’the a’pproximate degree of pressure on world beef prices. At the same time i,t shows ’those cotmtries and areas where the balance to be im-ported by the end of ’the decade is likely to be largest, for although the absolute level in each case is too great, ’the rela, tive position of each country cou.ld well prove qui.te accura’te.
T^sLz 2.6 : FA 0 beef rout veal balances for 1964- x 966 cmd projections for x 980
1964-1966 Average t96o(*) Projection
Cona~mlption Consumption
Production Aeet Import Total Per caput Production Balancelel Total Per caput
(ooo tannin) (lb.) (ooo tonnes ) (lb.)
Bclgium/Luxem6ourg 207 16 2~3 5o’’~ °-47 93 34o 70"8
West Germany i.o33 236 1,269 49"5 1,458 340 ~.798 60"9
France 1,436 --52 x. 84 6O’5 ~,o45 -- s2o 1.925 77"0
Italy 495 272 ~63 37"o 73o 837 1,567 59"4
Netherlands 239 -- 13 226 4o’5 35o io 36o 54"6
EEC (Six) 3.41o 560 3.97o 43"o 4.83o I, 16o 5,99° 64"9
UK 8o8 496 1,3o4 52.8 I.I 76 231 1.4o7 5~" I
Ireland 286 -- 236 5o 37"8 451 -- 4o9 42 29"7
Denmark 232 -- I~3 69 3P7 i qo -- 123 67 27"7
EEC (Nine) 4.736 657 5,393 -- 6.647 859 7,5°6
--Other Northern European 578 6 584 -- 659 127 786
--Other Southern European 521 ~6 547 -- 974 357 1,331
--Wcsterrl Europe 5,635 689 6.524 41"8 8.e8o i .343 9.623 55.2
North America 9.73o 537 Io,~67 ro5"4 14.°93 1.x98 15’291 132"7
Occanla 1.238 --456 762 1~2.8 1.941 - 727 I,~t 14 ]42"6
Other developed countries 714 13 727 13"2 981 314 1.295 t 9" i
Economic: Cla~ x (d) 783 58"3 25,295 27’423
17’ 17
18.3oo 2,1~8 75"o~
Economic: Class 2 (d) 8.~56 --878 7,978 = 1.4 15,3ol -- 1,762 13,539 t3’o
Economic: Cla~ 3 (d) 6,627 -- 152 6.475 12-5 I 1,196 IAO8 t2,3o4 18"5
World 33,0o0 --~471~) 32,753 2t’3 51,792 E,474 ~3’266
--(a) Including adjustment of the original projections for UK. Ireland and Denmark in anticipation of accession to the EEC in January, 1973. Icb¢
Imbalance resulting from changes in stocks and use of conversinn rates diffcring between somc importing and exporting countries. This represents the diffcrcnce between projected production and consumption.
(d) For the purpose of analysis the FAO divides thcworld into thrcc Economic Classes. Class t rcfers to devclopcd countric~, Class ~ to the developing countries and Class 3 to the ’Eastern European and A~ian Ccntrally Planncd cconomies.
JCote: "Production of meat is that obtained from the slaughtering of indlgcnous animals plus live animals exported, all expressed in terms of carcase weight equivalent. Trade in 6vc animals and meat. in processed or unprocc~ed form. is .xprcxsed in carcase weight equivalent".
A STUDY OF THE IRISH CA’i~FLE AND BEEF INDUSTRIES 39
result of the shortage, can be expected to restrict consumption and encourage production to the ,point where the UK beef defici,t will be considerably lower a.t the end of the Seventies ’than it was ill the mid-Sixties.
CHAPTER 3
The Market Situation for Beef and Veal
iT was seen in Chapter 2 that the Uuited States market is now the most |important outlet for beef in the world. In 197o ’this country imported --~almost 55o,000 tons of carcase beef and xeal compared with imports of 286,ooo tons by Italy, 26t,ooo tons by UK and 18~,ooo tons by West Ger-many. Smaller importers were Spain 88,ooo ’tons, France 71,ooo tons, Canada 64,000 ,tons and Netherlands 43,000 ’tons. The demand situation in each of these countries is of interest to Ireland, and is described briefly below.
USA
:The United States is far and away the largest beef producing and con-suming country in ’the world. In ~97o she ,had ~t2.3 million cattle from which were produced 9,928,ooo tons of beef and veal.~ Though the cat,tle population of the USA is growing at a faster rate than the human populfi-tion, production cannot keep pace with consumppopulfi-tion, and imports are growing ever)’ year. lu 1956 consumption of beef and veal was 95 lb. per head of ,i_he population. Production was almost exactly equal to consumption, so that imports and exports ahnost cancelled each other out. In ~97o on the other hand, .hough production reached io8 lb. per head of the population and exports remained insignificant, imports were a’lmost 55o,ooo tons because consumption in that year was 117 lb. per person. Nor is i’t likely that this level of imports will decrease seriously in the coming years. Consumption is not likely to level off for some years ,to come and during this time production will not keep pace with this growth. Hence it appears tha’t present main suppliers like Australia and New Zealand will have little difficulty in dis-posing of their exports over the coming years even ,though they may be excluded from .the EEC market.
Over "the last i,t years the US market has proved a very valuable and remunerative outlet for Irish boneless cow beef, and we exported on average about 3o,ooo tons to this market each year. At the present time because of in.tensive stock building and a partial switch .to continental markets, fewer cows are available for this trade and exports to the US declined ’to 7,ooo tons
42 THE ECONOMIC AND SOCIAL RESEARCH INSTITUTE
in 1972. Whether they return to their previous level again will depend on price levels in the USA and EEC. A’t the present time EEC prices are higher than US prices and most of ,the availahle cows are now tending to go to Europe. However, it seems quite possible that in a situation of world shortage US prices may be forced up ’to European levels. If this happens, it is likely that the Irish trade with ,the US will be resumed, as our cows seem to be particularly suitable for the US market.
UNITED KINGDOM
During the years up to and including 1961 the United Kingdom ~"as the largest importer of beef and veal in the world. Since 1962 however she has been superseded by the USA as the major Ivorld importer. This si.tuation has come abotrt simply because US imports have increased whereas United
Kingdom imports .have declined, this decline being associated with increased home production and with reduced consum,ption due to higher prices.
The detailed breakdown of imports given in Ta.ble 2.5 of Chapter 2 showed that in 197o Ireland supplied ,the bulk of British imports, with Argentina second on the list and Oceanic countries rather far down the line. It is a big cha.nge from ’past ]~atterns to see Ireland superseding Argentina on the British beef market, a resul,t w,hich has come about due to increased Irish catde numbers, to the beef snbsidy arrangements associa’ted with the Anglo Irish Free Trade AgTeement, and to foot and mouth regulations in
Bri,tain which prohibited the import of "bone-in" carcases from South American countries.
Sources of British home killed beef are given in Table 3.~ which shows .that supplies from UK bred cattle almost doubled between 1938 and 7963, ~ince when .they have remained fairly stable at about 8oo,ooo tons per annum. The increase in pvodncdon since pre-war years has come ~bout as a result of two
factors:-(1) a substantial increase in cattle numbers over the period and
(2) a large decrease in calf slaughter, particularly in recent years.
’o~
,
" " I
4~
0 0
&
~.n
~ I~.~-~.~ ~-~ ~- ~.~.~<.D~
n
~
v~
P
S~tl~I£Sll(Ii~I ~3g~[
U~V ’~’IIJ.VD,
HSI~II gH£ ~IO AUflJ.g
44 THE ECONOMIC AND SOCIAL RESEARCH INSTITUTE
for further reductions in calf slaughtering is therefore not very great as a certain number are always likely to be required for veal for domestic con-sumption and possibly for export. There is scope, however, for further in-creases in beef cattle particularly on the hill farms of Northern England, Scotland and Wa’les. If the beef incentive schemes are continued (which they will be during the EEC .transitional period and probably afterwards) these increases are likely to continue. With increasing home production of cattle and the renloval of the UK deficiency payments scheme, the denland for tradi,tional Irish stores is likely ,to decline. However, as Britain is quite likely to develop a strong export trade in fat cattle with the continent she will probably continue to import Irish stores but probably of a lighter weight than at present. In future many stores are likely to go for fnishing to the grain producing areas, as in times of surplus production it would be more profitable to feed surplus grain to cattle (particularly young cattle) than put it into i.nterventiou (i.e. sold .to Commission at intervention prices).
THE EEC MARKET FOR BEEF AND VEAL
The European Economic Commnnity has gradually built up a Common Agricultural Policy (CAP) which was finalised in June 1968. The regulations governing ’this policy set out all arrangements covering prices and foreign trade and apply to live cattle and calves and to beef and veal. It provides for the free circulation of these products I~ithin .the community and is aimed at ensuring stabili,ty of EEC markets, growth in production, and security and fair returns to the producers. These aims are to be achieved by the joint operation of three
measures:--(a) A controlled price system, the main elements of which are a single, uniform guide ,price and provisions for interveu~tiou buying.
(h) Protection from imports through the use of duties and levies.
(c) Subsidisation of exports to allow sales of surplus produce on the world market.
The Community has in the last few years had great difficulty in pursuing its aim of increased beef production due to the large and unsalea.ble sur-pluses of dairy produce which have built up. This build up is a consequence of high milk prices and the close link between dairy and beef farming in
A STUDY OF THE IRISH CATTLE AND BEEF INDUSTRIES 45
grains and animal products. At present (or indeed at any realistic price levels), dairying gives a inuch higher profit per acre than beef production. It will, therefore, be very difficult to encourage a significant proportion of farmers to Sl~itoh fi’om dairying to beef. This is especially so, given the high proportion of small farms in the Community whose operators are dependent on a very high income per acre in order to enjoy a reasonable standard of living. What this ,means is th‘at in the Community the "beef" industry will continue .to be dependent on dairying as the ma.in supplier of i.ts most essen.tial inpnt namely cah’es, so rhat any significant increase in beef pro-duction will inevitably require th‘at the size of the dairy herd be increased. Also high prices for ga’:lin relative to animal products encourages grain production on large .holdings which would be very suitable for beef cow herds.
It is not immediately clear whether or not EEC ca0tle numbers will change ~over ~he .next decade. Much depends on shifits in future policy. At the
moment the Council of Ministers of the EEC are considering a whole range of proposals which would provide grants for beef production in herds not selling milk. These granls or production incentives are aimed at achieving snbstantial growth in the ou,tput of beef without a corresponding growth in milk prodnction.
However, the policies devised must ’be pu, t into effect by the individual member states and it is likely that some will adopt these policies to a greater extent than others.* Thus the future level of "beef and veal" production in the EEC countries may be strongly influenced by distinctly national con-siderations. XAIe discuss below, therefore, the likely trends in each country, taking account of the differences which exist between the member states and of the different consumer patterns which occur within eacb country. Before going on to the country discussion however, it should be said that two distinct beef markets are beginning to elnerge w~thin the Commnnity as a whole, one for high grade heel destined for direct consurnption ,and one for lower grade beef for manufacturing pu,rposes. RequiremelatS for the former are increasingly being met from European sources whilst the latter come largely from South Alnerica. Al,thongh statiseical evidence is scanty, it appears that in recent years consumption of beef in processed forln may have grown ntore rapidly than .prime beef in most European countries. This trend seems likely to continue ahhough, with the exception of Germany, the proportion of processed beef in total beef consumption is less than twenty five per cent.
THE ECONOMIC AND SOCIAL RESEARCH INSTITUTE
FRANCE*
The ,pattern of French trade in cattle and ’beef products is complex due to the existence side by side of import and export .trades in a wide variety of products. In 197o France exported t t3,ooo tonnes of beef and veal, .the bulk of which went to West Germany (see Tables 2.3 and 2.5), while in the same year s~he inrported 7,,ooo ,tonnes some of which came from West Germany. Though France exports beef fore-quarters to Germany for the manufacturing trade, and imports German hind-quarters for her own prime beef ,trade, the French processing industry utilises about *oo,ooo tonnes of beef per annum. She also exports and imports large numbers of live cattle and calves.
Cattle Supplies
Cattle numbers in France rose steadily from the end of the Second World War to the early 196os. Since that time there has been only a very slight increase in total numbers which in December 197t, stood at 2 ~,8o3,ooo head. The cow population in France over the past ~o years has been almost static. Numbers increased slowly between 1965 and ~968 to 11,203,OOO head of which 8.5 million were dairy cows and 2.7 million were ,beef cows. Ho~,ever, since 1968, total cow numbers have remained steady at a fraction above
l~ million. Thus the EEC cow slaughter policy, whilst it may have been the cause of ,~he slowdown in the rate of increase in numbers, did not actually cause a decrease i.n the number of cows. There has been a tendency, which became marked in 197o, for the number of dairy cows to decline, and for these to be replaced by beef cows.
Imports
Imports of live caetle into France increased from around ~o,ooo head in the mid z96os to 53,ooo head in ~969 but there has been a decline of ~o,ooo a year since .then, with imports in J971 sta,nding at 33,ooo head valued at just £3 million. Calves make up around two-thirds of this trade and i,t has been variations in this category which have been responsible for the recent fluctua,tions. The ca.h,es are obtained mainly from Belgium and Holland. The other cattle, which are imported in small numbers and mainly for breeding, come .from a wide v~/riety of countries. Imports of "fresh and chilled" beef i,ncreased between ~966 and 1971 from ~7,ooo .tonnes to 43,9oo tonnes. Hindquarters imported from West Germany constitute .the bulk of this trade. There has been a more rapid rate of increase in frozen
A STUDY OF THE IRISH CATTLE AND BEEF INDUSTRIES 47
beef imports over the period. These rose from 9,200 tonnes in 1966 to 24,500 tonnes in 1971. As might be expected, most of this frozen beef originates in
South America. The total value of beef and veal inlportsin 1971 was about
£41 million.
Disposal
Disposal of cattle and calves is both by home slaughter and by live ex,ports. The following table shows .the num,bers killed iu France, for each category of stock, in recent years.
T.~mt.r: 3.2: Slaughterings of eat~le in Frar~e, J966-I97I
Adult Males Adult . Calves
]"ear Calves Total as per cent
Entire Castrate Females ’ of total kill
’ooo head p~ cent
I966 4,343 t99 I,O53 2,299 7,8o4 55
1967 4,454 214 1,159 2,38o 8,~o7 54
I968 4,476 257 I,o59 2,583 8,375 54
x969 ~J56 263 907 ~,582 7,9°8 53
197o 4,oo4 29o 869 2,7o6 7,869 5t
I97I 3,9rI 348 925 2,739 7,923 49
Note: "adult". in this context means over one year and "adult females" includes both cows and
prime heifers. "Calves" are all animals under one year.
Source : Ministfire de l’Agriculture.
This table shows declines i.n the numbers o[ calves slaughtered for veal and of steers slaughtered for beef, and inca’eases in the numbers o[ adult bulls and females slaughtered.
Exports
The number of live cattle exported from France each year is increasing rapidly. The bulk o[ these cattle, more than hall of which are calves, are exported to Italy. In ~97~ ex.ports of calves amounted to 469,ooo head and of other cattle to 375,ooo head. Together these trades were worth about £8o million.
48 THE ECONOMIC AND SOCIAL RESEARCH INSTITUTE
Home Consumption
The per capita consumption of beef and veal has reached a plateau of about 66 lb. in recent years and opinions differ as to future trends. The FAO, which assumes that relative prices between meats in 198o will be the same as those of today, projects that per capnt constmaption will increase. OECD, on the other hand, assumes that relative prices will continue to shift according to recent trends and project .that .the increase in consumption will be only slight. The FAO figtn’e is 77 lb. per person by 198o, whereas those of the OECD are 7t lb. by 1975 and 74 lb. by ~985. Most of the increase is expected to be in manufacturing beef, wi.th prinie beef remaining fairly constant and consumption of veal declining.
Projected Overall Demand
Using an average of the FAO and OECD projections already mentioned, total consumption of beef alone in ~98o should be ~,48o,ooo tonnes com-pared with 1,128,OOO tOnnes in 1969. Consumption of bovine mea,t should
Inove fronl 1,523,ooo tonnes to around ~,81o,ooo tonnes over the eleven year period, or an increase of 19 per cent. The crucial question arises as to ~,here .this meat is going .to come from. The seven year peri.od up to ~98o is sufficiently long for changes to occur in the su,pply posi,tion, bu.t in view of the absence of e.~pansion over the past decade it is doubtful if all the increased requirements ~,ill come from home production which was only 1,519,ooo tonnes in i97o. Therefore, unless there is a drastic change in policy, France can be expected to ’become a net im,povter of beef by ~98o. The extent to which I.reland will break into ehe French trade will depend a good deal on our fu.ture breeding policy. In time of scarcity the trade is prepared to take ~’hatever 5s available, and we are sending some beef there at present, though at prices lower than those for the best quality French beef. The French trade however prefers very lean beef, and in normal times will purchase such beef in preference to our fatter type cattle. ,Hence, imless we are prepared .to produce some of the leaner breeds we cannot expect to break permanently into the French market and even when we occasionally do so with traditional breeds, prices received will be relatively low.
BELGIUM
A ~TUDY OF THE IRISH CATTLE AND BEEF iNDUSTRiES ~.~
all meat imported into Belgium goes for manufacturing purposes. The prime trade which is for very lean beef is supplied mainly by home bred cattle or by suitable live int~por.ts coming mainly fi’om France, Netherlands, West
Germany and recently from UK and Ireland.
Cattle Supplies
Cattle numbers in Belgium rose slowly be~veen 1966 and ~97o to almost 2.9 million head. However, over the last two years they have tended to decline. Numbers of female breeding stock were also at a maximum of about l.J million in 197o, and they also have declined since then. Imports of live ca, ttle into ]3elgium are greater than exports. However, this gap is narrowing and in 1971 net imports were only 7,000 head compared with 43,000 the previous year. Total slaughtcrings over the past 5 years were fairly steady at something over i million each year, of which about three fourths were
mature cattle and one fourth calves.
Consumption
No statistics are available for the current consumption of veal. However, assu,ming that the level of consumption is close to the level of production,
it is in the region of 5.5 lb. per head. Thus per caput consumption of all bovine meat was around 57 lb. per head in 1969. The FAO projects that this figure will rise to 71 lb. per ’head by 198o. The OECD on the other hand is not nearly so optimistic and projects a figtn’e of only around 60 l’b. due to the cousidera.ble rise assumed in the price of bovine meats relative to other meats.
The type of beef normally required by the Belgian market is very similar to that of F~-ance and ’the same commen.ts apply to the two countries regard-ing trade with Ireland, The Belgian trade is ~tther small and, while it should not be overlooked, it can largely be considered as an extension of the French market.
ITALY*
Italy is an expanding industrial country wi.th a population of just under
53 million people. The ~’ea’ter part of ,the wea’l~h however, is located in .the Northern and Central areas while the Southern region is underdeveloped both agriculturally and industrially. Despite :this serious regional imbalance the economy as a whole has realised more rapid annual growt,h rates than those of other EEC members. Income ’per ca.pita is increasing at an average
50 THE ECONOMIC AND SOCIAL RESEARCII INSTITUTE
T,~LE 3.3: Trade in live cattle, beef and veal between Belgium and other countries, i969-i971
IMPORTS: Liue Cattle From: France Hungary Netherlands UK W. Germany Other Gountrie$
Beef and V*at From : Argentina Brazll France Netherlands Sweden Uruguay Other Countries Total
1969 ~ ~97t
(Nt~bers)
7~,3oo 7z,474 83,2~5 8,7o8 2,8o4
9o,385 I z6’4x8 I 5’609 t,794’ 15,o99 9,45l 33,366 16,162 2,9 9 ~ g,4~2 t9,392 to, l~2
t9o,995 ~ t4t,349 ] t11,396
(Tons)
,225 ,x,715 7,3~4 ,o89 77 2,494 ,o35 s78 I 1,398 ,93~ ] 1,888 ) 1,873 96 t I 6oo
--t4tI
534 x,2 o
EXPORTS: Live Cattle To: France W. Germany Italy Netherlands Other Countries Total ~oefand Veal France W. Germany Italy Netherlands Other Countries Total
~7,158 [ ~2,258 15,873 i,295 ~,9 7 4Jt2 74,979 58,o~4
6,673 t,924 7,75~ t 7,3o9 1%599 26,’4t o
97,782
(Tons)
994 488
6~ 3,99° 6,447 7;
-- 530
7,o56 5,73~ Io,499 3,540 3,9_~ 3,97t ~5,580 17, t4z ~3,~65
Source: Commonwealth Secretariat Bulletin April, 1972.
annual rate of 5.5 per cent, and Northern Italy is now one of the most highly developed areas within the EEC.
Livestock production is by far the most important sector of Italian agriculture, accounting for 40 per cent of the value of argricultural output in ~97o, (The statistics are, however, m,rher suspeot and must be taken with caution.) Despite this comparatively high contribution, cabtle numbers do n