COMPUTATIONAL BIOLOGY AND GENE INTERPRETATION OF
PSORIATIC ARTHRITIS THROUGH IN SILICO ANALYSIS
Krishna Kumar Das1, Sudeepa Rout2, Santosh Kumar Behera2* and
Yagyan Prasad Nath Sharma3
1,2,3
Department of Bioinformatics, C.P.G.S., O.U.A.T., Bhubaneswar.
2
ICMR-Regional Medical Research Centre, Bhubaneswar-751003.
ABSTRACT
Human autoimmune diseases (AD) occur frequently (affecting in
aggregate more than 5% of the population worldwide), and impose a
significant burden of morbidity and mortality on the human population.
Psoriasis being one of those typeis a chronic condition characterized by
sharply demarcated skin lesions and increased risk of arthritis and
cardiovascular disease. Lesion development is associated with
excessive keratinocyte (KC) proliferation, altered KC differentiation,
and an inflammatory infiltrate that includes innate and adaptive
immune cells (e.g., neutrophils and T-cells).Psoriatic arthritis is a form
of arthritis (joint inflammation) that can occur in people who have the skin disease psoriasis.
Psoriasis is a common condition characterized by scaly red and white skin patches. Psoriatic
arthritis can affect any joint in the body, including the spine. In this study an attempt was
made to study the find the key hub gene associated with Psoriasis Arthritis and how these
genes interact among themselves along with their important gene ontology. Further step was
taken to generate 3D structures of the gene products whose structure is not available in
Protein Data bank and study the interaction of these genes along with different drug molecule
for the treatment of the same. The Drug association analysis of Web Gestalt has reported 17
drugs interacted with 33 genes or its corresponding proteins out of which docking was
performed for 17 drugs and 33 potential targets as they are found to be key regulators in PsA
disease. The molecular docking studies have reported the drug-target interactions of
teicoplanin was -12.12 Kcal/mol, cyclosparine was -13.86 Kcal/Mol, hyaluronan was -9.69
Kcal/Mol, sulfasalazine Interaction of dinoprostone with VEGFA has the highest docking
scores of -13.86 Kcal/mol with energy minimization. Interaction of cyclosparine with IL10
Volume 8, Issue 2, 1232-1252. Research Article ISSN 2277– 7105
Article Received on 10 December 2018,
Revised on 31 Dec. 2018, Accepted on 21 Jan. 2018
DOI: 10.20959/wjpr20192-14161
*Corresponding Author
Santosh Kumar Behera
Department of
Bioinformatics, C.P.G.S.,
has the lowest docking scores of -2.85 Kcal/mol with energy minimization. From this report
it is clear that PsA differs from person to person based on their genes and genetic interactions
and expressions which recommend the clinicians to go for personalized medicine rather that
generalized medicine for the patients with PsA. These gene product and drug may act as
potential future target for the treatment of Psoriasis arthritis.
KEYWORDS: Autoimmune diseases; keratinocyte; Psoriasis arthritis; Protein Data bank.
INTRODUCTION
Psoriatic arthritis (PsA) is an inflammatory arthropathy, which is associated with psoriasis in
approximately 25% of patients. It is characterized by stiffness, pain, swelling, and tenderness
of the joints as well as the surrounding ligaments and tendons.[1,2] It affects men and women
equally and typically presents at the age of 30 to 50 years.[2] Psoriasis is a relapsing
inflammatory skin disease that occurs in 1–3% of the world’s population. In Poland, the
prevalence of psoriasis is estimated at 2% of the general population.[3] The authors defined
PsA as an inflammatory arthritis associated with psoriasis and negative for serum rheumatoid
factor.” There are two types of psoriasis: type I with early onset (before 40 years of age) and
type II with late onset of symptoms (after the age of 40). Type I is diagnosed in
approximately 85% of patients with a peak incidence at the age of 18–22 years.[4] The course
of the disease is more severe and often complicated by arthritis. Type I often (85%) coexists
with HLA-Cw * 0602 alleles and PSORS1 locus (35–50%).[5] The contribution of genetic
factors is clearly apparent in this type of disease. Type II is a milder form of PsA with a peak
incidence at the age of 57–60 years. The correlation with genetic factors is not that evident as
in type I. HLA-Cw * 0602 alleles are found only in 15% of cases. Similar results were
reported by other authors.[6,7] Although different loci have been identified by genome-wide
scans the cause of psoriasis is still unknown. A functional contribution of T cells in the
aetiology of psoriasis is strongly inferred from the presence of T cells in lesioned skin and the
beneficial response to immunosuppressive drugs. However, recent results indicate that T cells
are perhaps not essential in inducing the chemokine/ cytokine profile seen in psoriasis
(Gudjonsson and Elder, 2006). This motivates for searching functional alterations of
keratinocytes. Jun proteins (c-Jun, JunB and JunD), together with the Fos, ATF and CREB
proteins are main components of theactivator protein 1 (AP-1) transcription factor. The
balance of Jun proteins determines whether cells progress through the cell cycle. In psoriasis,
of the epidermis. Using an epidermis-specific double knock-out mouse model, it was shown
that the epidermis-specific downregulation of JunB induces cytokine/chemokines, which are
known to recruit inflammatory cells, thereby contributing to the establishment of the clinical
and molecular features observed in psoriasis and psoriatic arthritis (Zenz et al. 2005).
Nevertheless, as the mRNA level of JunB is reported to be unchanged in psoriasis, the cause
of the expression change of JunB and c-Jun proteins remains unclear.[8]
PsA is a highly heritable, polygenic disease. The recurrence risk (l) ratio, defined as the ratio
of a disease manifestation in family members to the affected individual compared with the
prevalence in the general population, is significantly higher in PsA than RA and psoriasis.
[9-11]
This high ratio underscores the strong familial component of this disease; the genetic risk
factors are discussed in the article in this issue. In contrast to RA, which shows an association
with specific MHC class II alleles, psoriasis and PsA are associated with MHC class I alleles.
In particular, HLA-C*06 (previously called HLA-Cu06) is the genetic risk factor most
strongly linked to psoriasis.[12] Interestingly, this MHC I allele does not track with joint and
nail disease.[13] HLA-B*08, B*27, B*38 are found in increased frequency in PsA, and a
recent study showed that the presence of glutamine in the HLA-B27 gene at amino acid
position 45 significantly increased the risk for PsA, but not psoriasis.[14] Immunochip
genotype array case-controlled analysisalso identified HLA-C*0602, amino acid position 67
of HLA-B, and HLA-A*0201 as independently associated with PsA in a study that included
nearly 2000 PsA patients and 9000 controls.[15] The presence of HLA-B*27 correlates with
the severity of axial involvement on MRI studies[16] as well as a shortened interval between
the development of skin and joint disease.[17]
Evidence for a strong genetic contribution in PsA comes from family studies (Moll et al.
1973; Gladman et al. 2003). Just as in psoriasis, association in PsA has also been found with
the HLA loci on chromosome 6. The strongest associated allele in psoriasis, Cw6, is reported
to be more strongly associated with psoriasis than with PsA. The situation in PsA is
considerably more complex and genetic studies have shown associations with several HLA
antigens including HLA-B13, B17, -b27, B38, B39, Cw6, DR4, DR7 and DQ3 (Murray et al.
1980; Gladman et al. 1986; McHugh et al. 1987; Salvarani et al. 1989; Torre Alonso et al.
1991). Association with PsA has also been found with the MICA-A9 triplet repeat
polymorphism and with polymorphisms in the TNF-α region (Gonzalez et al. 2001; Hohler et
PsA (Karason et al. 2003). This study was performed on 39 Icelandic families using 1000
microsatellite markers. A LOD score of 2.17 was reported on chromosome 16q and when
conditioning the analysis on paternal transmission, the LOD score increased to 4.19. Addition
of markers to this region further increased the LOD score to 5.69 also when analysis was
conditioned on paternal inheritance (Karason et al. 2005). The susceptibility gene for
Chrohns disease, CARD15(Hugot et al. 2001; Ogura et al. 2001), overlaps with this region.
Association with this gene has also been reported in a study on PsA patients (Rahman et al.
2003), although other studies have failed to confirm this association (Giardina et al. 2004;
Lascorz et al. 2005).[18]
MATERIALS AND METHODS
Mining of genes associated with PSA from GWAS Catalog, MALACARD, Diseases.
Jensenlab
The National Human Genome Research Institute (NHGRI) Catalog of Published
Genome-Wide Association Studies (GWAS) Catalog which provides a publicly available manually
curated collection of published GWAS assaying at least 1,00,000 single nucleotide
polymorphisms (SNPs) and all SNP-trait associations with P <1X10⁻⁵, was used to mine the
genes pertaining to RH. Disease search for “Psoriaticarthritis” with a p-value threshold of
p<10-5 was performed to retrieve GWAS studies on PSA from GWAS Catalog
(http://www.genome.gov/gwastudies/ currently https://www.ebi.ac.uk/gwas/).[19]
Functional annotation and GO association of PSA genes
The functional annotation genes was performed through Gene Ontology (GO) analysis which
describes the functions along the three categories viz., molecular functions (MF), biological
processes (BP) and the cellular components (CC). The Database for Annotation,
Visualization and Integrated Discovery (DAVID) Bioinformatics Resources 6.7
(http://david.abcc.ncifcrf.gov/) was used for GO term annotation (i.e., the common
vocabulary for the functional description of genes and gene products) annotation. Finally to
find the statistically significant GO terms of the genes, GO term enrichment analysis was
performed. The DAVID parameters were filtered to reduce the false positives and the output
was taken into account after applying multiple testing correction (p-values <0.05), fold
change and False Discovery Rate (FDR). Genes from significantly enriched biological
Generation of gene network and its interactions
Gene networks present a graphical view at the level of gene activities and genetic functions
and help us to understand complex interactions in a meaningful manner. The STRING
database (http://string-db.org/) aims to provide such a global perspective for as many
organisms as feasible. Known and predicted associations are scored and integrated, resulting
in comprehensive protein networks covering >1100 organisms.[22-23]
Gene-disease association study
Web Gestalt (WEB-based Gene SeTAnaLysis Toolkit) , one of the first software applications
that integrate functional enrichment analysis and information visualization for the
management, information retrieval, organization, visualization and statistical analysis of large
sets of genes. Web Gestalt (http://bioinfo.vanderbilt.edu/webgestalt/) was used for further
functional categorisation of 235 BP genes including gene–phenotype association, gene–
disease association and Drug association analysis. Further interactive phenotype ontology
associated with PSA genes was elucidated. Organism Homo sapiens was selected against
select organism of interest column, hsapiens_gene symbol was selected at Select gene ID
type, and outcome of DAVID functional analysis BP gene list consisting of 235 genes was
uploaded in the Upload gene list column. The following entries such as Statistical
Method/test: hypergeometric, Multiple Test Adjustment: BH, Significance Level: Top 10 and
.05, Minimum Number of Genes for a Category: 2 was selected.[24-25]
UniProt
The Universal Protein Resource (UniProt) is a comprehensive resource for protein sequence
and annotation data. The corresponding protein sequences encoded by these genes were
retrieved from UniProtKB database.[26-28]
Retrieval of Drugs and proteins
The Structure Data Format (SDF) 3D structure of the reported drugs were retrieved from the
NCBI PubChem.[29-30] database (http://www.ncbi.nlm.nih.gov/ pccompound/) along with its
PubChem ID, Molecular weight and Molecular formula. The compounds were converted into
pdb format structure using the PyMol[31] (academic version) tool, Discovery Studio v4.1
visulizer tools[32] and online SMILES translator web server
The structures of the corresponding proteins of reported genes were retrieved from PDB
Protein Data Bank (PDB).[33] The unknown structures were predicted using various tools like
Modeller 9.15 tool,[34] LOMETS[35] (A local meta-threading-server for protein structure
prediction) and RaptorX[36-37] web servers due to unavailability at PDB Protein Data Bank
(PDB).
Prediction of binding site
Structural and active site studies prediction of the proteins were done by using CASTP [38]
(Computed Atlas of Surface Topography of Proteins) at http://cast.engr.uic.edu and
GHECOM 1.0: Grid-based HECOMi finder.[39-40]
Docking approach
AutoDock 4.2 (autodock.scripps.edu/) was used for docking studies which is widely
distributed public domain molecular docking software. The docking analysis was carried out
for the reported drugs (can be said as ligands) with their corresponding targets (proteins)
using AutoDock4.2 tool. The interactions of ligand and proteins were studied using LigPlot,
Discovery Studio Visulizer and PyMol. The various bonding interactions of ligand and
proteins were explored using the above tools.[41-43]
RESULTS AND DISCUSSION
The GWAS studies reported 3 studies of Psoriatic arthritis with a total of 239 unique genes
mapped to discrete genomic locations of human genome. The list of 239 unique genes is
represented at Table.1.
Table 1: The GWAS studies with 3 studies of rheumatoid arthritis with a total of 239
unique genes.
IL12B SPRTN UBE2D1 C7orf49
TRAF3IP2 SERPINA11 MCAM SST
REL CD68 SERPINA1 MMP2
HLA-C IL1F10 CSF1 NCAM1
COG6 ARPC4 CD163 JAK3
LTA ITGAL RPTOR SLC22A5
NOD2 ADAD1 CD55 MMP9
CELIAC2 LCE3A CD2 NDUFA6
TNF SLC12A8 MAP4K5 STIP1
MICA C3 IL1RL2 PHF11
HLA-B C21orf62 STARD13 IGJ TNFRSF1B HLA-G BGLAP S100A7
TNIP1 IL22 DHODH CXCR3
IL13 NFKBIA MSLNL IL33
HLA-DRB1 RAB8A NAT9 AGK
IL23R TNFRSF10A ACAN TRAF5
TNFRSF1A USP8 CCL20 PTTG1
COMP VEGFA SDC1 MAP3K3
MMP3 CRTAC1 ICAM1 KLK6
TNFSF11 PLCL2 ITGAM SDC3
PTPN22 SFTPA1 FOXP3 HIST1H1A
CARD14 MEG8 KLK8 MNDA
S100A12 RNF39 HLA-S POMC
IL1B PDE4B MTX3 KLRB1
SELE MIA LRRC25 ATG16L1
CD58 EBI3 MAP4K2 CCL4
TNFRSF11B SFTPA2 KIR2DL1 ONECUT3
IL1A PPIA IFNA1 NOD1
ANGPT2 CTLA4 MATN3 TNFSF12
MMP1 IL34 STAT3 SIGIRR
IL15 DYNLT1 VCAM1 UST
IL17A IFNG ELOVL6 GJB2
LCE3C ZNF395 GPC4 KIAA1109
LCE3B SPPL2A TARS CD80
PIPOX LHFP CHRNA6 SNRNP40
MRAP S100A9 RNASE7 RBM38
PHB2 AFF3 KLK1 CCL2
IL36RN SAA1 SLC22A4 PSAT1
FBXL19 SERPINB8 JAK1 MAP4K1
IL17RA RAN HLA-DRB5 IL17F
AGBL2 TLR4 FN1 IL10
ERAP1 ASPA PRL KRT78
HLA-A RARRES2 FLG CCHCR1
IL1RN IFIH1 NUP62 CCR6
CD4 IL25 VSIG4 FGF1
TNFAIP3 LYZ CD8B CSF1R
ZNF816 PRTN3 HLA-DMA TLR2
IL6 IL12RB1 CHRNB3 TRAF6
RNF114 FBN3 KYNU IL37
PDE4A IL17RC JAK2 NRAP
CD8A PSME4 IL1R1 HCP5
CD40LG TYK2 RORA SLC9A3R1
CD79A IL4 HP IL28RA
LCE3D CXCL9 HPR IL2
NOD2 CRISP2 CCL21 DKK1
AGBL3 MT4 IL23A IARS
IL8 IL36B MEFV TIMP1
PROS1 CHI3L1 OAS2 ITIH1
The DAVID bioinformatics functional enrichment analysis report of 235 genes is depicted.
A total of 235 genes obtained from significantly enriched biological processes are termed as
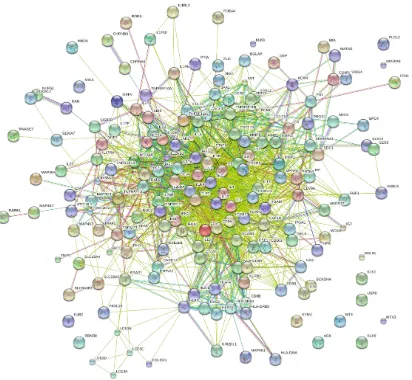
key genes and were used for network construction of PsA were analyzed through STRING
database. The result of the string is represented in Fig.1. The PsA network of STRING
database reported the genes namely IL8, TNF, VEGFA, TNFRSF11B, IL8, IL6, TNF, IL10,
TNF, TNF, IL6, TLR4, TNF, IL6, IL10, VEGFA, IL1B, TNFSF11, IL10, CD55, TNF,
TNFRSF11B, IL8, IL6, IL1B, TNF, IL4 and IL8 at the core region of the network. These
genes may be said to play a key in PsA as well as can be differentially expressed in PsA
[image:8.595.98.510.289.669.2]disease.
Fig. 1: Network construction of PsA analyzed through STRING database.
The Drug association analysis of WebGestalt has reported 17 drugs interacted with 38genes
corresponding genes/proteins were cross checked by literature survey, substantially presented
in Table.2.
Table 2: PSA Drugs and their corresponding target genes/proteins from WebGestalt at
significance level .05, Significance test Hypergeometric, MTC: BH.
S.
no. Drug name
PubChem CID
Molecular formula
Molecular
weight Target
1 immune
globulin 119 C4H9NO2
103.11976 g/mol FOXP3 TNF IFNG ITGAL CD4 CD55 CTLA4 CD40LG IL4 CD80 PTPN22 IL10 ICAM1 CD2 TNFRSF1B HLADRB1 TLR2 MICA IL8 TNFRSF1A TLR4
2 anakinra 90470007 C20H23N5O7S2
509.55592 g/mol TNF IL4 IL10 IL1B IL1R1 IL6 IL8 TNFRSF1A
3 dinoprostone 5280360 C20H32O5 352.46508
g/mol TNF IL10 VEGFA IL1B TNFSF11 IL6 IL8 TLR4
4 cyclosporine 5284373 C62H111N11O12
1202.61124 g/mol
CD55 IL10
5 Nitric oxide 145068 NO 30.0061 g/mol
TNF IFNG VEGFA IL1B NFKBIA VCAM1
6 stavudine 18283 C10H12N2O4
224.21328 g/mol
TNF CCHCR1 HLADRB1
7 pentoxifylline 4740 C13H18N4O3
278.30702 g/mol
TNF IL6 IL8
8 teicoplanin 16152170 C72H68Cl2N8O28
1564.25312 g/mol
IL6 TLR4
9 tiotropium 5487427 C19H22NO4S2+
392.51228 g/mol
IL8 SLC22A4
calcitriol 5280453 C27H44O3
416.63646 g/mol
BGLAP IL1B
TNFRSF11B
11 nevirapine 4463 C15H14N4O
266.29786 g/mol
CCHCR1 HLADRB1
12 sulfasalazine 5359476 C18H14N4O5S
398.39256 g/mol
TNF IL8
13 thalidomide 5426 C13H10N2O4 258.2295 g/mol
TNF VEGFA
14 prednisone 5865 C21H26O5 358.42814
g/mol
TNF IL10
15 indomethacin 3715 C19H16ClNO4 357.78764
g/mol
CD2 IL6
16 testosterone 6013 C19H28O2 288.42442
g/mol
BGLAP TNFRSF11B
17 hyaluronan 24759 C28H44N2O23
776.64856 g/mol
TLR2 IL8 TLR4
The Structure Data Format (SDF) 3D structure of the reported drugs were retrieved from the
NCBI PubChem database (http://www.ncbi.nlm.nih.gov/ pccompound/) along with its
PubChem ID, Molecular weight and Molecular formula. The compounds were converted into
pdb format structure using the PyMol (academic version) tool, Discovery Studio v4.1
visulizer tools and online SMILES translator web server (https://cactus.nci.nih.gov/translate/)
as per requirement. The detail about the drugs, DRUG Name, PubChem CID, Molecular
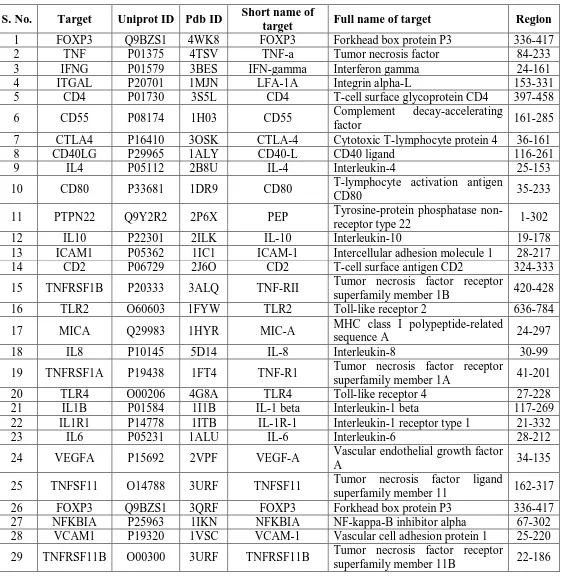
The structures of the corresponding proteins of reported 33 genes that are found to be the key
factor were retrieved from PDB Protein Data Bank (PDB). The details about the structure of
[image:11.595.20.583.164.748.2]these 29 genes are reported at Table.3.
Table 3: Potential targets of PSA disease with their PDB ID and region of interest.
S. No. Target Uniprot ID Pdb ID Short name of
target Full name of target Region
1 FOXP3 Q9BZS1 4WK8 FOXP3 Forkhead box protein P3 336-417
2 TNF P01375 4TSV TNF-a Tumor necrosis factor 84-233
3 IFNG P01579 3BES IFN-gamma Interferon gamma 24-161
4 ITGAL P20701 1MJN LFA-1A Integrin alpha-L 153-331
5 CD4 P01730 3S5L CD4 T-cell surface glycoprotein CD4 397-458
6 CD55 P08174 1H03 CD55 Complement decay-accelerating
factor 161-285
7 CTLA4 P16410 3OSK CTLA-4 Cytotoxic T-lymphocyte protein 4 36-161
8 CD40LG P29965 1ALY CD40-L CD40 ligand 116-261
9 IL4 P05112 2B8U IL-4 Interleukin-4 25-153
10 CD80 P33681 1DR9 CD80 T-lymphocyte activation antigen
CD80 35-233
11 PTPN22 Q9Y2R2 2P6X PEP Tyrosine-protein phosphatase
non-receptor type 22 1-302
12 IL10 P22301 2ILK IL-10 Interleukin-10 19-178
13 ICAM1 P05362 1IC1 ICAM-1 Intercellular adhesion molecule 1 28-217
14 CD2 P06729 2J6O CD2 T-cell surface antigen CD2 324-333
15 TNFRSF1B P20333 3ALQ TNF-RII Tumor necrosis factor receptor
superfamily member 1B 420-428
16 TLR2 O60603 1FYW TLR2 Toll-like receptor 2 636-784
17 MICA Q29983 1HYR MIC-A MHC class I polypeptide-related
sequence A 24-297
18 IL8 P10145 5D14 IL-8 Interleukin-8 30-99
19 TNFRSF1A P19438 1FT4 TNF-R1 Tumor necrosis factor receptor
superfamily member 1A 41-201
20 TLR4 O00206 4G8A TLR4 Toll-like receptor 4 27-228
21 IL1B P01584 1I1B IL-1 beta Interleukin-1 beta 117-269
22 IL1R1 P14778 1ITB IL-1R-1 Interleukin-1 receptor type 1 21-332
23 IL6 P05231 1ALU IL-6 Interleukin-6 28-212
24 VEGFA P15692 2VPF VEGF-A Vascular endothelial growth factor
A 34-135
25 TNFSF11 O14788 3URF TNFSF11 Tumor necrosis factor ligand
superfamily member 11 162-317
26 FOXP3 Q9BZS1 3QRF FOXP3 Forkhead box protein P3 336-417
27 NFKBIA P25963 1IKN NFKBIA NF-kappa-B inhibitor alpha 67-302 28 VCAM1 P19320 1VSC VCAM-1 Vascular cell adhesion protein 1 25-220
29 TNFRSF11B O00300 3URF TNFRSF11B Tumor necrosis factor receptor
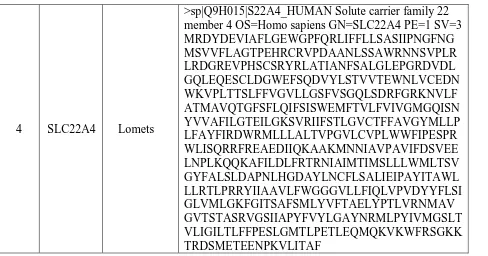
The amino acid sequences of corresponding proteins encoded by the reported 4 genes against
PsAdrugs were retrieved from UniProtKB database. The 3D structure of all the 4proteins,
namelyBGLAP, CCHCR1, HLADRB1 and SLC22A4 was predicted by LOMETS (Local
Meta-Threading-Server) and threading tool due to unavailability of information at Protein
data Bank. The detail of the structure predictions about each protein is reported at Table.4.
Table 4: Targets/Proteins and their protein sequences for structure prediction.
S. No Target
Tool For Structure Prediction
Protein Sequence
1 BGLAP Lomets
>sp|P02818|OSTCN_HUMAN Osteocalcin OS=Homo sapiens GN=BGLAP PE=1 SV=2
MRALTLLALLALAALCIAGQAGAKPSGAESSKGA AFVSKQEGSEVVKRPRRYLYQWLGAPVPYPDPLEP RREVCELNPDCDELADHIGFQEAYRRFYGPV
2 CCHCR1 Lomets
>sp|Q8TD31|CCHCR_HUMAN Coiled-coil alpha-helical rod protein 1 OS=Homo sapiens GN=CCHCR1 PE=1 SV=2
MFPPSGSTGLIPPSHFQARPLSTLPRMAPTWLSDIPL VQPPGHQDVSERRLDTQRPQVTMWERDVSSDRQE PGRRGRSWGLEGSQALSQQAEVIVRQLQELRRLEE EVRLLRETSLQQKMRLEAQAMELEALARAEKAGR AEAEGLRAALAGAEVVRKNLEEGSQRELEEVQRL HQEQLSSLTQAHEEALSSLTSKAEGLEKSLSSLETR RAGEAKELAEAQREAELLRKQLSKTQEDLEAQVT LVENLRKYVGEQVPSEVHSQTWELERQKLLETMQ HLQEDRDSLHATAELLQVRVQSLTHILALQEEELT RKVQPSDSLEPEFTRKCQSLLNRWREKVFALMVQL KAQELEHSDSVKQLKGQVASLQEKVTSQSQEQAIL QRSLQDKAAEVEVERMGAKGLQLELSRAQEARRR WQQQTASAEEQLRLVVNAVSSSQIWLETTMAKVE GAAAQLPSLNNRLSYAVRKVHTIRGLIARKLALAQ LRQESCPLPPPVTDVSLELQQLREERNRLDAELQLS ARLIQQEVGRAREQGEAERQQLSKVAQQLEQELQ QTQESLASLGLQLEVARQGQQESTEEAASLRQELT QQQELYGQALQEKVAEVETRLREQLSDTERRLNE ARREHAKAVVSLRQIQRRAAQEKERSQELRRLQEE ARKEEGQRLARRLQELERDKNLMLATLQQEGLLS RYKQQRLLTVLPSLLDKKKSVVSSPRPPECSASAPV AAAVPTRESIKGSLSVLLDDLQDLSEAISKEEAVCQ GDNLDRCSSSNPQMSS
3 Hladrb1 Lomets
>tr|Q07493|Q07493_HUMAN HLA-DR beta chain (Fragment) OS=Homo sapiens GN=HLADRB1 PE=4 SV=1
4 SLC22A4 Lomets
>sp|Q9H015|S22A4_HUMAN Solute carrier family 22 member 4 OS=Homo sapiens GN=SLC22A4 PE=1 SV=3 MRDYDEVIAFLGEWGPFQRLIFFLLSASIIPNGFNG MSVVFLAGTPEHRCRVPDAANLSSAWRNNSVPLR LRDGREVPHSCSRYRLATIANFSALGLEPGRDVDL GQLEQESCLDGWEFSQDVYLSTVVTEWNLVCEDN WKVPLTTSLFFVGVLLGSFVSGQLSDRFGRKNVLF ATMAVQTGFSFLQIFSISWEMFTVLFVIVGMGQISN YVVAFILGTEILGKSVRIIFSTLGVCTFFAVGYMLLP LFAYFIRDWRMLLLALTVPGVLCVPLWWFIPESPR WLISQRRFREAEDIIQKAAKMNNIAVPAVIFDSVEE LNPLKQQKAFILDLFRTRNIAIMTIMSLLLWMLTSV GYFALSLDAPNLHGDAYLNCFLSALIEIPAYITAWL LLRTLPRRYIIAAVLFWGGGVLLFIQLVPVDYYFLSI GLVMLGKFGITSAFSMLYVFTAELYPTLVRNMAV GVTSTASRVGSIIAPYFVYLGAYNRMLPYIVMGSLT VLIGILTLFFPESLGMTLPETLEQMQKVKWFRSGKK TRDSMETEENPKVLITAF
The Active/Binding site of the reported proteins/targets was predicted by CASTp (Computed
Atlas of Surface Topography of proteins) and GHECOM 1.0: Grid-based HECOMi (pocket)
[image:13.595.64.552.68.324.2]finder represented in Table.5.
Table 5: Active / binding site of the proteins predicted by using CASTp.
S. No. Name of the protein Binding sites
1 IL8 LYS1,GLU2,LEU3,ARG4,CYS5,GLN6,ARG24,ILE26,HIS
31,CYS32,ASN34,GLU36
2 TNF GLY66,GLY68,CYS69,PRO70,THR72,HIS73,VAL74,PRO
100,CYS101,TRP114,TYR141
3 VEGFA TYR21,SER24,TYR25,CYS60,CYS61,ASN62
4 TNFRSF11B PHE129,SER130,ASN131,GLU132,ALA137,PRO138,ARG 140
5 IL6 LEU33,ILE36,SER37,ARG40,THR43,CYS44,CYS50,GLU
51,HIS164,LEU167,ARG168,LYS171
6 IL10
LEU23,LEU26,ARG27,PHE30,VAL33,LYS34,PHE37,GLN 38,ASP41,LEU47,LEU48,LYS49,LEU52,LEU53,PHE56,L EU65,MET68,ILE69,PHE71,TYR72,VAL76,MET77,ALA8 0,VAL91,LEU94,LEU98,LEU101,ARG102,LEU105
7 TLR4
GLU31,VAL32,VAL33,PRO34,ARG382,PHE408,GLN430, ASP453,SER455,HIS456,LYS477,ALA479,PHE500,ASP50 2,SER504,GLN505,VAL524,LEU525,ASN526,SER528,HI S529,VAL548,LEU549,ASP550,SER552,LEU553,PHE573, ASN575,THR577,GLN578,LEU601,VAL602,GLU603,GL U605,ARG606
8 IL1B ASN7,SER43,SER45,GLY61,LEU62,LYS63,GLU64,LYS6
5,ASN66,TYR68,VAL85,PRO87,TYR90,PRO91
94
10 CD55 PRO10,ILE30,PHE32,SER46,TRP57,ASP59,LEU61
11 IL4 ILE32,PHE33,ALA35,LYS37,ASN38,THR39,GLU43,THR
44,ARG47,CYS99,PRO100,LYS102,GLU103
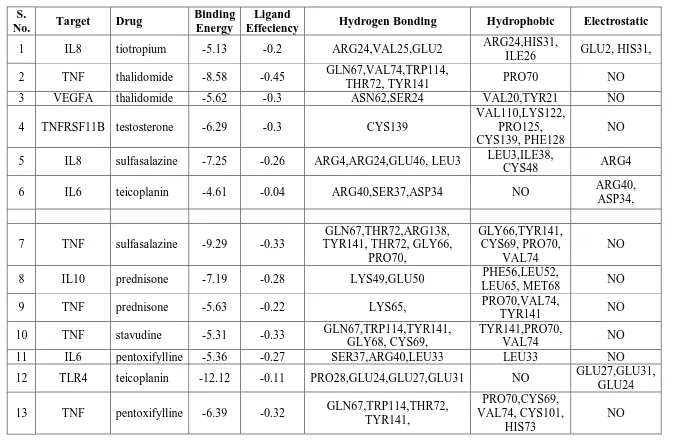
Out of reported 14 drugs interacted with11 genes or its corresponding proteins, docking was
performed for 14drugs and 11 potential targets. The selected/screened 33 targets are found to
be key regulators in PsA disease based on the existing records and network analysis.
AutoDock 4.2 (autodock.scripps.edu/) that was used for docking studies revealed docking
score with energy minimization values, Binding energy, Ligand Efficiency, Inhibition
Constant and Electrostatic energy for 14ligands/drugs-11 potential targets interactions are
represented at Table.6. The molecular docking studies have reported the drug-target
interactions of teicoplanin was -12.12 Kcal/mol, cyclosparine was -13.86 Kcal/Mol,
hyaluronan was -9.69 Kcal/Mol, sulfasalazine Interaction of dinoprostone with VEGFA has
the highest docking scores of -13.86 Kcal/mol with energy minimization. Interaction of
cyclosparine with IL10 has the lowest docking scores of -2.85Kcal/mol with energy
minimization. From this report it is clear that PsA differs from person to person based on
their genes and genetic interactions and expressions which recommend the clinicians to go
Table 6: Molecular docking analysis of 15 drugs against 18 target proteins using Auto Dock4.2 tool.
S.
No. Target Drug
Binding Energy
Ligand
Effeciency Hydrogen Bonding Hydrophobic Electrostatic
1 IL8 tiotropium -5.13 -0.2 ARG24,VAL25,GLU2 ARG24,HIS31,
ILE26 GLU2, HIS31,
2 TNF thalidomide -8.58 -0.45 GLN67,VAL74,TRP114,
THR72, TYR141 PRO70 NO
3 VEGFA thalidomide -5.62 -0.3 ASN62,SER24 VAL20,TYR21 NO
4 TNFRSF11B testosterone -6.29 -0.3 CYS139
VAL110,LYS122, PRO125, CYS139, PHE128
NO
5 IL8 sulfasalazine -7.25 -0.26 ARG4,ARG24,GLU46, LEU3 LEU3,ILE38,
CYS48 ARG4
6 IL6 teicoplanin -4.61 -0.04 ARG40,SER37,ASP34 NO ARG40,
ASP34,
7 TNF sulfasalazine -9.29 -0.33
GLN67,THR72,ARG138, TYR141, THR72, GLY66,
PRO70,
GLY66,TYR141, CYS69, PRO70,
VAL74
NO
8 IL10 prednisone -7.19 -0.28 LYS49,GLU50 PHE56,LEU52,
LEU65, MET68 NO
9 TNF prednisone -5.63 -0.22 LYS65, PRO70,VAL74,
TYR141 NO
10 TNF stavudine -5.31 -0.33 GLN67,TRP114,TYR141, GLY68, CYS69,
TYR141,PRO70,
VAL74 NO
11 IL6 pentoxifylline -5.36 -0.27 SER37,ARG40,LEU33 LEU33 NO
12 TLR4 teicoplanin -12.12 -0.11 PRO28,GLU24,GLU27,GLU31 NO GLU27,GLU31, GLU24
13 TNF pentoxifylline -6.39 -0.32 GLN67,TRP114,THR72, TYR141,
PRO70,CYS69, VAL74, CYS101,
HIS73
14 IL6 indomethacin -6.54 -0.26 ARG40 ARG30,LEU33 NO
15 IL10 dinoprostone -4.08 -0.16 TYR72 NO NO
16 VEGFA dinoprostone -2.85 -0.11 SER24,GLU64,ASN62, PHE17 NO
17 IL1B dinoprostone -6 -0.24 LYS65,LEU62 PRO91,TYR68 NO
18 TNFSF11 dinoprostone -6.12 -0.24 LYS181,GLN237,ASN295 LEU236 NO
19 IL10 cyclosparine -13.86 -0.16 NO MET77,LEU94,
TYR72 ASP41, TYR72,
20 CD55 cyclosparine 3120 36.71 ASN9,SER31, TRP57 GLU63,
ASP19,
21 TNF cyclosparine -1.61 -0.02 NO NO ARG138
22 TNFRSF11B calcitriol -5.3 -0.18 ARG140,GLU132,LYS141 ARG140,
PHE129 NO
23 IL8 hyaluronan -9.69 -0.18 ARG24,GLU2,LYS1,LEU23 NO GLU2
24 IL6 anakinra -4.98 -0.15 ARG40,ASP34 ARG40,ILE36,
LEU33 NO
25 IL1B anakinra -6.28 -0.18
ASN7,SER43,TYR68,SER153, SER152, LEU62, LYS63,
LYS65,
NO LYS63
26 TNF anakinra -4.97 -0.15 GLN67 GLY66,PRO70,
LYS65 NO
27 IL4 anakinra -7.88 -0.23 THR39,ARG47,ASN38,SER36,
GLU43, ALA35 GLU103
CONCLUSION
In the present study a total 235unique genes were mined for PsA from 39 GWAS studies. The
functional annotation of a total of 235 genes was performed through Gene Ontology (GO)
analysis using DAVID which reported 216 genes and 238 GO terms for biological processes
(BP). The STRING database reported the genes namely IL8, TNF, VEGFA, TNFRSF11B,
IL8, IL6, TNF, IL10, TNF, TNF, IL6, TLR4, TNF, IL6, IL10, VEGFA, IL1B, TNFSF11,
IL10, CD55, TNF, TNFRSF11B, IL8, IL6, IL1B, TNF, IL4 and IL8 at the core region of the
RA network of 235 BP genes. These genes may be said to play a key in PsA as well as can be
differentially expressed in PsA disease. The Drug association analysis of WebGestalt has
reported 17 drugs interacted with 33 genes or its corresponding proteins out of which docking
was performed for 17 drugs and 33 potential targets as they are found to be key regulators in
PsA disease. The molecular docking studies have reported the drug-target interactions of
teicoplanin was -12.12 Kcal/mol, cyclosparine was -13.86 Kcal/Mol, hyaluronan was -9.69
Kcal/Mol, sulfasalazine Interaction of dinoprostone with VEGFA has the highest docking
scores of -13.86 Kcal/mol with energy minimization. Interaction of cyclosparine with IL10
has the lowest docking scores of -2.85 Kcal /mol with energy minimization. From this report
it is clear that PsA differs from person to person based on their genes and genetic interactions
and expressions which recommend the clinicians to go for personalized medicine rather that
generalized medicine for the patients with PsA.
ACKNOWLEDGEMENT
The authors are thankful to the head of Dept. of Bioinformatics and the Director of
ICMR-RMRC, Bhubaneswar for their cooperation.
REFERENCES
1. A. Gottlieb, N. J. Korman, K. B. Gordon et al., “Guidelines of care for the management
of psoriasis and psoriatic arthritis: section 2. psoriatic arthritis: overview and guidelines
of care for treatment with an emphasis on the biologics,” Journal of the American
Academy of Dermatology, 2008; 58(5): 851– 864.
2. D. D. Gladman, C. Antoni, P.Mease, D. O. Clegg, and O. Nash, “Psoriatic arthritis:
epidemiology, clinical features, course, and outcome,” Annals of the Rheumatic Diseases,
2005; 64(2): ii14–ii17.
3. Wright V: Psoriatic arthritis. A comparative radiographic study of rheumatoid arthritis
4. Hensler T, Christophers E: Psoriasis of early and late onset: characterization of two types
of psoriasis vulgaris. J Am Acad Dermatol, 1985; 13(3): 450–56.
5. Allen MH, Ameen H, Veal C et al: The Major Psoriasis Susceptibility Locus PSORS1 Is
not a Risk Factor for Late-Onset Psoriasis. J Invest Dermatol, 2005; 124: 103–6.
6. Veale D, Rogers S, Fitzgerald O: Classification of Clinical Subsets in Psoriatic Arthritis.
Br J Rheumatol, 1994; 33: 133–38.
7. Langley RGB, Krueger GG, Griffiths CE: Psoriasis: epidemiology, clinical features, and
quality of life. Ann Rheum Dis, 2005; 64: 18–23.
8. Niels Grabe and Karsten Neuber, Simulating psoriasis by altering transit amplifying cells,
2007; 23(11): 1309–1312. doi:10.1093/bioinformatics/btm042.
9. Chandran V, Schentag CT, Brockbank JE, et al. Familial aggregation of psoriatic arthritis.
Ann Rheum Dis., 2009; 68(5): 664–7.
10.Rigby AS, Voelm L, Silman AJ. Epistatic modeling in rheumatoid arthritis: an
application of the Risch theory. Genet Epidemiol., 1993; 10(5): 311–20.
11.Karason A, Love TJ, Gudbjornsson B. A strong heritability of psoriatic arthritis over four
generations–the reykjavik psoriatic arthritis study. Rheumatology, 2009; 48(11): 1424–8.
12.Trembath RC, Clough RL, Rosbotham JL, et al. Identification of a major susceptibility
locus on chromosome 6p and evidence for further disease loci revealed by a two stage
genome-wide search in psoriasis. Hum Mol Genet, 1997; 6(5): 813–20.
13.Gudjonsson JE, Karason A, Runarsdottir EH, et al. Distinct clinical differences between
HLA-Cw*0602 positive and negative psoriasis patients–an analysis of 1019 HLA-C- and
HLA-B-typed patients. J Invest Dermatol, 2006; 126(4): 740–5.
14.Okada Y, Han B, Tsoi LC, et al. Fine mapping major histocompatibility complex
associations in psoriasis and its clinical subtypes. Am J Hum Genet. 2014; 95(2): 162–72.
15.Bowes J, Budu-Aggrey A, Huffmeier U, et al. Dense genotyping of immunerelated
susceptibility loci reveals new insights into the genetics of psoriatic arthritis. Nat
Commun, 2015; 6: 6046.
16.Castillo-Gallego C, Aydin SZ, Emery P, et al. Magnetic resonance imaging assessment of
axial psoriatic arthritis: extent of disease relates to HLA-B27. Arthritis Rheum, 2013;
65(9): 2274–8.
17.Winchester R, Minevich G, Steshenko V, et al. HLA associations reveal genetic
heterogeneity in psoriatic arthritis and in the psoriasis phenotype. Arthritis Rheum, 2012;
18.Tiphaine Oudot1, Fabienne Lesueur1,2, Mickae¨ l Guedj3, Rafael de Cid1, Steven
McGinn1, Simon Heath1, Mario Foglio1, Bernard Prum3, Mark Lathrop1, Jean-Franc¸ois
Prud’homme4 and Judith Fischer1, An Association Study of 22 Candidate Genes in
Psoriasis Families Reveals Shared Genetic Factors with Other Autoimmune and Skin
Disorders, Journal of Investigative Dermatology, 2009; 129: 2637–2645.
doi:10.1038/jid.2009.157; published online 25 June 2009.
19.MacArthur J, Bowler E, Cerezo M, Gil L, Hall P, Hastings E, Junkins H, McMahon A,
Milano A, Morales J, Pendlington Z, Welter D, Burdett T, Hindorff L, Flicek P,
Cunningham F, and ParkinsonH. The new NHGRI-EBI Catalog of published
genome-wide association studies (GWASCatalog).Nucleic Acids Research, 2017; 45. (Database
issue): D896-D901.
20.X Jiao, BT Sherman, R Stephens, MW Baseler, HC Lane, RALempicki. DAVID-WS: a
stateful web service to facilitate gene/protein list analysis. Bioinformatics, 2012; 28(13):
1805-1806. doi: 10.1093/bioinformatics/bts251.
21.Huang DW, Sherman BT, Lempicki RA. Systematic and integrative analysis of large
gene lists using DAVID Bioinformatics Resources. Nature Protoc, 2009; 4(1): 44-57.
22.Szklarczyk D, Morris JH, Cook H, Kuhn M, Wyder S, Simonovic M, Santos A,
Doncheva NT, Roth A, Bork P, Jensen LJ, von Mering C. The STRING database in 2017:
quality-controlled protein-protein association networks, made broadly accessible. Nucleic
Acids Res., 2017 Jan; 45: D362-68.
23.Szklarczyk D, Franceschini A, Wyder S, Forslund K, Heller D, Huerta-Cepas J,
Simonovic M, Roth A, Santos A, Tsafou KP, Kuhn M, Bork P, Jensen LJ, von Mering
C.STRING v10: protein-protein interaction networks, integrated over the tree of
life.Nucleic Acids Res., 2015 Jan; 43: D447-52.
24.Zhang, B., Kirov, S.A., Snoddy, J.R. WebGestalt: an integrated system for exploring gene
sets in various biological contexts. Nucleic Acids Res, 33(Web Server issue), 2005;
741-748.
25.Wang, J., Duncan, D., Shi, Z., Zhang, B. WEB-based GEneSeTAnaLysis Toolkit
(WebGestalt): update 2013. Nucleic Acids Res, 41 (Web Server issue), 2013; W77-83.
26.The UniProt Consortium, UniProt: the universal protein knowledgebase, Nucleic Acids
Res., 2017; 45: D158-D169.
27.Poux S, Arighi, CN, Magrane M, Bateman A, Wei C-H, Lu Z, Boutet E, Bye-A-Jee H,
Famiglietti ML, RoechertB. On expert curation and sustainability: UniProtKB/Swiss-Prot
28.Pundir S, Martin MJ, O’Donovan C. UniProt Protein Knowledgebase, Methods Mol.
Biol., 2017; 1558: 41-55.
29.Kim S, Thiessen PA, Bolton EE, Chen J, Fu G, Gindulyte A, Han L, He J, He S,
Shoemaker BA, Wang J, Yu B, Zhang J, Bryant SH. PubChem Substance and Compound
databases. Nucleic Acids Res., 2016 Jan 4; 44(D1): D1202-13. Epub 2015 Sep 22
[PubMed PMID: 26400175] doi: 10.1093/nar/gkv951.
30.Wang Y, Bryant SH, Cheng T, Wang J, Gindulyte A, Shoemaker BA, Thiessen PA, He S,
Zhang J. PubChem BioAssay: 2017 update. Nucleic Acids Res., 2017 Jan 4; 45(D1):
D955-D963. [PubMed PMID: 27899599] doi: 10.1093/nar/gkw1118.
31.PyMOL Molecular Graphics System". SourceForge, "APBS", "PyMOL v2.0 Release
Notes", Unofficial Windows Binaries for Python Extension Packages.
https://en.wikipedia.org/wiki/PyMOL.
32.Dassault Systèmes BIOVIA, BIOVIA Workbook, Release 2017; BIOVIA Pipeline Pilot,
Release, 2017. San Diego:
DassaultSystèmes.http://accelrys.com/about/citations-references/.
33.RCSB Protein Data Bank: Sustaining a living digital data resource that enables
breakthroughs in scientific research and biomedical education
Protein Science, 2018; 27: 316–330. doi: 10.1002/pro.3331.
https://www.rcsb.org/pages/publications.
34.Modeller (copyright © 1989-2018 Andrej Sali), Departments of Biopharmaceutical
Sciences and Pharmaceutical Chemistry, and California Institute for Quantitative
Biomedical Research, Mission Bay Byers Hall, University of California San Francisco,
San Francisco, CA 94143, USA. Any selling or distribution of the program or its parts,
original or modified, is prohibited without a written permission from Andrej Sali. This
file last modified: Thu Oct 12 15:13:52 PDT 2017.
https://salilab.org/modeller/9.15/release.html.
35.Sitao Wu Yang Zhang, Nucleic Acids Research, 1 May 2007; 35(10): 3375–3382,
https://doi.org/10.1093/nar/gkm251.Published:03 May 2007.
https://academic.oup.com/nar/article/35/10/3375/1100889#82620642.
36.Morten Källberg, Haipeng Wang, Sheng Wang, Jian Peng, Zhiyong Wang, Hui Lu
&Jinbo Xu. Template-based protein structure modeling using the RaptorX web
37.Wang Z, Zhao F, Peng J, Xu J. Protein 8-class secondary structure prediction using
conditional neural fields. Proteomics, 2011 Oct; 11(19): 3786-92. doi:
10.1002/pmic.201100196. Epub 2011 Aug 31. http://raptorx.uchicago.edu/about/.
38.Liang J, Edelsbrunner H, Fu P, Sudhakar PV, Subramaniam S. Analytical shape
computation of macromolecules. II. Identification and computation of inaccessible
cavities in proteins. Proteins: Struct. Funct. Genet., 1998; 33: 18-29.
http://sts.bioe.uic.edu/castp/background.html.
39.Kawabata T. Detection of multi-scale pockets on protein surfaces using mathematical
morphology. Proteins, 2010; 78: 1195-1121.
40.Kawabata T, Go N. "Detection of pockets on protein surfaces using small and large probe
spheres to find putative ligand binding sites". Proteins, 2007; 68: 516-529.
http://strcomp.protein.osaka-u.ac.jp/ghecom/.
41.Word JM, Lovell, SC, Richardson, JS, and Richardson, DC "Asparagine and glutamine:
using hydrogen atom contacts in the choice of sidechain amide orientation" J. Mol. Biol.,
1999; 285: 1733-1745.
42.Dolinsky TJ, Nielsen JE, McCammon JA, and Baker NA PDB2PQR: an automated
pipeline for the setup, execution, and analysis of Poisson-Boltzmann electrostatics
calculations. Nucleic Acids Research, 2004; 32: W665-W667.
43.Hui Li, Andrew D. Robertson, and Jan H. Jensen Very Fast Empirical Prediction and
Interpretation of Protein pKa Values. Proteins, 2005; 61: 704-721.