Static Voltage Stability Analysis on IEEE 6-BUS
Power System using Power World Simulator
Yogesh Chileˡ, Miss Pradeepti Lakra²
ˡPG Scholar, ²Assistant Professor, Electrical Engineering Department, Jabalpur Engineering College, Jabalpur, India
Abstract: Power transmission capability (load ability) of a power system has traditionally been limited either by synchronous (or rotor angle) stability or by the thermal loading capability of transmission lines and their equipment. Another stability issue which is important other than rotor angle stability is the voltage stability. The analysis of voltage stability is a crucial issue in order to maintain the equilibrium of the system. If the voltage instability is not analyzed properly, this issue may lead to voltage collapse and a blackout may appear in the power system. Voltage collapse already caused a major blackout in Tokyo (Japan) Power System, on July 23, 1987. This paper tries to analyze in brief, the failure of Tokyo power system of that time period. This paper presents the static analysis of power system voltage stability by plotting and analyzing PV and QV curves of power system loads at different load power factors. This paper focuses on voltage stability analysis for a mesh - type network, i.e. , IEEE 6-Bus system in Power World Simulator . The plotting of PV and QV curves is done by using Microsoft Excel.
Keywords – voltage collapse, blackout, PV-curves and QV-Curves, load power factors, Power World Simulator.
I. INTRODUCTION
Based on IEEE/ CIGRE definition , voltage stability refers to the ability of a power system to maintain steady voltages at all buses in the power system after being subjected to a disturbance from a given initial operating conditions . This voltage stability or load stability has been studied deeply for many decades to improve the performance of power systems [1-2]. A power system enters a state of voltage instability when a disturbance or an increment in load demand or a change in system operating conditions causes a progressive and uncontrollable decline in voltage. Also, a power system is said to be voltage unstable if VQ- sensitivity is negative for at least one bus in that system [3]. Voltage stability is a very serious issue in operation and planning of power systems. Voltage instability may sometimes result into voltage collapse and system blackout state. The phenomenon of voltage collapse already caused a major blackout in TEPCO (Tokyo Electrical Power utility Company, Inc, Japan) on July23, 1987. Tokyo collapse is indeed a fascinating case study on power system stability till now. This failure has been a well studied example of pure voltage collapse [4-5]. Though, pure voltage collapse is a relatively uncommon event in a power system as the system dynamics often makes the system unstable long before the occurrence of voltage collapse.
In any given power system, there is a point of maximum load ability (ƛ), which is also called the aggregated system load. Once this value is reached, voltage collapse may occur. The power system load must be shed before reaching to the knee point of PV-curve in order to avoid voltage collapse. In other words, the load must not be increased any more near the knee points. For better security of power systems, the system operators must be guided to run them well beyond these knee points [5].
A. Case Study of Tokyo Blackout (On July 23, 1987)
may enter into blackout state. At around 13:19 hour, due to the application of air conditioner loads and lack of MVAR supports in Tokyo power system, the system voltage dropped to 370 kV. To avoid such voltage collapse, a much needed load shedding of 8.168 GW of load (i.e. 21% of total load) was done on that system. More than 3 hours were wasted to fully recover that system.
Voltage instability is essentially a local phenomenon; however, its consequences may have widespread cascaded impacts.
The study of voltage stability has been analyzed by many different approaches that can be basically classified into static and dynamic analysis. The static analysis methods use the steady-state models for analysis, such as, power flow model or a linear zed dynamic model while the dynamic methods imply the use of models characterized by non-linear differential and algebraic equations which include generator dynamics, OLTC transformers, SVC etc. through transient stability simulations [6].
PV-curve and QV-curve approach is used as a basic tool for static analysis of voltage stability of power systems [7-8].
Voltage stability analysis of a sample 3-bus system (with just a single load) has already been done by using Power World Simulation software for different values of load power factor [9].
Our paper presents the voltage stability analysis of IEEE 6-bus system (having three identical loads) on Power World Simulation software by applying equally-varying power factors of the system loads .This paper proposes load flow solutions by Polar Newton- Rap son method due to its efficient and fast convergence [10] .
II. THEORY AND EXPRESSIONS Static load flow equations of a power system is given as follows -
P=∑ | | | | cos(Ɵ − + )……….……… [1]
Q=∑ | | | | sin(Ɵ − + )………..……… [2]
The elements of Jacobean matrix are obtained by taking partial derivatives of above equations with respect to |V| and . The Jacobean matrix gives the linearised relationship between small changes in |V| and with small changes in real and reactive powers
∆P and ∆Q. The following form of solution is obtained – ∆
∆ =
∆
∆ ………..[3]
The new values of bus voltages and their angles are -
= +∆ ………. [4]
And | | =| |+|∆V|……….. [5] While eliminating Ɵ , , the following quadratic equation is obtained -
|| | = [1− ±√1− ( + 2 )]/2 ………...………. [6]
Where β = tan Ø, Ø =load power factor angle; = ,
Also = tan Ø ……… [7]
From eq. [6], it is cleared that the voltage at load point is influenced by -
[1] The power delivered to the load, [2] the line reactance and [3] load power factor. The voltage eq. has two solutions, one at the higher point and the other at the lower point of PV-curve. The first one indicates the stable point whereas the second one indicates the unstable point. The load at which the two solutions have one value indicates the steady-state voltage-collapse point or knee point or critical voltage point. Only, the operating points above the critical point represent the satisfactory operating conditions. In addition to PV-curves, QV-curves are also helpful in analyzing statically the voltage stability of power systems.
III. CASE STUDY OF SAMPLE POWER SYSTEM
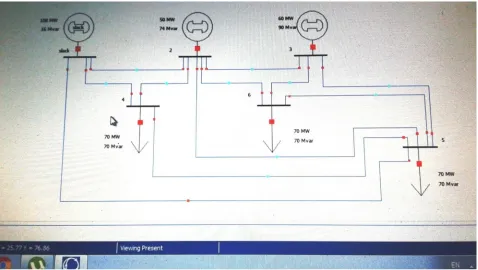
Fig 1 : - Layout OF IEEE 6-Bus System on Power World Simulator
[image:3.612.69.547.76.346.2]IEEE 6-BUS POWER SYSTEM : DATA SET TABLE 1 :- BUS DATA
BUS
NO. BUS TYPE V(P.U.) (Degrees)
LOAD MW
LOAD MVAR
1 SB (SLACK) 1.05 0 0 0
2 PV 1.05 0 0 0
3 PV 1.07 0 0 0
4 PQ 0 0 70 70
5 PQ 0 0 70 70
6 PQ 0 0 70 70
TABLE 2 :- GENERATOR DATA BUS
NO.
GENERATOR (P) IN MW
GENERATOR
(Q) IN MVAR P MAX P MIN Q MAX Q MIN
1 0 0 200 50 100 -100
2 50 0 150 37.5 100 -100
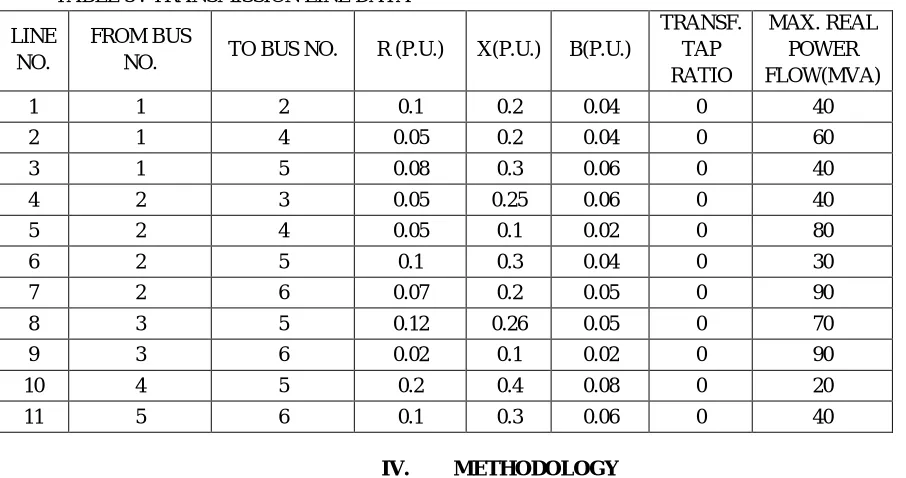
[image:3.612.65.391.382.559.2]TABLE 3 :-TRANSMISSION LINE DATA
LINE NO.
FROM BUS
NO. TO BUS NO. R (P.U.) X(P.U.) B(P.U.)
TRANSF. TAP RATIO
MAX. REAL POWER FLOW(MVA)
1 1 2 0.1 0.2 0.04 0 40
2 1 4 0.05 0.2 0.04 0 60
3 1 5 0.08 0.3 0.06 0 40
4 2 3 0.05 0.25 0.06 0 40
5 2 4 0.05 0.1 0.02 0 80
6 2 5 0.1 0.3 0.04 0 30
7 2 6 0.07 0.2 0.05 0 90
8 3 5 0.12 0.26 0.05 0 70
9 3 6 0.02 0.1 0.02 0 90
10 4 5 0.2 0.4 0.08 0 20
11 5 6 0.1 0.3 0.06 0 40
IV. METHODOLOGY
The methodological steps of plotting PV-curves (and QV-curves) are listed in step [1] to step [4]
1) Step [1]: Select a load bus. The PV- and QV-curves will be plotted at this bus. Bus no. 4 is selected in our case due to low bus voltage.
2) Step [2]: Keep the load power factor angle Ø as 45° lagging (and = tan Ø ), increase load MW and MVAR until the blackout condition is reached.
3) Step [3]: Repeat step [2] with load power factor angles of 20° lagging, 20° leading, 45° leading and note the blackout condition for each.
4) Step [4]: Prepare the load data sheet for each power factor. We get 4 data sheets for our system. 5) Step [5]: By using Microsoft Excel, PV and QV curves for the selected bus can be plotted.
The loads are assumed of constant power-load characteristics as this type of load is favorable to voltage instability problems.
V. SIMULATION RESULTS AND DISSCUSSION
SIMULATION RESULTS :-
TABLE 4 :- LOAD VOLTAGE AT 45° LAGGING LOAD POWER FACTOR
LOAD ACTIVE POWER (P in MW)
LOAD REACTIVE POWER (Q in MVAR)
BUS 4 LOAD VOLTAGE - V(P.U.)
BUS 4 LOAD ANGLE - (Degrees)
0 0 1.0484 4
50 50 1.0052 -1.72
100 100 0.8739 -7.82
150 150 0.5606 -14.32
155 155 0.5432 -14.6
156 156 0.5398 -14.7
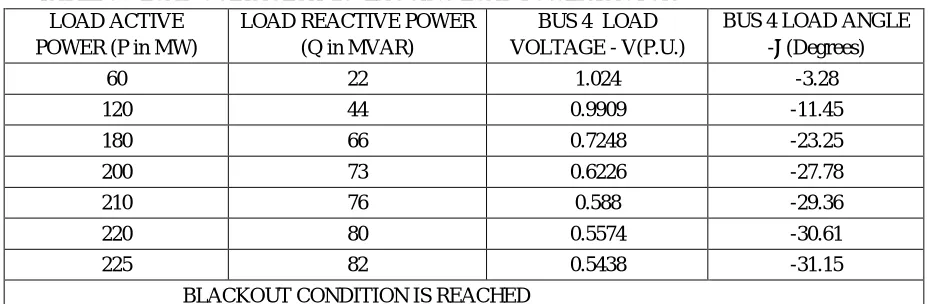
[image:4.612.74.539.512.708.2]TABLE 5 :- LOAD VOLTAGE AT 20° LAGGING LOAD POWER FACTOR LOAD ACTIVE
POWER (P in MW)
LOAD REACTIVE POWER (Q in MVAR)
BUS 4 LOAD VOLTAGE - V(P.U.)
BUS 4 LOAD ANGLE - (Degrees)
60 22 1.024 -3.28
120 44 0.9909 -11.45
180 66 0.7248 -23.25
200 73 0.6226 -27.78
210 76 0.588 -29.36
220 80 0.5574 -30.61
225 82 0.5438 -31.15
BLACKOUT CONDITION IS REACHED
TABLE 6 :- LOAD VOLTAGE AT 20° LEADING LOAD POWER FACTOR LOAD ACTIVE
POWER (P in MW)
LOAD REACTIVE POWER (Q in MVAR)
BUS 4 LOAD VOLTAGE - V(P.U.)
BUS 4 LOAD ANGLE - (Degrees)
75 -27 1.0551 -5.68
150 -55 1.0517 -16.25
225 -82 1.0214 -29.19
250 -91 0.9567 -36.15
260 -95 0.8185 -39.5
267 -97 0.7408 -45.13
BLACKOUT CONDITION IS REACHED
TABLE 7 :- LOAD VOLTAGE AT 45° LEADING LOAD POWER FACTOR LOAD ACTIVE
POWER (P in MW)
LOAD REACTIVE POWER (Q in MVAR)
BUS 4 LOAD VOLTAGE - V(P.U.)
BUS 4 LOAD ANGLE - (Degrees)
50 -50 1.077 -2.88
100 -100 1.105 -9.61
150 -150 1.123 -16.5
220 -220 1.118 -27.5
300 -300 1.096 -44.8
310 -310 1.076 -48.9
316 -316 1.027 -55
BLACKOUT CONDITION IS REACHED
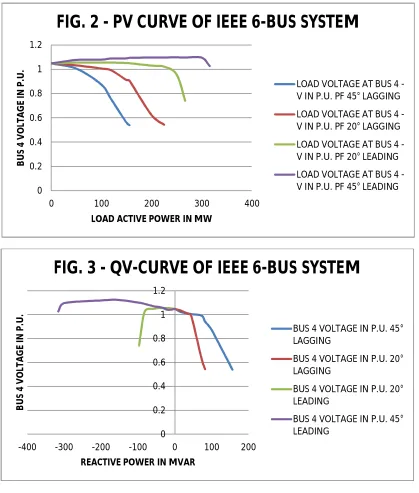
By varying / / and / / with constant generator power and varying Ø in for steps ( 45° lagging , 20° lagging ,20°leading and 45° leading )the results obtained using Power World Simulator are given in the table-4 to table-7 . PV-curves are plotted by taking on y-axis against on x-axis and combining all of them of different load power factors, we get the PV-curve of the sample power system. Similarly, QV-curve can be plotted for the sample power system.
1) AVR control of generators.
2) Load- shedding during contingencies. 3) Reactive-power compensation.
4) Use of under-load tap-changing transformers.
VI. CONCLUSION
The analysis of voltage stability is a very important parameter for monitoring the bus voltages in the electrical power systems. The bus voltages must not be operated close to critical values or knee points of PV-curves otherwise voltage instability may cause many serious problems to the power system operation. For lagging load power factors, as seen in QV-curve diagram, the load bus voltage falls rapidly, VAR compensation is a must to maintain voltage stability. This paper presents quite a simple technique but very helpful to system operators in understanding the behavior of voltage instability. From simulation of the sample-system model, all
0 0.2 0.4 0.6 0.8 1 1.2
0 100 200 300 400
B U S 4 V O LT A G E IN P .U .
[image:6.612.98.517.137.630.2]LOAD ACTIVE POWER IN MW
FIG. 2 - PV CURVE OF IEEE 6-BUS SYSTEM
LOAD VOLTAGE AT BUS 4 -V IN P.U. PF 45° LAGGING
LOAD VOLTAGE AT BUS 4 -V IN P.U. PF 20° LAGGING
LOAD VOLTAGE AT BUS 4 -V IN P.U. PF 20° LEADING
LOAD VOLTAGE AT BUS 4 -V IN P.U. PF 45° LEADING
0 0.2 0.4 0.6 0.8 1 1.2
-400 -300 -200 -100 0 100 200
B U S 4 V O LT A G E IN P .U .
REACTIVE POWER IN MVAR
FIG. 3 - QV-CURVE OF IEEE 6-BUS SYSTEM
BUS 4 VOLTAGE IN P.U. 45° LAGGING
BUS 4 VOLTAGE IN P.U. 20° LAGGING
BUS 4 VOLTAGE IN P.U. 20° LEADING
Future work will concentrate on analyzing voltage stability of power systems by placing voltage stability enhancing devices on various critically affected load buses during different contingencies .The Power World Simulator works on the condition of constant frequency, so results obtained on it may be helpful in understanding the nature of voltage instability which is fully independent of frequency variations in the power system. Power System operators must keep these things in the mind while dealing with Power World Simulator - based voltage stability analysis.
REFERENCES
[1] L. L. Grigsby; ʽʽElectrical Power Engineering Handbook ʼʼ; New York; CRC/IEEE; 2001.
[2] Y. Mansour; etal; ʽʽ Voltage Stability of Power Systems: Concepts, Analytical Tools and Industrial Experience ʼʼ; IEEE Power Engineering Society; Piscataway; IEEE Corp. ; 1990.
[3] P. Kundar ; ʽʽPower System Stability and Controlʼʼ ; (McGraw Hill Publications ) ; 1994 .
[4] Samuel C. Chevalior; ʽʽThe Blackout of 1987 in Tokyo, Japan: Pure Voltage Collapseʼʼ ; Conference at University of Vermont; Burlington; 2015.
[5] Atsushi Kurita and Takeichi Sakuraj ; ʽʽThe Power System Failure on July 23 , 1987 in Tokyoʼʼ ; IEEE 27th Conference On Decision And Control ; Austin ; Texas ; 1988 .
[6] J.C.Chow , R.Fischl and H.Yan ; ʽʽOn The Evaluation on Voltage Collapse Criteriaʼʼ ; IEEE Trans. ; PWRS-5 ; pp-612-650 ; 1990 . [7] Peter Sauer; ʽʽPower System Dynamics and Stabilityʼʼ ; Willey Publications; 1997 .
[8] Asfar Ali Khan; ʽʽPV Curves for Radial Transmission Linesʼʼ ; National System Conference; Manipal Institute of Technology; 2007 .