Development and Validation of a Finite Element
Programme for Determining Stress and
Displacement in Truss
Sheikh Musadiq Wakil1, Arabinda Sharma2
1, 2
Civil Engineering Department, BRCM college of Engineering and Technology, Bahal-127028, Bhiwani, Haryana, India
Abstract: The present communication aims at development, implementation and evaluation of finite element method (FEM) in the MATLAB environment for the determining stress and displacement in a truss. For this purpose, a simple 3-D truss with 48 members was designed in MATLAB. A MATLAB script based on finite element method (FEM) was developed in the form of m-file to generate the numerical results on stress and displacement of the truss members under the application of lateral forces. The results were obtained in the form of graphical form for visual analysis and tabular in form for statistical analysis. Subsequently, the results were validated for the results obtained by analyzing the same truss in STAAD Pro for stress and displacement. The visual analysis showed that out of the 48 structural members 24 were deformed and the remaining 24 were undeformed. The deformation in the truss members facing the lateral force took place because of tension stress while the truss members opposite to applied lateral force underwent deformation due to compression stress. The validation of the developed FEM script in MATLAB was carried out in reference to the results obtained through STAAD Pro using descriptive statistics like maximum, minimum, mean, variance and median values of the observed stress in the truss members. The research work also analyzed the two results for the equal mean and variance using T-test and F-test, respectively. It showed a slight dissimilarity in the mean and variance of the two results (P-value > 0.05). Paired T-test also pointed towards a similar observation. However, the p-value of the test showed that the sign of the two results matched perfectly with each other. Moreover, the values of validation statistics ME, MAE and R2 (>0.95) also indicated an agreement between the two results. Thus, it can be inferred that programming in MATLAB can also be used as an independent powerful tool for the analysis of a given structure.
Index Terms: Truss analysis, Finite element method, displacement, and stresses, MATLAB, STAAD Pro
I. INTRODUCTION
There are traditionally two methods either a theoretical or an experimental method to deal with any physical problem in engineering and science. The theoretical method in terms of mathematical modelling is an ideal and simple way for deriving major characteristics of the real problems. In contrast, the experimental method is usually expensive to conduct, if not impractical. It is further constrained by physical scale, the range of physical parameters and time for carrying out the experiments. The recent increase in computing power has paved the way for the third type of method of computational modelling and numerical experimentation. It is now widely accepted that computational modelling and computer simulations serve as a cost-effective alternative to bridge the gap between the traditional theoretical and experimental methods to problem-solving [1]. Numerical simulation of a process means the solution of the governing equations (or mathematical model) of the process using a numerical method and a computer [2]. Using computer-based numerical solutions necessitate for efficient algorithms that are also capable of providing reasonably acceptable results within a short computational time. Almost all computations involve some degree of approximation and which in turn resulted in a limited or a finite precision. This implies that the results obtained are only correct within a certain limit. To overcome these limitations more versatile and efficient method such as the finite element method (FEM) has emerged hastily in the field of computational engineering for a wide range of applications [3].
tools available that can solve varieties of problems. Some of these packages are ANSYS, ALGOR, NISA, ABAQUS, NASTRAN, STAAD-Pro etc. having pre and post processors that give graphical interfaces to visualize the structure before and after loading [6]. Alternatively, FEM can be implemented using the independent code in a computer language. MATLAB offers such an opportunity with easy writing of codes through customization existing library of codes which are again faster with an integrated interface for graphical operations [7], [8]. The MATLAB can analyze a variety of hand-oriented methods such as displacement and force methods of structural analysis of the various skeletal structures within its environment [9]. This versatility makes MATLAB as a good choice among the civil engineers for analysis of various engineering structure [10]. Several researchers have used FEM in MATLAB environment for their specific studies including optimization of topology and geometry of plane truss using stress and displacement [11], [12]. Ozbasaran [13] implemented FEA in MATLAB for static, global member buckling and frequency analysis of 2D and 3D trusses. Pavlou [14] used an analytic procedure for analysis of for 2D and 3D trusses using the stiffness matrix method in MATLAB and ANSYS. Kale et al. [15] studied the efficient method for cost optimization for bridges and towers using MATLAB. RSTAB [16] is an independent free tool for analysis of 2D truss based on FEA. Rao [6] studied the solution of a twenty five-bar space truss subjected to loads using finite element analysis for determining stress and displacement. However, most of the previous studies lack validation of the developed MATLAB program. Keeping in view the above facts, the present work aims at the development of an FEA code within the MATLAB environment for a 3D truss analysis and subsequent validation of its results using widely acclaimed STAAD Pro tool.
II. OBJECTIVES
The prime objective is to become familiar with finite element methods by the use of MATLAB programming language. However, the research work has following specific objectives:
A. To develop and implement MATLAB programme for FEA of a truss structure.
B. To compare the results obtained through MATLAB programming graphically and statistically with respect to the outputs of
STAAD Pro.
C. To validate the finite element analysis results of MATLAB programming with that of STAAD Pro using validation statistics like
Mean Error (ME), Mean Absolute Error (MAE) and R2.
III. METHODOLOGY
The framed objectives were achieved by adopting a method in the following three steps (a) design of the truss structure in MATLAB and STAAD Pro. b) Analysis of the truss structure using FEM in MATLAB and STAAD Pro c) Validate the result of MATLAB with reference to STAAD Pro.
A. Design of The Truss
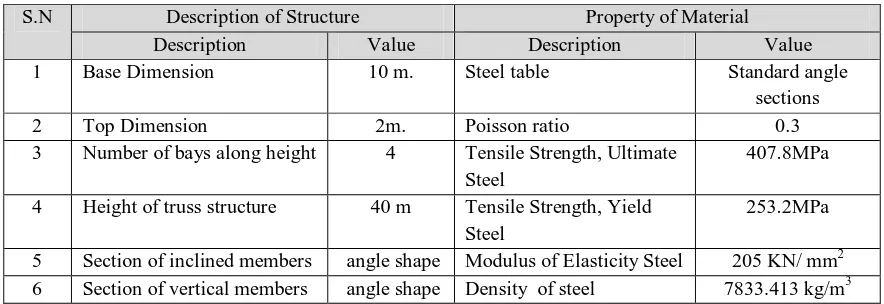
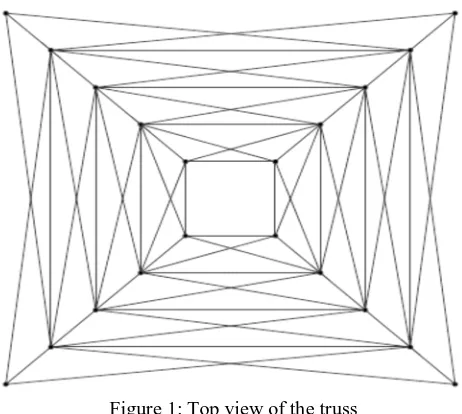
[image:2.612.85.527.554.706.2]In the present work, a simple 3D vertical steel truss structure was designed using tools in MATLAB and STAAD Pro. Table 1 shows the general description of the 3D truss and truss material used in this work. Figure 1 shows the plan and 3D view of the vertical truss.
Table 1: Description of Structure and Property of Material Used
S.N Description of Structure Property of Material
Description Value Description Value
1 Base Dimension 10 m. Steel table Standard angle
sections
2 Top Dimension 2m. Poisson ratio 0.3
3 Number of bays along height 4 Tensile Strength, Ultimate
Steel
407.8MPa
4 Height of truss structure 40 m Tensile Strength, Yield
Steel
253.2MPa
5 Section of inclined members angle shape Modulus of Elasticity Steel 205 KN/ mm2
Figure 1: Top view of the truss
It is a symmetrical structure i,e centroid and centre mass of the structure coinciding with each other. Thus, it has similar characteristics in both X-direction and Y-direction.
B. Wind and terrain information
As far as lateral load on a tall structure is concerned wind and terrain information is very crucial. The wind region considered for the present work was zone 4 (wind velocity 47 m/s) and terrain category 2 (elevation: 100 m) as per IS code 875:1987 (part 3). The regional 3 second gust speed (VR) depends on the wind region, wind consideration was also the same in code IS 800:2007. But this research only used lateral forces as live load in X, Y and Z axis as per the code IS 800:2007 for validation of MATLAB programming with STAAD Pro software.
C. Load Calculation
Gravity Load: The present work considered only live and dead load on this hypothetical truss structure on X, Y and Z axis at respective nodes as per IS code in MATLAB programming.
D. Finite Element Programming in MATLAB
MATLAB manipulates matrices and vectors with relative ease and focus on fundamentals ideas rather than on algorithmic details [17]. Hence, MATLAB was used for the development FEA program with the following main routines in the FEA code:
1) Preprocessing including input data and assembling the proper arrays, vectors, and matrices.
2) Calculation of element stiffness matrices and force vectors
3) Direct assembly of matrices and vectors
4) Partition and solution
5) Post-processing for secondary variables
The explanation for various MATLAB routines (stored in *.m files) were described as comments within each subroutine.
E. Statistical Comparison and Validation
The results of FEM implementation in MATLAB environment was verified and validated for its correctness. In order to validate the results of MATLAB programming, the same truss was configured in the STAAD Pro under similar environment. For statistical verification, the results on stress and displacement of the truss members obtained FEM in MATLAB and STAAD Pro was compared using various descriptive statistics, F-test, t-test and paired t-test. These statistical analyses help to decipher the facts if the results obtained from two computing tools were derived from the same population and are statistically similar. The results obtained thereof was used as a reference to check the reliability of the results obtained through MATLAB using various
IV. RESULTS AND DISCUSSION
A. Output of MATLAB
[image:4.612.202.410.139.724.2]The very first output obtained on running MATLAB programme is summarized in Table 2.
Table 2: Output file of MATLAB
Element number
Area of each element(mm2)
Length in mm
Stress in Mpa
1 5.3794e+05 13466 12.92
2 5.3794e+05 13466 -97.81
3 5.3794e+05 13466 5.18
4 5.3794e+05 13466 57.17
5 5.3794e+05 13466 6.56
6 5.3794e+05 13466 -63.49
7 5.3794e+05 13466 3.07
8 5.3794e+05 13466 41.147
9 5.3794e+05 13466 -5.27
10 5.3794e+05 13466 -18.42
11 5.3794e+05 13466 -0.02
12 5.3794e+05 13466 18.23
13 1.6084e+05 7333.3 26.14
14 1.6084e+05 7333.3 28.63
15 1.6084e+05 7333.3 -19.68
16 1.6084e+05 7333.3 -7.02
17 62142 4666.7 -8.15
18 62142 4666.7 20.91
19 62142 4666.7 -15.88
20 62142 4666.7 -19.36
21 10966 2000 -57.68
22 10966 2000 11.172
23 10966 2000 -11.2
24 10966 2000 57.22
25 4.125e+05 15958 -1.71
26 4.125e+05 15958 -28.86
27 4.125e+05 15958 19.37
28 4.125e+05 15958 51.95
29 4.125e+05 15958 -51.21
30 4.125e+05 15958 -28.86
31 4.125e+05 15958 19.37
32 4.125e+05 15958 -4.06
33 3.4501e+05 14682 28.01
34 3.4501e+05 14682 -21.482
35 3.4501e+05 14682 15.778
36 3.4501e+05 14682 29.415
37 3.4501e+05 14682 -73.05
38 3.4501e+05 14682 -21.48
39 3.4501e+05 14682 15.78
40 3.4501e+05 14682 6.53
41 3.1366e+05 13808 41.19
42 3.1366e+05 13808 -7.98
43 3.1366e+05 13808 7.99
44 3.1366e+05 13808 55.04
45 3.1366e+05 13808 -7.98
46 3.1366e+05 13808 -66.96
47 3.1366e+05 13808 7.99
The output from the MATLAB gave the length of each member in mm and stress in MPa of each member. The tension stress (+ve) and compression stress (-ve) on each member. It showed that stress experienced on each member elements differed considerably depending upon their relative locations with respect to applied lateral force.
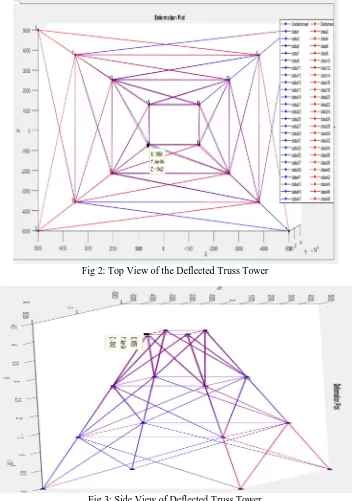
[image:5.612.131.483.159.660.2]The subsequent outputs are presented in the form of deflection plot in Figures 2-3 for the top and side view of the truss. The Figures showed the deflection of members because of the application of lateral load on respective nodes in two colors. The red color shows the deflected portion of the truss of 3D Truss and blue color shows the un-deflected portion of the Truss.
Fig 2: Top View of the Deflected Truss Tower
Fig 3: Side View of Deflected Truss Tower
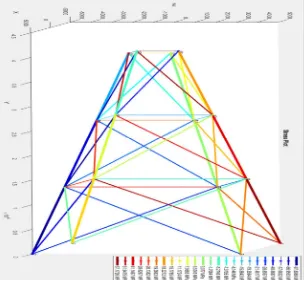
Figures 4-5 (top and lateral view) depict the stress experienced by each of the structural members of the truss in a color scale. The red color means that the member was experiencing more stress due to lateral load and green color indicating less stress in that member. The Figures revealed that all the structural elements were under stress irrespective of their deformation status. Some of the members were under compression stress (-ve stress values) while some others were under tension stress (+ve stress values).
Fig 4: Top view of stress plot of truss tower
[image:6.612.154.460.440.723.2]The sides which faced the applied lateral forces directly are under tension stress (dark red to light red in the Figure) due to the fact that on these members the vertical load due to self-weight of the structure was exceeded by the lateral load. In contrast, the opposite side members experienced compression stress (dark blue to light blue) due to the fact that the vertical load could not be exceeded by the exerted lateral loads. Similar results were observed for other sides (one compression and one tension) but the values of stress were relatively low. Irrespective of the nature of the stress, the values of stress for a given member of the truss were observed to be more at the bottom and it decreased with increasing height of the truss members. This is because the bottom members were fixed on the ground and were subjected to the highest degree of vertical loads.
B. Simulation in STAAD Pro
[image:7.612.187.427.138.718.2]After truss designing, analysis and post processing in STAAD Pro, the result of in terms of stress values along with weight and length for all the members are presented in Table 3.
Table 3: Output File of STAAD Pro
Member Profile
length (mms) Weight (n) Stress (MPa)
1 ISA200X200X25 13465.97 9734.168 11.03
2 ISA200X200X25 13465.97 9734.168 -90.71
3 ISA200X200X25 13465.97 9734.168 4.91
4 ISA200X200X25 13465.97 9734.168 49.17
5 ISA200X200X25 13465.97 9734.243 6.01
6 ISA200X200X25 13465.97 9734.243 -60.30
7 ISA200X200X25 13465.97 9734.243 2.65
8 ISA200X200X25 13465.97 9734.243 39.16
9 ISA200X200X25 13465.97 9734.166 -6.01
10 ISA200X200X25 13465.97 9734.166 -19.57
11 ISA200X200X25 13465.97 9734.166 0.02
12 ISA200X200X25 13465.97 9734.166 18.23
13 ISA200X200X25 7333.34 5301.063 25.19
14 ISA200X200X25 7333.34 5301.063 28.60
15 ISA200X200X25 7333.34 5301.063 -18.60
16 ISA200X200X25 7333.34 5301.063 -7.00
17 ISA200X200X25 4666.66 3373.396 -8.15
18 ISA200X200X25 4666.66 3373.396 20.91
19 ISA200X200X25 4666.66 3373.396 -16.01
20 ISA200X200X25 4666.66 3373.396 18.97
21 ISA200X200X25 2000 1445.743 -55.68
22 ISA200X200X25 2000 1445.743 10.98
23 ISA200X200X25 2000 1445.743 -11.01
24 ISA200X200X25 2000 1445.743 56.94
25 ISA110X110X12 15958.25 3077.022 -1.71
26 ISA110X110X12 15958.25 3077.022 -28.80
27 ISA110X110X12 15859.25 3077.022 19.30
28 ISA110X110X12 15859.25 3077.022 50.85
29 ISA 110X110X12 15859.25 3077.022 -51.20
30 ISA 110X110X12 15859.25 3077.022 -28.84
31 ISA 110X110X12 15859.25 3077.022 18.30
32 ISA 110X110X12 15859.25 3077.022 -4.06
33 ISA 110X110X12 14681.87 2830.914 28.05
34 ISA 110X110X12 14681.87 2830.914 -21.48
35 ISA 110X110X12 14681.87 2830.914 15.78
36 ISA 110X110X12 14681.87 2830.914 29.01
37 ISA 110X110X12 14681.87 2830.914 -72.56
38 ISA 110X110X12 14681.87 2830.914 -21.40
39 ISA 110X110X12 14681.87 2830.914 15.40
40 ISA 110X110X12 14681.87 2830.914 6.53
41 ISA 110X110X12 13808.17 2662.450 42.07
42 ISA 110X110X12 13808.17 2662.450 -7.56
43 ISA 110X110X12 13808.17 2662.450 8.00
44 ISA 110X110X12 13808.17 2662.450 54.56
45 ISA 110X110X12 13808.17 2662.450 -7.84
46 ISA 110X110X12 13808.17 2662.450 -67.04
47 ISA 110X110X12 13808.17 2662.450 7.86
The size and weight determined by STAAD Pro were exactly similar to that of MATLAB Programme while the stress values varied a lot which was discussed in more detail in the subsequent section.
Figure 6 shows the plot of the side view of the truss structure with the degree of deflection. The shape of the deflected truss is shown in green color while the original shape of the truss is shown in grey color. From the figure, it is quite obvious that all the structural members of the truss experienced the different magnitude of deflection due to the applied lateral load. The members at the bottom were suffered little deflection while the members at the top suffered the most deflection. This was happened because of the fastened foot of the truss on the ground.
Similarly, Figure 7 shows the plot of the magnitude of stress observed at each of the members of the truss. The blue-colored truss is the original truss while the distance of the red-colored truss from the original one indicated the magnitude of stress. There observed a directional variation in the magnitude of stress in the different members of the truss.
[image:8.612.220.383.213.528.2]Fig 6: 3D View of Deflected Truss Tower
Fig 7: 3D View of Stress Plot of Truss Tower
The magnitude of stress observed to be more for the structural member on the top of the truss and for the truss members which were facing the applied lateral force directly. These observations were quite similar to that of the results obtained from MATLAB programming. It confirmed that the MATLAB codes were written accurately. However, from visual inspection point of view, it was not possible here to infer the nature of stress (say tension or compression) experienced by an individual truss member which was possible in case of MATLAB programme establishing its superiority for visual inspection.
C. Statistical Comparison and Validation
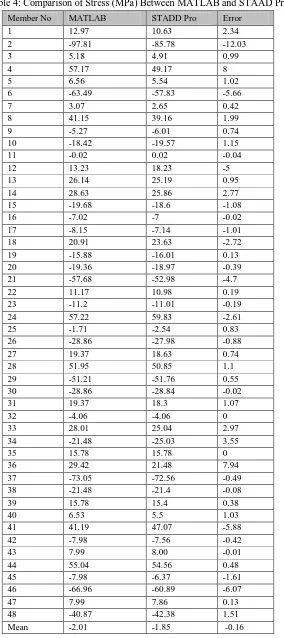
[image:8.612.231.381.214.375.2]Table 4: Comparison of Stress (MPa) Between MATLAB and STAAD Pro
Member No MATLAB STADD Pro Error
1 12.97 10.63 2.34
2 -97.81 -85.78 -12.03
3 5.18 4.91 0.99
4 57.17 49.17 8
5 6.56 5.54 1.02
6 -63.49 -57.83 -5.66
7 3.07 2.65 0.42
8 41.15 39.16 1.99
9 -5.27 -6.01 0.74
10 -18.42 -19.57 1.15
11 -0.02 0.02 -0.04
12 13.23 18.23 -5
13 26.14 25.19 0.95
14 28.63 25.86 2.77
15 -19.68 -18.6 -1.08
16 -7.02 -7 -0.02
17 -8.15 -7.14 -1.01
18 20.91 23.63 -2.72
19 -15.88 -16.01 0.13
20 -19.36 -18.97 -0.39
21 -57.68 -52.98 -4.7
22 11.17 10.98 0.19
23 -11.2 -11.01 -0.19
24 57.22 59.83 -2.61
25 -1.71 -2.54 0.83
26 -28.86 -27.98 -0.88
27 19.37 18.63 0.74
28 51.95 50.85 1.1
29 -51.21 -51.76 0.55
30 -28.86 -28.84 -0.02
31 19.37 18.3 1.07
32 -4.06 -4.06 0
33 28.01 25.04 2.97
34 -21.48 -25.03 3.55
35 15.78 15.78 0
36 29.42 21.48 7.94
37 -73.05 -72.56 -0.49
38 -21.48 -21.4 -0.08
39 15.78 15.4 0.38
40 6.53 5.5 1.03
41 41.19 47.07 -5.88
42 -7.98 -7.56 -0.42
43 7.99 8.00 -0.01
44 55.04 54.56 0.48
45 -7.98 -6.37 -1.61
46 -66.96 -60.89 -6.07
47 7.99 7.86 0.13
48 -40.87 -42.38 1.51
Table 4 indicates that both results were quite equivalent to each other with small errors except for a few members such as 2, 6, 21, 41 and 46 where the difference -ve stress/ compression stress were relatively higher (>5) and also at members 4, 34, 36 where the error in +ve stress/ tension stress were relatively large. In overall the mean error (ME) was observed to be -0.16 MPa indicating that -ve errors and +ve errors almost negated each other. The value of absolute mean error (AME) was found to be 1.96MPa which was relatively small compared to the range of stress values observed for various truss members as shown in Table 6.
Table 6: Descriptive Statistic of Stress (MPa)
Parameters MATLAB STAAD Pro
N 48 48
Min -97.81 -85.78
Max 57.22 59.83
Sum -96.66 -88.72
Mean -2.01375 -1.84833
Variance 1200.378 1094.034
Stand. dev 34.64647 33.07619
Median 1.525 1.335
25 percentile -19.6 -19.42
[image:10.612.125.488.484.713.2]75 percentile 19.37 18.5475
Table 6 also provides the various descriptive statistics of observed stress. The minimum values of stress in MATLAB and STAAD Pro were -97.81 MPa,-85.78 MPa respectively while the maximum values for the same were 57.22 MPa and 59.83 MPa
respectively. The variance (σ2), a measurement of the spread between numbers in a dataset, was 1200.378 MPa and 1094.034 MPa
for MATLAB and STAAD Pro, respectively. On the other hand, median values are 1.525 and 1.335 between MATLAB and STAAD Pro. Similarly, no much difference was observed for the values of median, 25 and 75 percentiles of the two datasets. All these observations showed that the results agreed well with each other for both tension and compression segments of the truss though the degree of agreement was relatively better for members that were under tension stress (positive values).
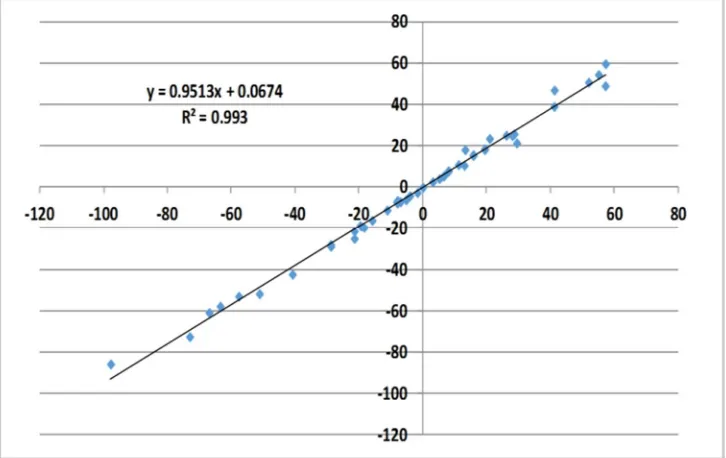
In the linear regression model, the statistical term Standard Error of Regression expressed ‘r’ is a measure of dispersion and if the dispersion is within the acceptable margins of error. The interpretation is that if most of the data are close to or around the
regression line and its limits (standard error margins) that is, 95%. As the value of R2 was 0.993 for the two datasets, it is
quite evident that the values of stress were close to the line and the results obtained using FEM implemented in MATLAB is in agreement with results obtained from STAAD Pro (Figure 8).
Subsequently, the stress values determined using FEM implemented in MATLAB and STAAD Pro were compared for equal mean and variance using t-test and F-test, respectively. The t-test, based on T-distribution was considered an appropriate test for judging the significance of a sample mean or for judging the significance of the difference between the means of two samples (n <50) in case of small sample when the population variance is unknown. F-Test is based on F-distribution and was used to compare the variance of the two independent samples. The t-stat and F-stat were derived for a null hypothesis of equal mean and equal variance. The p-values of the t-test were derived using 9999 bootstrapped random sample ensuring more reliability of the analysis. Since for all the cases p-values in the tables are greater than 0.01, it can be inferred that the mean and variance of stress observed using MATLAB and STAAD Pro at different members of the truss were, though small, but statistically different from each other. Finally, paired t-test was used to test the null hypothesis that the average of the differences between a series of paired observations is zero. The results of paired t-test indicated that the paired values of stress obtained through two computational methods are significantly different (p-value > 0.01) at 99% level of significance. However, the sign test, a non-parametric test, confirmed that signs of the two datasets were matched well with each other (p-value < 0.01).
V. CONCLUSION
In the present research communication, a vertical Truss with Pratt steel bracing system was analyzed for stress and deflection using finite element analysis implemented in MATLAB m-file and STAAD Pro software. The major conclusion derived out of this work is that the stresses and deflection most of the members of analyzed truss structure are approximately the same in both MATLAB and STAAD Pro software. However, the following are the specific conclusions drawn from the results of the present work:
A. The stress of each member of the respective truss structure determined using finite element methods were found to have
increased from ground to top of the truss.
B. Displacements with respect to lateral load were a little higher in STAAD Pro simulation compared to displacement observed in
MATLAB for the truss.
C. The visual analysis showed a considerable similarity in the observation out of the results obtained through the two methods.
D. As the descriptive statistics indicated that the results obtained for the 3D truss through MATLAB and STAAD Pro have only
little difference
E. The validation carried out using ME (-0.17MPa), MAE (1.96 MPa) and R2 (0.993showed that results obtained using FEM
implemented in MATLAB are in agreement with the results obtained from STAAD Pro.
F. For both t-stat and F-stat the p-values were greater than 0.01 at 99% level significance. It inferred that the mean and variance of
stress observed using MATLAB and STAAD Pro at different members of the truss were statistically different from each other.
G. The paired t-test indicated that the sign of the data set matched with each other in a statistically significant way.
The outcomes of the research work reaffirmed that MATLAB can be used as a programming tool for the analysis of various engineering structure.
REFERENCES
[1] Yang, X.-S. (2006). Introduction to Computational Engineering with Matlab. Cambridge: GBR: Cambridge International Science Publishing. [2] Reddy, J. N. (2004). Introduction to Nonlinear Finite Element Analysis. Cary, NC, USA: Oxford University Press
[3] Pelosi, G., Cocciolli, R., & Selleri, S. (2009). Quick Finite Element Analysis for Electromagnetic Waves. Norwood, MA, USA: Artech House. [4] Jin, J., & Riley, D. J. (2009). Finite Element Analysis of Antennas and Arrays. Hoboken, NJ, USA: Wiley-IEEE Press.
[5] Bhavikatti, S. (2004) Finite Element Analysis, New Age International, Delhi, IND.
[6] Rao, S.S. (2018) The Finite Element Method in Engineering (Sixth Edition). Rao, S.S. (ed), pp. 671-701, Butterworth-Heinemann. [7] Chapman, S.J. (2004) MATLAB Programming for Engineers, Thomson.
[8] Gilat, A. (2004) MATLAB: An introduction with Applications, John Wiley and Sons.
[9] Kelesoglu, O. and ülker, M. (2005) Fuzzy Optimization Geometrical Space Truss Design. Turkish Journal Engineering Environmental Science 29, 321-329. [10] Carlos, A. and Boulder, C., USA: Springer. (2004) The Direct Stiffness Method 1. Introduction to Finite Element Methods, Springer USA, Colorado. [11] Cazacu, R. and Grama, L. (2014) Steel Truss Optimization Using Genetic Algorithms and FEA. Procedia Technology 12, 339-346.
[12] Shreedhar, R. and Mamadapur, S. (2012) Analysis of T-beam Bridge Using Finite Element Method. International Journal of Engineering and Innovative Technology 2(3), 340-346.
[13] Ozbasaran, H. (2017) solveTruss v1.0: Static, global buckling and frequency analysis of 2D and 3D trusses with Mathematica. SoftwareX 6, 135-140. [14] Pavlou, D.G. (2015) Essentials of the Finite Element Method. Pavlou, D.G. (ed), pp. 81-133, Academic Press.
[15] Kale, R.F., Gore, N.G. and Salunke, P.J. (2014) Applications of Matlab in Optimization of Bridge Superstructures. International Journal of Research in Engineering and Technology 3(5), 34-39.
[16] RSTAB Software (2018) Structural frame a truss analysis software, https://www.dlubal.com/en/ products/rstab-beam-structures/what-is-rstab (Last Accessed on 10/06/2019).
AUTHOR
Mr. Sheikh Mosadiq Wakil is an M.Tech Scholar having specialization in Structural Engineering in Civil Engineering Department at BRCM College of Engineering & Technology, Bahal. His broad research area is Structural analysis and design. he has a keen interest in the development of new numerical and computation methods for structural analysis. He has expertise in STAAD Pro, ETAB, SAP2000 and MATLAB programming.