Optimization of Surface Roughness of AISI 304
Austenitic Stainless Steel in Turning Operation
Using Taguchi Method
Mr .Vishal C. Phalke1, Mr. Rohit N. Kumbhar2, Mr. Anup S. Sontakke3, Mr. Sedrick L. Bardeskar4, Ajay P. Dhawan5
1, 2, 3, 4
Students of Sanjay Ghodawat Institute, Atigre.
5
Assistant professor, Mechanical Engineering Department, Sanjay Ghodawat Group of Institutions, Kolhapur, Maharashtra, India.
Abstract: In this study, the Taguchi method is used to find the optimal cutting parameters for surface roughness in turning. The orthogonal array, the signal-to-noise ratio and analysis of variance (ANOVA) are employed to study the performance characteristics in turning operations of AISI 304 steel bars using CVD multilayer coated carbide tools. Three cutting parameters namely cutting speed, feed rate, and depth of cut are optimized with considerations of surface roughness. Experimental results are provided to illustrate the effectiveness of this approach.
Keywords: Austenitic stainless steel, Optimization, Taguchi method, S/N ratio, ANOVA.
I. INTRODUCTION
In the past two decades, the applications of stainless steel materials have increased enormously in various fields. The attractive combination of excellent corrosion resistance, a wide range of strength levels including strength retention at cryogenic and elevated temperatures, good formability, and an aesthetically pleasing appearance have made stainless steel materials of choice for a diverse range of applications, from critical piping components in boiling water nuclear reactors to the ubiquitous kitchen sink Stainless steels are known for their corrosion resistance along with better mechanical properties. At the same time, machinability is one cumbersome issue which is being discussed by the fabricators for a quite long period.
In relative terms to that of other alloy steels which is due to some reasons such as low heat conductivity, high built up edge tendency and high deformation hardening of most of the stainless steel varieties. Austenitic stainless steels, characterized by a high work hardened rate and low thermal conductivity, are used to fabricate chemical and food processing equipment, as well as machinery parts requiring high corrosion resistance.
Aspect such as Material Removal Rate, Surface Roughness, tool life, wear and cutting forces decide the productivity, product quality of machining. During machining heat will be produced near the edge of cutting tool. The amount of heat produced is depends on the type of material and machining parameters at high cutting speed. Increase in temperature directly influence on tool wear and flank wear properties and induce thermal damage to machining surface. All these conditions lead to low surface finish. Now a day’s achieving a good surface finish is the main challenge in the metal cutting industry during turning process. The present work is to investigate the effect of cutting parameters (speed, feed and depth of cut) in CNC turning of AISI 304 austenitic stainless steel to achieve low Surface Roughness using VNMG 160404 titanium carbide (TiC) insert.
In actual practice, there are many factors affect the surface roughness like cutting conditions (speed, feed rate and depth of cut), tool variables (tool material, nose radius, rake angle, cutting edge geometry, tool vibration, tool overhang, tool point angle etc.,) and work piece variables (material, hardness and other mechanical properties etc.). So, to achieve good surface finish, it’s necessary to select the most appropriate machining setting in order to improve cutting efficiency. Generally, this optimum parametric selection is determined by the operator’s experience or by design data books, but which leads to decrease in productivity due to sub optimal use of machining capabilities this causes an increase in machining cost and a decrease in quality. Hence statistical design of experiments and statistical/mathematical models are used for decreasing the machining cost and time. Statistical design of experiments refers to the process of planning the experiments so that the appropriate data can be analysed by statistical methods, resulting in valid conclusions. The Taguchi experimental design method is a one of the well-known, unique and powerful technique for product or process quality improvement. It is widely used for analysis of experiment and in optimization problems.
II. TAGUCHI METHOD
Taguchi has developed a methodology for the application of designed experiments, including a practitioner’s handbook this methodology has taken the design of experiments from the exclusive world of the statistician and brought it more fully into the world of manufacturing. His contributions have also made the practitioner work simpler by advocating the use of fewer experimental designs, and providing a clearer understanding of the variation nature and the economic consequences of quality engineering in the world of manufacturing. Taguchi introduces his approach, using experimental design for:
A. Designing products/processes so as to be robust to environmental Conditions;
B. Designing and developing products/processes so as to be Robust to component variation;
C. Minimizing variation around a target value.
The philosophy of Taguchi is broadly applicable. He proposed that engineering optimization of a process or product should be carried out in a three-step approach, i.e., system design, parameter design, and tolerance design.
In system design, the engineer applies scientific and engineering Knowledge to produce a basic functional prototype design, this design including the product design stage and the process design stage. In the product design stage, the selection of materials, components, tentative product parameter values, etc., are involved. As to the process design stage, the analysis of processing sequences, the selections of production equipment, tentative process parameter values, etc., are involved. Since system design is an initial functional design, it may be far from optimum in terms of quality and cost.
The objective of the parameter design is to optimize the settings of the process parameter values for improving performance characteristics and to identify the product parameter values under the optimal process parameter values.
In addition, it is expected that the optimal process parameter values obtained from the parameter design are insensitive to the variation of environmental conditions and other noise factors. Therefore, the parameter design is the key step in the Taguchi method to achieving high quality without increasing cost.
Basically, classical parameter design, developed by Fisher, is complex and not easy to use. Especially, a large number of experiments have to be carried out when the number of the process parameters increases. To solve this task, the Taguchi method uses a special design of orthogonal arrays to study the entire parameter space with a small number of experiments only. A loss function is then defined to calculate the deviation between the experimental value and the desired value. Taguchi recommends the use of the loss function to measure the performance characteristic deviating from the desired value. The value of the loss function is further transformed into a signal-to-noise (S/N) ratio ƞ. Usually; there are three categories of the performance characteristic in the analysis of the S/N ratio, that is, the lower-the-better, the higher-the-better, and the nominal-the-better. The S/N ratio for each level of process parameters is computed based on the S/N analysis. Regardless of the category of the performance characteristic, the larger S/N ratio corresponds to the better performance characteristic. Therefore, the optimal level of the process parameters is the level with the highest S/N ratio ƞ. Furthermore, a statistical analysis of variance (ANOVA) is performed to see which process parameters are statistically significant. With the S/N and ANOVA analyses, the optimal combination of the process parameters can be predicted. Finally, a confirmation experiment is conducted to verify the optimal process parameters obtained from the parameter design. In this paper, the cutting parameter design by the Taguchi method is adopted to obtain optimal machining performance in turning
1) Nominal is the best: S/N ratio = -10 log10 [ ]
2) Larger-the-better (maximize): S/N ratio = -10 log10 [ ]
3) Smaller-the-better (minimize): S/N ratio = -10log10 [ ]
Where Ya, is the average of observed data, S2y is the variance of y, Yi is the number of observations and the observed data.
Notice that these S/N ratios are expressed on a decibel scale. We would use Nominal is the best if the objective is to reduce variability around a specific target, Larger-the-better if the system is optimized when the response is as large as possible, and Smaller-the-better if the system is optimized when the response is as small as possible. Factor levels that maximize the appropriate S/N ratio are optimal. The goal of this research was to produce minimum surface roughness (Ra) in a turning operation. Smaller Ra values represent better or improved surface roughness. Therefore, a smaller-the-better quality characteristic was implemented and introduced in this study.
a) Select parameters and their levels;
b) Select Taguchi orthogonal array;
c) Conduct experiments and measure the response to
d) optimize;
e) Analyze results by using Signal-to-Noise ratio and ANOVA.
f) Identify optimum levels of parameters;
g) Confirm the effectiveness of optimization with a Confirmation test.
III. TURNING PROCESS EXPERIMENTS
Turning is a widely used machining process in which a single-point cutting tool removes material from the surface of a rotating cylindrical work piece. Three cutting parameters, i.e. cutting speed, feed rate, depth of cut must be determined in a turning operation. A common method of evaluating machining performance in a turning operation is based on the surface roughness. Basically, surface roughness is strongly correlated with cutting parameters such as cutting speed, feed rate, and depth of cut. Proper selection of the cutting parameters can obtain better surface roughness. Hence, optimization of the cutting parameters based on the parameter design of the Taguchi method is adopted in this paper to improve surface roughness in a turning operation.
A. Selection Of Cutting Parameters And Their Levels
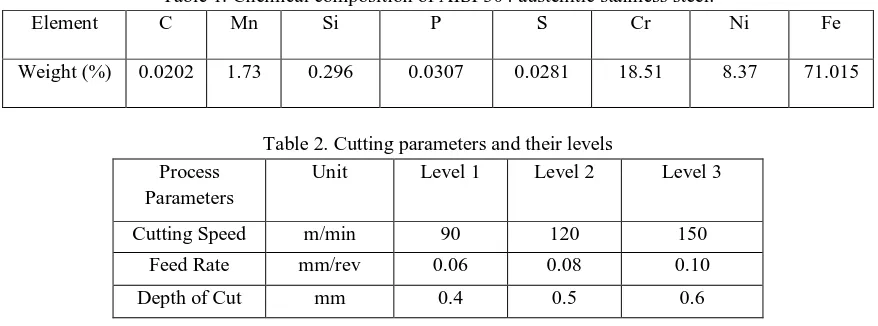
[image:3.612.87.526.383.546.2]The cutting experiments was carried out on an Max Turn Plus CNC lathe using TiC carbide coated insert for the machining of AISI 304 austenitic stainless steel bars. In the tests used inserts was VNMG 160404. Chemical composition of AISI 304 austenitic stainless steel which was used in the experiments as shown in Table 1 respectively. The feasible range for the cutting parameters was recommended by a machining handbook, i.e., cutting speed in the range 80 – 180 m/min, feed rate in the range 0.05 -0.2 mm/rev, and depth of cut in the range of 0.1 – 0.6 mm. Cutting parameters and their levels are shown in Table 2.
Table 1. Chemical composition of AISI 304 austenitic stainless steel.
Element C Mn Si P S Cr Ni Fe
Weight (%) 0.0202 1.73 0.296 0.0307 0.0281 18.51 8.37 71.015
Table 2. Cutting parameters and their levels Process
Parameters
Unit Level 1 Level 2 Level 3
Cutting Speed m/min 90 120 150
Feed Rate mm/rev 0.06 0.08 0.10
Depth of Cut mm 0.4 0.5 0.6
B. Machining performance measure
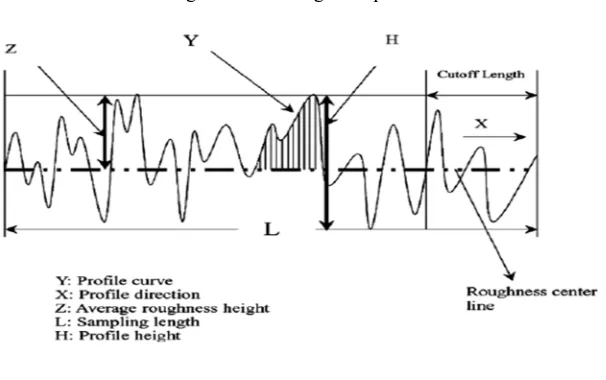
There are various simple surface roughness amplitude parameters used in industry, such as roughness average (Ra), root-mean-square (rms) roughness (Rq), and maximum peak-to-valley roughness (Ry or Rmax), etc. The parameter Ra is used in this study. The average roughness (Ra) is the area between the roughness profile and its mean line or the integral of the absolute value of the roughness profile height over the evaluation length (Fig. 1). Therefore, the Ra is specified by the following equation:
Ra = | ( )|
Where,
1) Ra is the arithmetic average deviation from the mean line.
2) L is the sampling length.
3) Y is the ordinate of the profile curve.
Fig.1. Surface roughness profile
IV. DETERMINATION of OPTIMAL CUTTING PARAMETERS
In order to optimize the surface roughness, we used the L9 Taguchi orthogonal array to conduct the experiments. Experimental combinations of the turning parameters and the measurement of surface roughness Ra are reported in Table 3. Experimental data was analyzed according to Taguchi Design by using Minitab 18, statistical analysis software widely exploited in many engineering optimizations.
In the Taguchi method, the term ‘signal’ represents the desirable value (mean) for the output characteristic and the term ‘noise’ represents the undesirable value for the output characteristic. Taguchi uses the S/N ratio to measure the quality characteristic deviating from the desired value. First, Signal to Noise S/N ratios were determined by with consideration of Lower-the-Better performance characteristic in terms of dB (decibel). We chose this characteristic because Ra value is requested to be low. The experimental values and their corresponding S/N ratios are listed in Table 3.
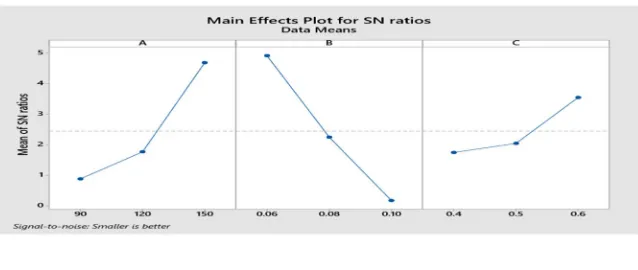
[image:4.612.157.460.87.277.2]Since the experimental design is orthogonal, it is then possible to separate out the effect of each cutting parameter at different levels. For example, the mean S/N ratio for the cutting speed at levels 1, 2 and 3 can be calculated by averaging the S/N ratios for the experiments 1–3, 4–6, and 7–9 respectively. Mean S/N ratios are presented in Table 4 and their main effects plot are shown in Fig. 2.
Table 3. Experimental Results for Surface Roughness and S/N Ratio. Experiment
Number
Cutting Speed (m/min)
Feed Rate (mm/rev)
Depth of Cut (mm)
Surface Roughness (µm)
S/N Ratio (dB)
1 90 0.06 0.4 0.801 1.9273
2 90 0.08 0.5 0.950 0.4455
3 90 0.10 0.6 0.968 0.2826
4 120 0.06 0.5 0.602 4.4081
5 120 0.08 0.6 0.799 1.9490
6 120 0.10 0.4 1.127 -1.0383
7 150 0.06 0.6 0.379 8.4284
8 150 0.08 0.4 0.605 4.3651
9 150 0.10 0.5 0.862 1.2901
Table 4. S/N Response Table for Surface Roughness Symbol Process
Parameters
Mean S/N Ratio (dB)
Level 1 Level 2 Level 3 A Cutting speed 0.8851 1.7729 4.6940
Regardless of the type of the performance characteristic, a large S/N ratio means it is close to good quality. Then, a higher value of the S/N ratio is desirable.
From the Table 4 and Fig. 2 we select optimal process parameters for minimum surface roughness’s are as following:
1) Cutting Speed : 150 m/min
2) Feed rate : 0.06 mm/rev
[image:5.612.146.465.171.306.2]3) Depth of cut : 0.6 mm
Fig. 2. Main Effects Plot for S/N ratios.
V. ANALYSIS of VARIANCE
The purpose of the ANOVA is to investigate which of the process parameters significantly affect the performance characteristics. This is accomplished by separating the total variability of the S/N ratios, which is measured by the sum of the squared deviations from the total mean of the S/N ratio, into contributions by each of the process parameters and the error. First, the total sum of the squared deviations SST from the total mean of the S/N ratio ƞ can be calculated as:
SST = ∑ (ƞ − ƞ )
Where n is the number of experiments in the orthogonal array andƞ is the S/N ratio for the ith experiment and ƞ is the mean of S/N ratio.
[image:5.612.119.498.459.582.2]The total sum of the squared deviations SST is decomposed into two sources: the sum of the squared deviations SSb due to each process parameter and the sum of the squared error SSe.
Table 5. Results of the ANOVA for Surface Roughness Symbol Process
Parameters
Degrees of freedom
Sum of squares
Mean square
F Contribution (%) A Cutting speed 2 23.83 11.91 9.33 36.11
B Feed rate 2 34 17 13.32 51.52
C Depth of cut 2 5.60 2.80 2.19 8.48
Error 2 2.56 1.28 3.89
Total 8 65.99 100
VI. CONFIRMATION TESTES
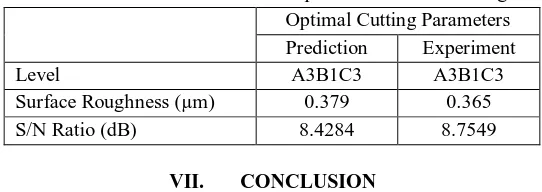
Once the optimal level of the process parameters is selected, the final step is to predict and verify the improvement of the performance characteristic using the optimal level of the process parameters. The estimated S/N ratio ƞ^ using the optimal level of the process parameters can be calculated as:
ƞ^ =ƞ + (ƞ − ƞ )
Where ƞm is the total mean of the S/N ratio, ƞim, is the mean S/N ratio at the optimal level, and c is the number of the process
parameters that significantly affect the performance characteristic.
Table 6. Results of the confirmation experiment for surface roughness Optimal Cutting Parameters Prediction Experiment
Level A3B1C3 A3B1C3
Surface Roughness (µm) 0.379 0.365 S/N Ratio (dB) 8.4284 8.7549
VII. CONCLUSION
In this paper, Taguchi Design of Experiments was applied to obtain the optimal process parameters for minimum surface roughness. For our optimization, we selected three process parameters: Cutting speed, feed rate, depth of cut. For each parameter, we selected three levels.
Experiments were conducted using L9 orthogonal array. For each experiment, surface roughness was measured, recorded and analyzed using Taguchi S/N ratios. These ratios were calculated with consideration of performance characteristic: Lower-the- Better, as surface roughness is requested to be low. The optimum levels of parameters for minimizing the surface roughness were determined from the response table for Signal-to-Noise ratios. The best combination was obtained with:
A. Cutting speed of 150 m/min.
B. Feed rate of 0.06 mm/rev.
C. Depth of cut of 0.6 mm.
The ANOVA result shows the influence of process parameters to achieve minimum surface roughness value. The influence of process parameters are as follows:
1) Feed has high influence (51.52 %)
2) Speed (36.11%)
3) Depth of cut has low influence (8.48 %).
This research demonstrates how to use Taguchi parameter design for optimizing machining performance with minimum cost and time to industrial readers.
REFERENCE [1] Taguchi G. Introduction to quality engineering. Tokyo: Asian Productivity Organization; 1990. [2] Ross PJ. Taguchi techniques for quality engineering. New York: McGraw-Hill; 1988.
[3] D. Selvaraj and P.Chandarmohan, “Optimization of Surface Roughness of AISI304 Austenitic Stainless Steel in Dry Turning Operation Using Taguchi Design Method”, Journal of Engineering Science and Technology, vol. 5, no.3, (2010), pp.293-301.
[4] M. Nalbant *, H. Go¨kkaya, G. Sur “Application of Taguchi method in the optimization of cutting parameters for surface roughness in turning.” Department of Mechanical Education, Faculty of Technical Education, Gazi University, 06503 Teknikokullar, Ankara, Turkey Received 21 July 2005; accepted 6 January 2006 Available online 24 March 2006
[5] Ch. Maheswara Rao1 and K.Venkatasubbaiah2 “Optimization of Surface Roughness in CNC Turning Using Taguchi Method and ANOVA.” 1Assistant Professor, Department of Mechanical Engineering, Raghu Institute of Technology, Visakhapatnam, India 2Professor, Department of Mechanical Engineering, Andhra University, Visakhapatnam, India.
[6] “Optimization of turning parameters for surface roughness.” DAHBI Samya, EL MOUSSAMI Haj Research Team: Mechanics and Integrated Engineering ENSAM-Meknes, Moulay Ismail University Meknes, Morocco.
[7] Production Technology (HMT Bangalore). V. V. Arabatti; T. P. S. Lyer; L. V. Raju. McGraw Hill Education (India) Pvt. Ltd. (36th Ed.) Manufacturing Processes for Engineering Materials. Serope Kalpakjian; Steven R. Schmid, Dorling Kindersley (India) Pvt. Ltd. (5th Ed.)
[8] W. Chen, “Cutting forces and surface finish when machining medium hardness steel using CBN tools,” International Journal of Machine Tools Manufacturing, vol. 40, 2000, pp. 455-466.