Strategies for New Applications:
Empirical Methods for Optimization
from Small Data Sets
Verena Rieser
∗School of GeoSciences/University of Edinburgh
Oliver Lemon
∗∗School of Mathematical and Computer Sciences/Heriot-Watt University
We present a new data-driven methodology for simulation-based dialogue strategy learning, which allows us to address several problems in the field of automatic optimization of dialogue strategies: learning effective dialogue strategies when no initial data or system exists, and determining a data-driven reward function. In addition, we evaluate the result with real users, and explore how results transfer between simulated and real interactions. We use Reinforce-ment Learning (RL) to learn multimodal dialogue strategies by interaction with a simulated environment which is “bootstrapped” from small amounts of Wizard-of-Oz (WOZ) data. This use of WOZ data allows data-driven development of optimal strategies for domains where no working prototype is available. Using simulation-based RL allows us to find optimal policies which are not (necessarily) present in the original data. Our results show that simulation-based RL significantly outperforms the average (human wizard) strategy as learned from the data by using Supervised Learning. The bootstrapped RL-based policy gains on average 50 times more reward when tested in simulation, and almost 18 times more reward when interacting with real users. Users also subjectively rate the RL-based policy on average 10% higher. We also show that results from simulated interaction do transfer to interaction with real users, and we explicitly evaluate the stability of the data-driven reward function.
1. Introduction
Statistical learning approaches, such as Reinforcement Learning (RL), for Spoken Dia-logue Systems offer several potential advantages over the standard rule-based hand-coding approach to dialogue systems development: a data-driven development cycle,
∗Centre for Environmental Change and Sustainability, School of GeoSciences, Drummond Street, Edinburgh EH89XP, UK. E-mail:[email protected].
∗∗The Interaction Lab, School of Mathematical and Computer Sciences (MACS), Heriot-Watt University, Edinburgh EH14 4AS, UK. E-mail:[email protected].
provably optimal action policies, a precise mathematical model for action selection, pos-sibilities for generalization to unseen states, and automatic optimization of competing trade-offs in the objective function. See Young (2000), Lemon and Pietquin (2007), and Frampton and Lemon (2009) for an introduction to dialogue strategy learning.
One of the major limitations of this approach is that it relies on a large quantity of data being available. In cases when a fixed data set is used for learning (e.g., Walker 2000; Singh et al. 2002; Henderson, Lemon, and Georgila 2008), the optimal policy can only be discovered when it is present in the data set. (Note, by a policy being “present in a data set” we mean that the set of state-action mappings which define the policy is contained in that data set. When a policy is not present in a data set, either some states covered by the policy are not seen at all in that data, or the actions chosen by the policy in some states are different to those seen in the data.) To overcome this problem, simulated learning environments are being used to explore optimal policies which were previously unseen in the data (e.g., Eckert, Levin, and Pieraccini 1997; Ai, Tetreault, and Litman 2007; Young et al. 2009). However, several aspects of the components of this simulated environment are usually hand-crafted, and thus limit the scope of policy learning. In particular, the optimization (or reward) function is often manually set (Paek 2006). In order to build simulation components from real data, annotated in-domain dialogue corpora have to be available which explore a range of dialogue management decisions. Collecting dialogue data without a working prototype is problematic, leaving the developer with a classic “chicken-or-egg” problem.
We therefore propose to learn dialogue strategies using simulation-based RL, where the simulated environment is learned from small amounts of Wizard-of-Oz (WOZ) data. In a WOZ experiment, a hidden human operator, the so-called “wizard,” simulates (partly or completely) the behavior of the application, while subjects are left in the belief that they are interacting with a real system (Fraser and Gilbert 1991).
In contrast to preceding work, our approach enables strategy learning in domains where no prior system is available. Optimized learned strategies are then available from the first moment of on-line operation, and handcrafting of dialogue strategies is avoided. This independence from large amounts of in-domain dialogue data allows researchers to apply RL to new application areas beyond the scope of existing dialogue systems. We call this method “bootstrapping.”
In addition, our work is the first using a data-driven simulated environment. Previ-ous approaches to simulation-based dialogue strategy learning usually handcraft some of their components.
Of course, some human effort is needed in developing the WOZ environment and annotating the collected data, although automatic dialogue annotation could be ap-plied (Georgila et al. 2009). The alternative—collecting data using hand-coded dialogue strategies—would still require annotation of the user actions, and has the disadvantage of constraining the system policies explored in the collected data. Therefore, WOZ data allows exploration of a range of possible strategies, as intuitively generated by the wizards, in contrast to using an initial system which can only explore a pre-defined range of options.
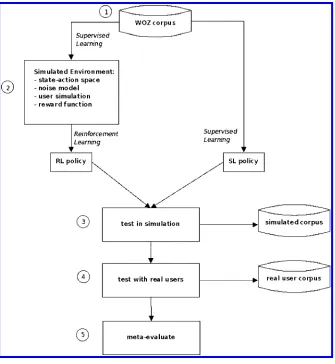
The use of WOZ data has earlier been proposed in the context of RL. Williams and Young (2004) use WOZ data to discover the state and action space for the design of a Markov Decision Process (MDP). Prommer, Holzapfel, and Waibel (2006) use WOZ data to build a simulated user and noise model for simulation-based RL. Although both studies show promising first results, their simulated environments still contain many hand-crafted aspects, which makes it hard to evaluate whether the success of the learned strategy indeed originates from the WOZ data. Schatzmann et al. (2007) propose to “bootstrap” with a simulated user which is entirely hand-crafted. In the following we propose what is currently the most strongly data-driven approach to these problems. We also show that the resulting policy performs well for real users. In particular we propose a five-step procedure (see Figure 1):
1. We start by collecting data in a WOZ experiment, as described in Section 2. 2. From these data we train and test different components of our simulated
[image:3.486.53.388.277.641.2]environment using Supervised Learning techniques (Section 3). In
Figure 1
particular, we extract a supervised policy, reflecting human (wizard) performance on this task (see Section 3.3). We build a noise simulation (Section 3.4), and two different user simulations (Section 3.5), as well as a data-driven reward function (Section 3.6).
3. We then train and evaluate dialogue policies by interacting with the simulated environment (Section 4).
4. Once the learned policies are “good enough” in simulation, we test them with real users (Section 5).
5. In addition, we introduce a final phase where we meta-evaluate the whole framework (Section 6). This final step is necessary because WOZ
experiments onlysimulatehuman–computer interaction (HCI). We therefore need to show that a strategy bootstrapped from WOZ data indeed transfers to real HCI. We first show that the results between simulated and real interaction are compatible (Section 6.1). We also meta-evaluate the reward function, showing that it is a stable, accurate estimate for real user’s preferences (Section 6.2).
Note that RL is fundamentally different to Supervised Learning (SL): RL is a statisti-cal planning approach which allows us to find an optimal policy (sequences of actions) with respect to an overall goal (Sutton and Barto 1998); SL, in contrast, is concerned with deducing a function from training data for predicting/classifying events. This article is not concerned with showing differences between SL and RL on a small amount of data, but we use SL methods to capture the average human wizard strategy in the original data, and show that simulation-based RL is able to find new policies that were previously unseen.
We apply this framework to optimize multimodal information-seeking dialogue strategies for an in-car digital music player. Dialogue Management and multimodal output generation are two closely interrelated problems for information seeking dia-logues: the decision of when to present information depends on how many pieces of information to present and the available options forhowto present them, and vice versa. We therefore formulate the problem as a hierarchy of joint learning decisions which are optimized together. We see this as a first step towards an integrated statistical model of Dialogue Management and more advanced output planning/Natural Language Gener-ation (Lemon 2008; Rieser and Lemon 2009b; Lemon 2011; Rieser, Lemon, and Liu 2010; Janarthanam and Lemon 2010).
In the following, Section 2 describes the Wizard-of-Oz data collection (i.e., how to collect appropriate data when no initial data or system exists), Section 3 explains the construction of the simulated learning environment (including how to determine a data-driven reward function), Section 4 presents training and evaluation of the learned policies in simulation (i.e., how to learn effective dialogue strategies), Section 5 presents the results of the tests with real users, and Section 6 presents a meta-evaluation of the framework, including transfer results.
2. Wizard-of-Oz Data Collection
in the larger context of the TALK project1 and is also known as the SAMMIE corpus (Kruijff-Korbayov´a et al. 2006). In contrast to conventional WOZ trials we were not only interested in the users’ behavior, but also in the behavior of our human wizards. This study provides insights into natural strategies of information presentation as performed by human wizards.
2.1 Experimental Setup
Six people played the role of an intelligent interface (the “wizards”). The wizards were able to speak freely and display search results on the screen by clicking on pre-computed templates. Wizards’ outputs were not restricted, in order to explore the different ways they intuitively chose to present search results. Wizard’s utterances were immediately transcribed and played back to the user with Text-To-Speech. Twenty-one subjects (11 women, 10 men) were given a set of predefined tasks to perform, as well as a primary driving task, using a driving simulator (Mattes 2003). The users were able to speak, as well as make selections on the screen.
The experiment proceeded as follows. First the wizards were trained to use the database interface and they were also given general instructions about how to interact with the user. Training took 45 minutes, including five example tasks.
After the user arrived s/he was introduced to the driving simulator and had to perform a short test drive. The users solved two sets of tasks with two tasks in each. After each task the user filled out a task-specific questionnaire, in which they indicated perceived task success and satisfaction on a five-point Likert scale. Finally, the user was interviewed by the experiment leader following a questionnaire containing questions similar to thePARADISEstudy (Walker, Kamm, and Litman 2000), including questions on task ease, timing, multimodal and verbal presentation, as well as future use of such systems. All subjects reported that they were convinced that they were interacting with a real system.
To approximate speech recognition errors we used a tool that randomly deletes parts of the transcribed utterances. Due to the fact that humans are able to make sense of even heavily corrupted input, this method not only covers non-understandings, but wizards also built up their own hypotheses about what the user really said, which can lead to misunderstandings. The word deletion rate varied: 20% of the utterances were weakly corrupted (= deletion rate of 20%), and 20% were strongly corrupted (= deletion rate of 50%). In 60% of the cases the wizard saw the transcribed speech uncorrupted. Example (1) illustrates the kind of corrupted utterances the wizard had to deal with.
(1) uncorrupted: “Zu dieser Liste bitte Track ‘Tonight’ hinzuf ¨ugen.” [ “Add track ‘Tonight’ to this list.”]
weakly corrupted: “Zu dieser Liste bitte Track ‘Tonight’ . . . . ” [“. . . track ‘Tonight’ to this list.”]
strongly corrupted: “Zu . . . Track ‘Tonight’ . . . . [“. . . track ‘Tonight’ to . . . ”]
There are some shortcomings of this technique, which we discuss in Rieser and Lemon (2009a). However, the data are useful for our purposes because our main interest
here is in multimodal presentation strategies (in the presence of some input noise). Other studies have specifically targeted the Dialogue Management question of how to handle ASR input noise (e.g., Stuttle, Williams, and Young 2004; Skantze 2005).
2.2 Data Collected
The corpus gathered with this set-up comprises 21 sessions and over 1,600 turns. Some example dialogues can be found in Appendix B. Example (2) shows a typical multi-modal presentation sub-dialogue from the corpus (translated from German). Note that the wizard displays quite a long list of possible candidates on an (average sized) com-puter screen, while the user is driving. This example illustrates that even for humans it is difficult to find an “optimal” solution to the problem we are trying to solve.
(2) User: “Please search for music by Bj ¨ork.”
Wizard: “I found 43 items. The items are displayed on the screen.”
[displays list]
User: “Please select Human Behaviour.”
Information was logged for each session, for example, the transcriptions of the spoken utterances, the wizard’s database query and the number of results, and the screen option chosen by the wizard. A rich set of contextual dialogue features was also annotated, as listed in Section 3.1. Also see Rieser, Kruijff-Korbayov´a, and Lemon (2005).
Of the 793 wizard turns 22.3% were annotated as presentation strategies, re-sulting in 177 instances for learning, where the six wizards contributed about equal proportions.
Aχ2 test on presentation strategy (comparing whether wizards chose to present in multimodal or verbal modality) showed significant differences between wizards (χ2(1)=34.21, p < .001). On the other hand, a Kruskal-Wallis test comparing user preferences for the multimodal output showed no significant difference across wizards (H(5)=10.94, p>.05).2Mean performance ratings for the wizards’ multimodal behavior ranged from 1.67 to 3.5 on a five-point Likert scale. We also performed an analysis of whether wizards improved their performance over time (learning effects). The results show that the wizard’s average user satisfaction scores in general slightly decreased with the number of sessions that they performed, however.
Observing significantly different strategies that are not significantly different in terms of user satisfaction, we conjecture that the wizards converged on strategies which were appropriate in certaincontexts. To strengthen this hypothesis we split the data by wizard and performed a Kruskal-Wallis test on multimodal behavior per session. Only the two wizards with the lowest performance score showed no significant variation across session, whereas the wizards with the highest scores showed the most varying behavior. These results again indicate a context-dependent strategy.
In Section 3.1 we test this hypothesis (that good multimodal clarification strate-gies are context-dependent) by using feature selection techniques in order to find the
features which are most predictive for the wizards’ behavior. The dialogues show that common “mistakes” were that the wizards either displayed too much information on the screen, see Example (1) in Appendix B, or the wizards fail to present results early enough, see Example (2) in Appendix B. In general, users report that they get distracted from driving if too much information is presented. On the other hand, users prefer shorter dialogues (most of the user ratings are negatively correlated with dialogue length).
These results indicate that we need to find a strategy given the competing trade-offs between the number of results (large lists are difficult for users to process), the length of the dialogue (long dialogues are tiring, but collecting more information can result in more precise results), and the noise in the speech recognition environment (in high noise conditions accurate information is difficult to obtain). In the following we utilize the ratings from the user questionnaires to optimize a presentation strategy using simulation-based RL.
3. Simulated Learning Environment
Simulation-based RL learns by interaction with a simulated environment (Sutton and Barto 1998). We obtain the simulated components from the WOZ corpus using data-driven methods. Although this requires quite a large effort, the exercise is important as a case study for exploring the proposed methodology.
The employed database contains 438 items and is similar in retrieval ambiguity and structure to the one used in the WOZ experiment. The dialogue system used for learning implements a multimodal information presentation strategy which is untrained, but comprises some obvious constraints reflecting the system logic (e.g., that only filled slots can be confirmed), implemented as Information State Update (ISU) rules (see also Heeman 2007; Henderson, Lemon, and Georgila 2008).
Other behavior which is hand-coded in the system is to greet the user in the beginning of a dialogue and to provide help if the user requests help. The help function provides the user with some examples of what to say next (see system prompts6 in the Example Dialogue in Table 1 in Appendix D). All other actions are left for optimization.
3.1 Feature Space
A state or context in our system is a dialogue “information state” as defined in (Lemon et al., 2005). We divide the types of information represented in the dialogue information state intolocal features(constituting low-level and dialogue features),dialogue history features, anduser model features. We also defined features reflecting the application environment (e.g., driving). The information state features are shown in Tables 1, 2, and 3, and further described below. All features are automatically extracted from the WOZ log-files (as described in Section 2.2), and are available at runtime in ISU-based dialogue systems.
Local features. First, we extracted features present in the “local” context of a wizard
Table 1
Contextual/information-state features: Local features. Local features
DB: database matches (integer) deletion: words deleted (yes/no) user-act: add, repeat, y/n, change, others
user actions are annotated manually by two annotators (κ=.632). Please see Table 1 in Appendix A for detailed results on inter-annotator agreement.
Also, note that thedeletionfeature (and laterdelHist, anddelUser) counts the number of words deleted by the corruption tool (see Section 2.1) and serves as an approximation to automatic speech recognition (ASR) confidence scores as observed by the system. Equally, the human wizard will be able to infer when words in a sentence were deleted and hence has a certain confidence that the input is complete.
Dialogue history features.The history features account for events in the whole dialogue
so far, that is, all information gathered before entering the presentation phase, as shown in Table 2. We include features such as the number of questions that the wizard asked so far (questHist), how often the screen output was already used (screenHist), the average corruption rate so far (delHist), the dialogue length measured in turns (dialogueLength), the dialogue duration in seconds (dialogueDuration), and whether the user reacted to the screen output, either by verbally referencing (refHist), for example, using expressions such asIt’s item number 4, or by clicking (clickHist).
User model features.Under “user model features” we consider features reflecting the
wiz-ards’ responsiveness to the behavior and situation of the user. Each session comprises four dialogues with one wizard. The user model features average the user’s behavior in these dialogues so far, as shown in Table 3, such as how responsive the user is towards the screen output, namely, how often this user clicks (clickUser) and how frequently s/he used verbal references so far (refUser); how often the wizard had already shown a screen output (screenUser) and how many questions were already asked (questUser); how much the user’s speech was corrupted on average so far (delUser), that is, an approximation of how well this user is recognized; and whether this user is currently driving or not (driving). This information was available to the wizards.
Table 2
Contextual/information-state features: History features. Dialogue History Features
questHist: number of questions (integer) screenHist: number screen outputs (integer) delHist: average corruption rate;no.wordsDeletedInDialogueSoFar
no.utterancesInDialogueSoFar (real)
dialogueLength: length in turns (integer) dialogueDuration: time in sec (real)
Table 3
Contextual/information-state features: User model features. User model features
clickUser: average number of clicks (real)
refUser: average number of verbal references (real)
delUser: average corruption rate for that user;no.wordsDeletedForUserSoFar no.utterancesForUserSoFar (real) screenUser: average number of screens shown to that user (real) questUser: average number of questions asked to user (real) driving: user driving (yes/no)
Note that all these features are generic over information-seeking dialogues where database results can be displayed on a screen; except fordrivingwhich only applies to hands-and-eyes-busy situations. This potential feature space comprises 16 features, many of them taking numerical attributes as values. Including them all in the state space for learning would make the RL problem unnecessarily complex. In the next section we describe automatic feature selection techniques, which help to reduce the feature space to a subset which is most predictive ofwhenandhowto present search results.
3.1.1 Feature Selection.We use feature selection techniques to identify the context features
which are most predictable for the wizards choosing a specific action. We choose to apply forward selection for all our experiments in order to not include redundant features, given our large feature set. We use the following feature filteringmethods: correlation-based subset evaluation (CFS; Hall 2000) and a decision tree algorithm (rule-based SL). We also apply a correlation-(rule-basedχ2rankingtechnique. Filtering techniques account for inter-feature relations, selecting subsets of predictive features at the expense of saying less about individual feature performance itself. Ranking techniques evaluate each feature individually. For our experiments we use implementations of selection techniques provided by theWEKAtoolkit (Witten and Frank 2005).
First, we investigated the wizards’ information acquisition strategy, namely, which features are related to the wizards’ decisionwhento present a list (presentInfo)—that is, the task is to predict presentInfovs. all other possible dialogue acts. None of the feature selection techniques were able to identify any predictive feature for this task.
Next, we investigated the wizards’ information presentation strategy, that is, which features are related to the wizards’ decision to present a list verbally (presentInfo-verbal) or multi-modally (presentInfo-multimodal). All the feature selection tech-niques consistently choose the featureDB(number of retrieved items from the database). This result is maybe not very surprising, but it supports the claim that using feature selection on WOZ data delivers valid results. Relevant features for other domains may be less obvious. For example, Levin and Passonneau (2006) suggest the use of WOZ data in order to discover the state space for error recovery strategies. For this task many other contextual features may come into play, as shown by Gabsdil and Lemon (2004) and Lemon and Konstas (2009) for automatic ASR re-ranking.
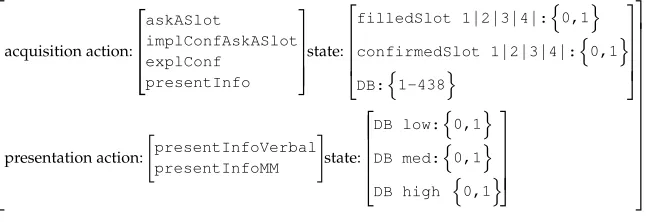
Figure 2
State-action space for hierarchical Reinforcement Learning.
3.2 MDP and Problem Representation
The structure of an information-seeking dialogue system consists of an information acquisition phase, and an information presentation phase. For information acquisition the task of the dialogue manager is to gather “enough” search constraints from the user, and then, “at the right time,” to start the information presentation phase, where the pre-sentation task is to present “the right amount” of information in the right way—either on the screen or listing the items verbally. What “the right amount” actually means depends on the application, the dialogue context, and the preferences of users. For optimizing dialogue strategies information acquisition and presentation are two closely interrelated problems and need to be optimized jointly:When to present information depends on the available options forhowto present them, and vice versa.
We therefore formulate the problem as an MDP, relating states to actions in a hierar-chical manner (see Figure 2): Four actions are available for the information acquisition phase; once the action presentInfo is chosen, the information presentation phase is entered, where two different actions for output realization are available.
The state space is constructed semi-automatically. We manually enumerate the task-related features needed to learn about the dialogue task. For example, we manually specified the number of slots, and information about the “grounded-ness” of the slots, needed to learn confirmation strategies.3We also added the features which were auto-matically discovered by the feature selection techniques defined in Section 3.1.1.
The state-space comprises eight binary features representing the task for a four-slot problem: filledSlot indicates whether a slot is filled, confirmedSlot indicates whether a slot is confirmed. We also add the number of retrieved items (DB). We found that human wizards especially pay attention to this feature, using the feature selection techniques of Rieser and Lemon (2006b). The feature DBtakes integer values between 1 and 438, resulting in 28×438=112, 128 distinct dialogue states for the state space. In total there are 4112,128theoretically possible policies for information acquisition.4For
3 Note that we simplified the notion of a slot being grounded as a binary feature, following Henderson, Lemon, and Georgila (2008). More recent work uses more fine-grained notions of confidence in user-provided information (e.g., Roque and Traum 2008), or the notion of “belief states” in Partially Observable Markov Decision Processes (e.g., Williams and Young 2007). This does lead to new policies in information acquisition, but is not the focus of this article.
the presentation phase theDBfeature is discretized, as we will further discuss in Section 3.7. For the information presentation phase there are 223=256 theoretically possible policies.
3.3 Wizard Behavior
Our hypothesis is that simulation-based RL allows us to find optimal policies which are superior to those present in the original data. Therefore we create a policy which mimics the average wizard behavior, and this allows us to measure the relative improvements over the training data (cf. Henderson, Lemon, and Georgila 2008). We create this base-line by applying SL. For these experiments we use theWEKAtoolkit (Witten and Frank 2005). We learn with the decision tree J4.8 classifier,WEKA’s implementation of the C4.5 system (Quinlan 1993), and rule induction JRIP, the WEKA implementation ofRIPPER
(Cohen 1995). In particular, we learn models which predict the following wizard actions:
r
Presentation timing:whenthe “average” wizard starts the presentationphase on a turn level (binary decision).
r
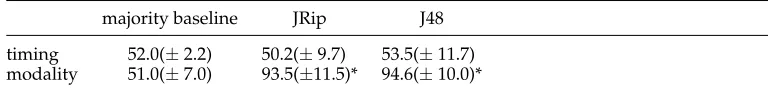
Presentation modality: inwhich modalitythe list is presented (multimodal vs. verbal).We use annotated dialogue context features as input, as described in Section 3.1, with feature selection techniques as described in Section 3.1.1. Both models are trained using 10-fold cross validation, comparing the predicted labels against the true labels in a hold-out test set. Table 4 presents the results for comparing the accuracy of the learned classifiers against the majority baseline.
A data analysis shows that all of the wizards are more likely to show a graphic on the screen when the number of database hits is≥4. However, none of the wizards strictly follows that strategy.
For presentation timing, none of the classifiers produces significantly improved results. Hence, we conclude that there is no distinctive pattern observable by the SL algorithms forwhento present information. For strategy implementation we therefore use a frequency-based approach following the distribution in the WOZ data: In 48% of cases the baseline policy decides to present the retrieved items; for the rest of the time the system follows a hand-coded strategy.
[image:11.486.51.435.601.646.2]For learning presentation modality, both classifiers significantly outperform the ma-jority baseline. The learned models both learn the same rule set, which can be rewritten as in Listing 1. Note that this rather simple algorithm is meant to represent the average strategy as learned by SL from the initial data (which then allows us to measure the relative improvements of the RL-based strategy).
Table 4
Predicted accuracy for presentation timing and modality (with standard deviation±). majority baseline JRip J48
Listing 1
Supervised Strategy i f( db<4){
r e t u r n p r e s e n t I n f o V e r b a l ;} e l s e{
r e t u r n presentInfoMM ;}
3.4 Noise Simulation
One of the fundamental characteristics of HCI is an error-prone communication chan-nel. Therefore, the simulation of channel noise is an important aspect of the learn-ing environment. Previous work uses data-intensive simulations of ASR errors (e.g., Pietquin and Dutoit 2006; Schatzmann, Thomson, and Young 2007a). Because we only have limited data available, we use a simple model simulating the effects of non- and misunderstanding on the interaction, rather than the noise itself. This method is espe-cially suited to learning from small data sets. From our data we estimate a 30% chance of user utterances to be misunderstood, and 4% to be complete non-understandings, which is a realistic estimation for deployed dialogue systems (cf. Litman and Pan 1999; Carpenter et al. 2001; Hirschberg, Litman, and Swerts 2001; Georgila, Henderson, and Lemon 2005).
We simulate theeffectsthat noise has on the user behavior, as well as for the task accuracy.5For the user side, the noise model defines the likelihood of the user accepting or rejecting the system’s hypothesis (e.g., when the system utters a confirmation), that is, in 30% of the cases the user rejects, in 70% the user agrees. These probabilities are combined with the probabilities for user actions from the user simulation, as described in the next section. For non-understandings we have the user simulation generating Out-of-Vocabulary utterances with a chance of 4%. Furthermore, the noise model deter-mines the likelihood of task accuracy as calculated in the reward function for learning. A filled slot which is not confirmed by the user has a 30% chance of having been mis-recognized, see Task Completion as defined in Section 3.6.
3.5 User Simulation
A user simulation is a predictive model of real user behavior used for automatic di-alogue strategy development and testing. See Schatzmann et al. (2006) for a compre-hensive survey. Simulations on the intention/dialogue act level are most popular for RL-based strategy learning, as they outperform the lower level approaches in terms of robustness, portability, and scalability. For our domain, the user can either add new information (add), repeat or paraphrase information which was already provided at an earlier stage (repeat), give a simple yes/no answer (y/n), or change to a different topic by providing a different slot value than the one asked for (change). Examples from the corpus are given in Table 5 and in the dialogues listed in Appendix B. These actions are annotated manually by two annotators (κ=.632, see Appendix A).
Table 5
User action types and frequencies as annotated in the data.
# action type freq % example (original) translation 1 add 54 30.5 ¨ah, Ella Fitzgerald. er, Ella Fitzgerald.
3 repeat 57 32.2 ja, Smile ja. yes, Smile yes.
2 y/n 14 7.9 ja, in Ordnung. yes, that’s OK. 4 change 17 9.6 dann machen wir was anderes
und zwar h¨atte ich gern eine Playlist mit drei Liedern.
Let’s try something else then. I would like a playlist with three songs.
others 35 19.8 — no answer, comment, aside
In this work, we are challenged to learn user simulations from a small data set. We first construct a simple bigram model in order to explore the quality of the data. Bigram (or more generaln-gram) models for user simulations were first introduced by Eckert, Levin, and Pieraccini (1997, 1998). Ann-gram–based user simulation predicts the user actionau,tat timetthat is most probable given the dialogue history of system and user actions, see Equation (1) whereas,tdenotes the system action at timet.
au,t=argmaxau,tP(au,t|as,t,as,t−1,au,t−1,...,au,t−n+1,as,t−n+1) (1)
The bigram model obtained from our WOZ data and the observed frequencies are shown in Figure 3. When examining the distributions of user replies per system turn for the bigram model, we can see that 25% of the state–action pairs have zero frequencies. However, user simulations should allow the learner to also find strategies which are not in the data. Especially when learning from small data sets, user simulations for
Figure 3
[image:13.486.51.307.427.638.2]automatic strategytrainingshould cover the whole variety of possible user action for each state in order to produce robust strategies. Ai, Tetreault, and Litman (2007), for example, show that random models outperform more accurate ones if the latter fail to provide enough coverage. On the other hand, user simulations used fortestingshould be more accurate with respect to the data in order to test under realistic conditions (e.g., M ¨oller et al. 2006).
We therefore apply two learning methods to deal with data sparsity (for n-gram models): First, we develop a user simulation which is based on a new clustering tech-nique; second, we apply smoothing (which is the standard technique applied to account for zero frequencies inn-gram models).
3.5.1 Cluster-Based User Simulation.We introduce a cluster-based technique for building
user simulations from small amounts of data (see also Rieser and Lemon 2006a). A sim-ilar approach has later been suggested by Schatzmann, Thomson, and Young (2007b), called the “summary-space mapping technique,” where similar states are summarized, and a distribution of possible user behavior is assigned to a set of states, which we call “clusters.” This method allows one to generate the full range of possible user behavior in every state.
Cluster-based user simulations generate explorative user behavior which is similar but not identical to user behavior observed in the original data. In contrast to the bigram model, where the likelihood of the next user act is conditioned on the previous system action, the likelihood for the cluster-based model is conditioned on a cluster of similar system states (see Equation (2)).
au,t≈argmaxau,tP(au,t|clusters,t−1) (2)
The underlying idea is that, with sparse training data, we want user simulations to be “similar to real users in similar situation.” This user simulation should generate any kind of observed user behavior in a context (as opposed to the zero frequencies for sparse data), while still generating behavior which is pragmatically plausible in this sit-uation. That is, we want our user simulation to generate behavior which iscompleteand
consistentwith respect to the observed actions in the data. We also want our model to
generate actions which show somevariabilitywith respect to the observed behavior, that is, a controlled degree of randomness. This variance will help us to explore situations which are not observed in the data, which is especially valuable when building a model from sparse training data (cf. Ai, Tetreault, and Litman 2007).
Clustering is applied in order to identify more general situations than the previ-ously annotated system speech acts by grouping them according to their similarity. For building such clusters we apply the Expectation-Maximization (EM) algorithm. The EM algorithm is an incremental approach to clustering (Dempster, Laird, and Rubin 1977), which fits parameters of Gaussian density distributions to the data. In order to define similarity between system actions, we need to describe their (semantic) properties. We therefore annotate the system acts using a fine-grained scheme by Rodriguez and Schlangen (2004) and Rieser and Moore (2005), which allows classification of dialogue acts in terms of different forms and functions.
Figure 4
Annotation scheme of discourse functions for wizard’s actions.
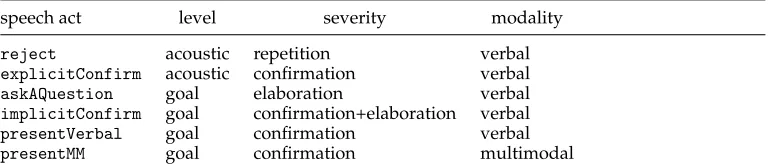
information (e.g., Sorry, can you please repeat? and utterances which aim to elicit fur-ther information to uniquely identify the user’s reference(e.g.,By which artist?). As well as utterances trying to establishcontact(e.g.,Can you hear me?), and utterances about the user’s intention(e.g.,What do you want me to do?). The problemseverity describes which type of feedback the system requests from the user, namely, asking for confirmation, forrepetition, or for elaboration. Themodalityof the dialogue act can either beverbalormultimodal.
Table 6 shows a mapping between system speech acts as described in Figure 2 and the annotated discourse functions. We use these features for clustering the speech acts according to their similarity in discourse function and form.
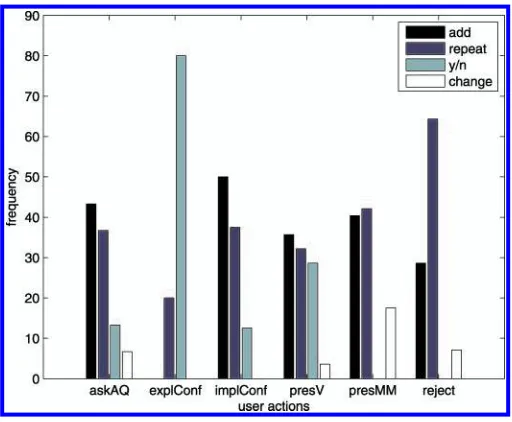
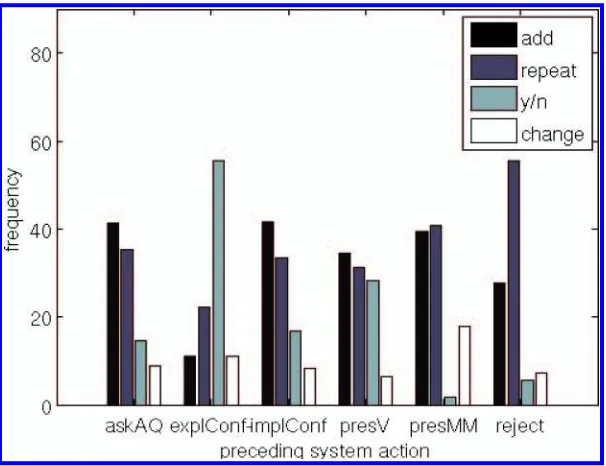
The EM algorithm generates three state clusters: The system actsaskAQuestionand implConfirmare summarized into cluster 1;explConfandrejectare in cluster 2; and presentListVerbalandpresentListMMare in cluster 3. For every cluster we assign the observed frequencies of user actions (i.e., all the user actions which occur with one of the states belonging to that cluster), as shown in Figure 5.
3.5.2 Smoothed Bigram User Simulation.For our second user simulation model we apply
smoothing to a bigram model. We implement a simple smoothing technique called “add-one smoothing” (Jurafsky and Martin 2000). This technique discounts some non-zero counts in order to obtain probability mass that will be assigned to the non-zero counts. We apply this technique to the original frequency-based bigram model. The resulting model is shown in Figure 6.
[image:15.486.54.440.578.662.2]In general, the smoothed model is closer to the original data than the cluster-based one (thus being more realistic at the expense of allowing less exploratory behavior). In the next section we introduce an evaluation metric which allows us to assess the level of exploratory versus realistic user behavior as exhibited by the different user simulations.
Table 6
System speech acts and corresponding discourse functions.
speech act level severity modality
reject acoustic repetition verbal
explicitConfirm acoustic confirmation verbal
askAQuestion goal elaboration verbal
implicitConfirm goal confirmation+elaboration verbal
presentVerbal goal confirmation verbal
Figure 5
User action frequencies from the cluster-based user simulation.
Figure 6
User action frequencies from the smoothed bigram user simulation.
3.5.3 Evaluation of User Simulations. Several metrics have been proposed to evaluate
[image:16.486.48.351.322.555.2]diver-Table 7
Kullback–Leibler divergence scores for the different user simulations. User simulations Baselines
smoothed cluster random majority 0.087 0.095 0.43 0.48
gence6 (as also used by Cuay´ahuitl et al. 2005; Jung et al. 2009), which is defined as follows:
DKL(P||Q)=
M
i=1
P(i)∗logP(i)
Q(i) (3)
This metric measures the divergence between distributions P and Qin a context withMresponses. Ideally, the KL divergence between two similar distributions is close to zero.
KL allows us to compare the raw probabilities as observed in the original data with the probabilities generated by our user simulation models. We then compare the KL results of the cluster-based and the smoothed user simulation against a random model and a majority baseline (see Table 7). The random model is constructed by assigning equal frequency to all four actions, whereas the majority baseline always predicts the most frequent action in one context. The comparison against the random baseline tests the hypothesis that our user simulations are more consistent with the observed data than random behavior. The majority baseline represents the hypothesis that our user simulation explores a significantly wider range of behavior than the most frequent user action.
The user simulation models have a small divergence from the original data suggest-ing that they are good simulations for trainsuggest-ing and testsuggest-ing policies. The smoothed and the cluster-based model gain on average five times lower KL scores than the baselines. We therefore conclude that both simulations show consistent (i.e., better than random) as well as varying (i.e., better than the majority decision) behavior.
As mentioned previously, we want user simulations for policy training to allow more exploration, whereas for testing we want user simulations which are more realis-tic. We therefore choose to test with the smoothed model because its low KL score shows that it is closest to the data, and we use the cluster-based simulation for training.
Note that the KL divergence only measures consistency with respect to specific dialogue contexts. However, user simulations also need to be coherent with respect to the dialogue history and the current user goal. We therefore model the user’s goal (i.e., the song s/he is looking for) similar to “agenda-based user models”(Schatzmann et al. 2007; Schatzmann, Thomson, and Young 2007b). The user goal corresponds to a database entry, which is randomly chosen in the beginning of each dialogue. Every time the user simulation generates a speech act, the corresponding value is chosen from the goal record, dependent on the slot value the system was asking for.
[image:17.486.51.439.102.155.2]3.6 Data-Driven Reward Modeling
The reward function defines the goal of the overall dialogue. For example, if it is most important for the dialogue to be efficient, the function penalizes dialogue length, while rewarding task success. In most previous work the reward function is manually set, which makes it “the most hand-crafted aspect” of RL (Paek 2006). For example, Williams and Young (2007) use +10 points for task completion and –1 point per turn, but there is no empirical basis for this specific ratio. In contrast, we learn the reward model from data, using a modified version of thePARADISEframework (Walker, Kamm, and Litman 2000), following pioneering work by Walker, Fromer, and Narayanan (1998). In
PARADISEmultiple linear regression is used to build a predictive model of subjective user ratings (from questionnaires) from objective dialogue performance measures (such as dialogue length). The subjective measure that we wish to optimize for our application is Task Ease, a variable obtained by taking the average of two questions in the question-naire.7We usePARADISEto predict Task Ease from various input variables, via stepwise regression. The chosen model comprises dialogue length in turns, task completion (as manually annotated in the WOZ data), and the multimodal user score from the user questionnaire, as shown in Equation (4) (R2 =.144,R2
adjusted=.123).
TaskEase= −20.2×dialogueLength+
11.8×taskCompletion+8.7×multimodalScore; (4)
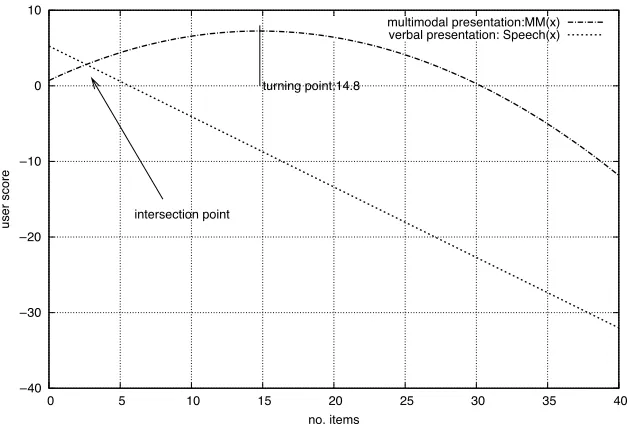
This equation is used to calculate the overall reward for the information acquisition phase. Task completion is calculated on-line during learning, penalizing all slots which are filled but not confirmed. Slots that are filled but not confirmed have a 30% chance of being incorrect according to the noise model (see Section 3.4). For the information presentation phase, we compute a local reward. We relate the multimodal score (a variable obtained by taking the average of four questions)8 to the number of items presented (DB) for each modality, using curve fitting. In contrast to linear regression, curve fitting does not assume a linear inductive bias, but it selects the most likely model (given the data points) by function interpolation. The resulting models are shown in Figure 7. The reward for multimodal presentation is a quadratic function that assigns a maximal score to a strategy displaying 14.8 items (curve inflection point). The reward for verbal presentation is a linear function assigning negative scores to all presented items≥4. The reward functions for information presentation intersect at no. items=3. A comprehensive evaluation of this reward function can be found in Section 6.2.
3.7 State Space Discretization
We use linear function approximation in order to learn with large state-action spaces. Linear function approximation learns linear estimates for expected reward values of actions in states represented as feature vectors. This is inconsistent with the idea of non-linear reward functions (as introduced in the previous section). We therefore quantize the state space for information presentation. We partition the database feature into three
7 “The task was easy to solve”, “I hadnoproblems finding the information I wanted.”
8 “I liked the combination of information being displayed on the screen and presented verbally”,
Figure 7
Evaluation functions relating number of items presented in different modalities to multimodal score.
bins, taking the first intersection point between verbal and multimodal reward and the turning point of the multimodal function as discretization boundaries. Previous work on learning with large databases commonly quantizes the database feature in order to learn with large state spaces using manual heuristics (e.g., Levin, Pieraccini, and Eckert 2000; Heeman 2007). Our quantization technique is more principled as it reflects user preferences for multi-modal output. Furthermore, in previous work database items were not only quantized in the state-space, but also in the reward function, resulting in a direct mapping between quantized retrieved items and discrete reward values, whereas our reward function still operates on the continuous values. In addition, the decision of
when to present a list (information acquisition phase) is still based on continuous DB values. In future work we plan to engineer new state features in order to learn with non-linear rewards while the state space is still continuous. A continuous representation of the state space allows learning of more fine-grained local trade-offs between the parameters, as demonstrated by Rieser and Lemon (2008a).
4. Training and Testing the Learned Policies in Simulation
We now train and test the multimodal presentation strategies by interacting with the simulated learning environment. For the following RL experiments we used theREALL
-DUDE toolkit of Lemon et al. (2006). The SHARSHA algorithm is employed for train-ing, which adds hierarchical structure to the well knownSARSAalgorithm (Shapiro and Langley 2002). The policy is trained with the cluster-based user simulation over 180k system cycles, which results in about 20k simulated dialogues. In total, the learned strat-egy has 371 distinct state-action pairs as presented in the look-up table in Appendix E.
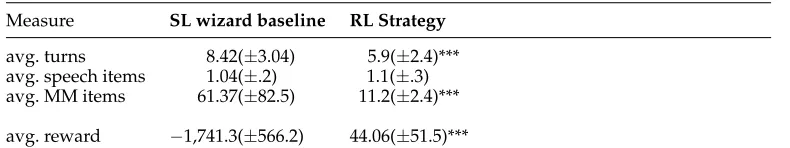
test dialogues with the smoothed user simulation, as described in Section 3.5.2, so that we are not training and testing on the same simulation. We then compare quantitative dialogue measures by performing a paired t-test. In particular, we compare mean values of the final rewards, number of filled and confirmed slots, dialogue length, and items presented multimodally (MM items) and items presented verbally (verbal items). RL performs significantly better (p<.001) than the baseline strategy. The only non-significant difference is the number of items presented verbally, where both the RL and the average wizard strategy settled on a threshold of fewer than four items. The mean performance measures for simulation-based testing are shown in Table 8.
The major strength of the RL policy is that it learns to keep the dialogues reasonably short (on average 5.9 system turns for RL versus 8.4 turns for SL wizard) by presenting lists as soon as the number of retrieved items is within tolerance range for the respec-tive modality (as reflected in the reward function). The SL strategy in contrast has not learned the right timing nor an upper bound for displaying items on the screen (note that the distribution forMM itemsis highly positively skewed with a maximum of 283 items being displayed). See example dialogues in Appendix C.
The results show that simulation-based RL with an environment bootstrapped from WOZ data allows learning of robust strategies which significantly outperform the strategies learned by SL from the original data set. This confirms our hypothesis that simulation-based RL allows us to find optimal policies which are not easily discoverable (by Supervised Learning) in the original data.
Furthermore, RL allows us to provide additional information about user prefer-ences in the reward function, whereas SL simply mimics the data. In addition, RL is based on delayed rewards, namely, the optimization of a final goal. For dialogue systems we often have measures indicating how successful and/or satisfying the overall performance of a strategy was, but it is hard to tell how exactly things should have been done in a specific situation. This is what makes RL specifically attractive for dialogue strategy learning. In the next section we test the learned strategy with real users.
5. Tests with Real Users
5.1 Experimental Design
For the user tests the RL policy is ported to a working ISU-based dialogue system via table look-up (see table in Appendix E) , which indicates the action with the highest expected reward for each state (cf. Singh et al. 2002). The supervised average wizard baseline is implemented using standard threshold-based update rules. The
experimen-Table 8
Comparison of results for SL wizard and RL-based strategies in simulation. Measure SL wizard baseline RL Strategy
avg. turns 8.42(±3.04) 5.9(±2.4)*** avg. speech items 1.04(±.2) 1.1(±.3) avg. MM items 61.37(±82.5) 11.2(±2.4)*** avg. reward −1,741.3(±566.2) 44.06(±51.5)***
[image:20.486.47.442.570.644.2]Table 9
Comparison of mean user ratings for SL wizard baseline and RL policies (with standard deviation±).
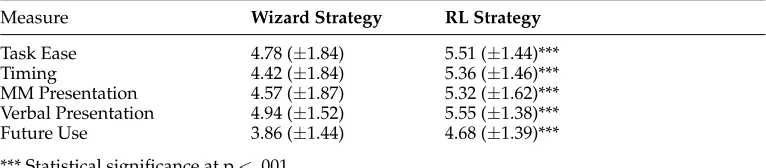
Measure Wizard Strategy RL Strategy
Task Ease 4.78 (±1.84) 5.51 (±1.44)*** Timing 4.42 (±1.84) 5.36 (±1.46)*** MM Presentation 4.57 (±1.87) 5.32 (±1.62)*** Verbal Presentation 4.94 (±1.52) 5.55 (±1.38)*** Future Use 3.86 (±1.44) 4.68 (±1.39)*** *** Statistical significance at p<.001.
tal conditions are similar to the WOZ study, that is, we ask the users to solve similar tasks, and use similar questionnaires.9 Furthermore, we decided to use typed user input rather than ASR. The use of text input allows us to target the experiments to the dialogue management decisions on presentation strategies, and prevents ASR quality from interfering with the experimental results, especially because subjective user scores are highly sensitive to ASR noise (Hajdinjak and Mihelic 2006). Both RL and SL wizard policies are trained to handle noisy conditions, so that they usually confirm user input, which makes dialogues longer but more reliable. The lack of noise in this experiment means that confirmation happens more than is strictly required (although there are still text input spelling mistakes), but the information presentation decisions are not affected.
Seventeen subjects (8 women, 9 men) are given a set of 12 (6×2) predefined, ordered tasks, which they solve by interaction with the RL-based and the SL-based average wizard system in a cyclic order. As a secondary task users are asked to count certain objects in a driving simulation. In total, 204 dialogues with 1,115 turns are gathered in this set-up. See also Rieser (2008).
5.2 Results
In general, the users rate the RL-based policy significantly higher (p <.001) than the SL-based average wizard policy. The results from a Wilcoxon Signed Ranks Test on the user questionnaire data (see Table 9) show significantly improved Task Ease, better presentation timing, more agreeable verbal and multimodal presentation, and that more users would use the RL-based system in the future (Future Use). All the observed differences have a medium effects size (r≥ |.3|).
We also observe that female participants clearly favor the RL-based strategy, whereas the ratings by male participants are more indifferent. Similar gender effects are also reported by other studies on multimodal output presentation (e.g., Foster and Oberlander 2006; Jokinen and Hurtig 2006).
Furthermore, we compare objective dialogue performance measures. The dialogues of the RL strategy are significantly shorter (p < .005), while fewer items are dis-played (p< .001), and the help function is used significantly less (p< .003). The mean
performance measures for testing with real users are shown in Table 10. Also see example dialogues in Appendix D. However, there is no significant difference for the performance of the secondary driving task.
6. Meta Evaluation
We introduce a final phase where we meta-evaluate the whole framework. This final step is necessary because WOZ experiments only simulate HCI. We therefore need to show that a strategy bootstrapped from WOZ data indeed transfers to real HCI. We first show that the results for simulated and real interaction are compatible (Section 6.1). We also meta-evaluate the reward function, showing that it is a stable, accurate estimate for real users’ preferences (Section 6.2).
6.1 Transfer Between Simulated and Real Environments
We first test whether the results obtained in simulation transfer to tests with real users, following Lemon, Georgila, and Henderson (2006). We evaluate the quality of the simu-lated learning environment by directly comparing the dialogue performance measures between simulated and real interaction. This comparison enables us to make claims regarding whether a policy which is “bootstrapped” from WOZ data is transferable to real HCI. We first evaluate whether objective dialogue measures are transferable, using a paired t-test, comparing overall mean performance.
[image:22.486.46.432.580.644.2]For the RL policy there is no statistical difference in overall performance (reward), dialogue length (turns), and the number of presented items (verbal and multimodal items) between simulated and real interaction (see Figure 8). This fact (that the per-formances are not different) indicates that the learned strategy transfers well to real settings. For the SL wizard policy the dialogue length for real users is significantly (t(101)=5.5, p < .001, r =.48) shorter than in simulation. We conclude from an er-ror analysis that this length difference is mainly due to the fact that real users tend to provide the most “informative” slot value (i.e., the most specific value from the experimental task description) right at the beginning of the task (and therefore more efficiently contribute to solve the task), whereas simulated users use a default ordering of slot values and most of the time they provide the slot value that the system was asking for (provide info). This difference becomes more prominent for the SL wizard policy than for the RL-based policy, as the SL wizard policy in general asks more questions before presenting the information. In future work the user simulation therefore should learn optimal slot ordering.
Table 10
Comparison of results for SL average wizard and RL-based strategies with real users. Measure Wizard Strategy RL Strategy
avg. turns 5.86(±3.2) 5.07(±2.9)*** avg. speech items 1.29(±.4) 1.2(±.4) avg. MM items 52.2(±68.5) 8.73(±4.4)*** avg. reward −628.2(±178.6) 37.62(±60.7)***
Figure 8
Graph comparison of objective measures. SLs = SL policy in simulation; SLr = SL policy with real users; RLs = RL policy in simulation; RLr = RL policy with real users.
6.2 Evaluation of the Learned Reward Function
We propose a new method for meta-evaluation of the reward (or “objective”) function. One major advantage of RL-based dialogue strategy development is that the dialogue strategy can be automatically trained and evaluated using the same objective function (Walker 2005). Despite its central aspect for RL, quality assurance for objective functions has received little attention so far. In fact, as noted in Section 3.6, the reward function is one of the most hand-coded aspects of RL (Paek 2006).
Here, we bring together two strands of research for evaluating the reward function: One strand uses Reinforcement Learning to automatically optimize dialogue strategies (e.g., Singh et al. 2002; Henderson, Lemon, and Georgila 2008; Rieser and Lemon 2008a, 2008b); the other focuses on automatic evaluation of dialogue strategies (e.g., thePAR
-ADISEframework [Walker et al. 1997]), and meta-evaluation of dialogue metrics (e.g., Engelbrecht and M ¨oler 2007; Paek 2007). Clearly, automatic optimization and evaluation of dialogue policies, as well as quality control of the objective function, are closely inter-related problems: How can we make sure that we optimize a system according to real users’ preferences?
In Section 3.6 we constructed a data-driven objective function using thePARADISE
models obtained withPARADISEoften fit the data poorly (Engelbrecht and M ¨oller 2007). It is also not clear how general they are across different systems and user groups (Walker, Kamm, and Litman 2000; Paek 2007). Furthermore, it is not clear how they per-form when being used for automatic strategy optimization within the RL framework.
In the following we evaluate different aspects of the reward function. In Sec-tion 6.2.1 we test the model stability in a test–retest comparison across different user populations and data sets. In Section 6.2.2 we measure its prediction accuracy.
6.2.1 Reward Model Stability.We first test the reward model’s stability by re-constructing
it from the data gathered in the real user tests (see Section 5) and comparing it to the original model constructed from the WOZ data. By replicating the regression model on different data sets we test whether the automatic estimate of Task Ease general-izes beyond the conditions and assumptions of a particular experimental design. The resulting models are shown in Equations (5)–(7), whereTaskEaseWOZ is the regression model obtained from the WOZ data,10 TaskEase
SL is obtained from the user test data running the supervised average wizard policy, and TaskEaseRL is obtained from the user test data running the RL-based policy. They all reflect the same trends: Longer dialogues (measured in turns) result in a lower Task Ease, whereas a good performance in the multimodal information presentation phase (multimodal score) will positively influence Task Ease. For the user tests almost all the tasks were completed; therefore task completion was only chosen to be a predictive factor for the WOZ model.
TaskEaseWOZ=1.58+.12×taskCompl+.09×mmScore−.20×dialogueLength (5)
TaskEaseSL=3.50+.54×mmScore−.34×dialogueLength (6)
TaskEaseRL =3.80+.49×mmScore−.36×dialogueLength (7)
To evaluate the obtained regression models we use two measures: how well they fit the data and how close the functions are to each other (model replicability). Both are measured using goodness-of-fit R2. For the WOZ model the data fit was rather low (R2WOZ=.123),11 whereas for the models obtained from the user tests the fit has improved (R2RL=.48, andR2SL=.55).
Next, we compare how well the models from different data sets fit each other. Although the models obtained from the user test data show almost perfect overlap (R2 =.98), the (reduced) WOZ model differs (R2 =.22) in the sense that it assigns less weight to dialogue length and the multimodal presentation score, and more weight is assigned to task completion. Task completion did not play a role for the user tests, as mentioned earlier. This shows that multimodal presentation and dialogue length become even more important once the tasks are being completed. Overall, then, the data-driven reward model is relatively stable across the different data sets (WOZ, real users with the SL policy, and real users using the RL policy).
6.2.2 Reward Model Performance: Prediction Accuracy.We now investigate how well these
reward models generalize by testing their prediction accuracy. Previous research
Table 11
Prediction accuracy for models within (1–3) and across (4–5) data sets. ID train test RMSE % error
1 WOZ WOZ 0.82 16.42
2 SL SL 1.27 18.14
3 RL RL 1.06 15.14
4 RL SL 1.23 17.57
5 SL RL 1.03 14.71
ated two aspects: how well a given objective function/reward model is able to predict unseen scores from the original system (Engelbrecht and M ¨oller 2007), and how well it is able to predict unseen scores of a new/different system (Walker, Kamm, and Litman 2000). We evaluate these two aspects as well, the only difference is that we use the Root Mean Standard Error (RMSE) instead ofR2 for measuring the model’s prediction accuracy. The RMSE is a frequently used measure of the differences between values predicted by a model or an estimator and the values actually observed. It is defined over [0,∞], where 0 indicates perfect overlap. The maximum RMSE possible (= worst case) in our set-up is 7 for SL/RL and 5 for WOZ. In order to present results from different scales we also report the percentage of the RMSE of the maximum error (% error). RMSE is (we argue) more robust for small data sets.12
R2=1−
n
i=1(yi−yi)2
n
i=1(y−y)
(8)
RMSE=
1
n
n
i=1
(yi−yi)2 (9)
First, we measure the predictive power of our models within the same data set using 10-fold cross validation, and then across the different systems by testing models trained on one system to predict perceived Task Ease scores for another system, following a method introduced by Walker, Kamm, and Litman (2000).
The results for comparing the RMSE for training and testing within data sets (ID 1-3) and across data sets (ID 4–5) are shown in Table 11. RMSE measures the average of the square of the “error.” As such, lower RMSE values are better. The contrary is true forR2, where “1” indicates perfect overlap between two functions.
[image:25.486.174.297.342.419.2]The results show that predictions according toPARADISEcan lead to accurate test results despite the low data fit. Whereas for the regression model obtained from the WOZ data the fit was 10 times lower than for SL/RL, the prediction performance is comparably good (see Table 11, ID 1–3). The models also generalize well across systems (see Table 11, ID 4–5).
Table 12 visualizes the results (ID 1–3): Mean values for predicted and for true ratings are plotted per turn (see Engelbrecht and M ¨oller 2007). The top two graphs in the
Table 12
table show that the predicted mean values are fairly accurate for the SL and RL objective functions. The graph at the bottom indicates that the predictions are less accurate for the WOZ data, especially for low numbers of turns. This seems to contradict the previous results in Table 11, which show low error rates for the WOZ data. However, this is due to the fact that most of the observations in the WOZ data set are in the region where the predictions are accurate (i.e., most of the dialogues in the WOZ data are over 14 turns long, where the curves converge).
We conclude that, according to our measures, an objective function obtained from WOZ data is a valid first estimate of real users’ preferences. Despite a low fit to the initial data, the objective function obtained from WOZ data makes accurate and useful predic-tions for automatic dialogue evaluation/reward. The models obtained from the tests with a real system follow the same trends, but can be seen as more reliable estimates of the objective function in this domain. In future work we will explore incrementally training a system according to improved representations of real user preferences, for example, gathered on-line from a deployed spoken dialogue system.
7. Conclusion
We have presented a new data-driven methodology for simulation-based dialogue strategy learning. It allows us to address several problems in the field of automatic optimization of dialogue strategies: learning effective dialogue strategies when no ini-tial data or system exists, and determining a data-driven reward function. We learned optimal strategies by interaction with a simulated environment which is bootstrapped from a small amount of Wizard-of-Oz data, and we evaluated the result with real users. The use of WOZ data allows us to develop optimal strategies for domains where no working prototype is available. In contrast to previous work, the developed simulations are largely data-driven and the reward function reflects real user preferences.
We compare the Reinforcement Learning–based strategy against a supervised strat-egy which mimics the (human) wizards’ policies from the original data. This compari-son allows us to measure relative improvement over the training data. Our results show that RL significantly outperforms the average wizard strategy in simulation as well as in interactions with real users. The RL-based policy gains on average 50 times more reward when tested in simulation, and almost 18 times more reward when interacting with real users. The human users also subjectively rate the RL-based policy on average 10% higher, and 49% higher for Task Ease. We also show that results obtained in simulation are comparable to results for real users and we also evaluate the reward function. We conclude that a strategy trained from WOZ data via our bootstrapping method works well for real HCI.
Regarding scaling up such methods to larger databases, we would still quantize the number of database hits into High, Medium, and Low (more hits would be added to the “High” bin). In fact, wizards seemed to treat everything over 60 database hits equivalently (see Section 3.7). For learning, the state space grows linearly with the number of possible database hits. Techniques such as linear function approximation are useful for handling the resulting larger state spaces (Henderson, Lemon, and Georgila 2008).
Appendix A: Measuring Inter-Annotator Agreement on User Act Using the
κStatistics
[image:28.486.50.432.180.285.2]Cohen’s Kappa (often simply called kappa,κ) is a measure of agreement between the two individuals. We use this measure to assess inter-annotator agreement onuser act, following Carletta et al. (1997). Detailed results are in the table.
Table 1
Inter-annotator agreement onuser actwithκ=.632.
annotator1 annotator2
user reply add change others repeat y/n total
add 58 5 2 1 0 66
change 4 11 0 0 0 15
others 9 5 21 1 0 36
repeat 9 0 7 9 0 25
y/n 2 0 2 1 30 35
Appendix B: Wizard-of-Oz Example Dialogues
Table 1
Example dialogue from theSAMMIEWOZ corpus (mixed wizard strategy). s1 User: Bitte suche das Lied ,Layla’.
Transl.: Search for the song ‘Layla’ please. SA* user: add -> song-title(Layla)
Wizard: Wir haben das Lied gefunden. Es existiert 142 mal in verschiedenen Ausf ¨uhrungen
Transl.: The song is retrieved. There are 142 different versions.
mmAction: [ Table with 142 entries is shown on the screen. ] SA
wizard:
presentMM -> song-title (db:142)
s2 User: Bitte suche das Lied on dem Komponisten ,Eric Clapton’. Transl.: Search for the song by the composer ‘Eric Clapton’ please. mm
Action:
[ User does not react to what is displayed. ] SA user: change -> artist(‘Eric Clapton’)
Wizard: Es gibt das Lied von ,Eric Clapton’ oder von ‘Derek & the Dominos’. Transl.: The song exists by ‘Eric Clapton’ or by ‘Derek & the Dominos’.
SA wizard:
presentVerbal -> song-title, artist(db:2)
s3 User: Bitte spiele das Lied von ,Eric Clapton Unplugged’ ab. Transl.: Play the song from ‘Eric Clapton Unplugged’ please. SA user: repeat ->album(‘Eric Clapton Unplugged’) Wizard: Ich spiele das Lied jetzt ab.
Transl.: OK I am going to play the song now. SA
wizard:
feedback/others
mmAction: [ music ] user
ratings
taskEase: 2, timing:2, mmPresent.: 1 , verbalPresent: 3, futureUse:3
* SA = Speech Act
Comments:
Table 2
Example dialogue from theSAMMIEWOZ corpus (wizard not starting the presentation phase early enough).
s1 User: Also, ich suche das Lied ,Smile’. Transl.: Well, I am searching for the song ‘Smile’. SA user: add -> song-title(Smile)
Wizard: Welches Lied suchst du? Transl.: What song are you searching for? comment: [ Song name was deleted ] SA
wizard:
reject(song-title)
s2 User: Smile. Transl.: Smile.
SA user: repeat -> song-title(Smile) Wizard: Du suchst das Lied ,Smile’? Transl.: Are you searching for the song ‘Smile’? SA
wizard:
explConf(song-title)
s3 User: Ja, Smile ja. Transl.: Yes, Smile yes.
SA user: y-answer -> song-title(Smile)
Wizard: Ich suche es... Ich habe vier Lieder mit dem einfachen Titel ,Smile’. Transl.: I am searching... I found four songs with only ‘Smile’ as the title. SA
wizard:
presentVerbal(song-title)
s4 User: Ja denn, das Lied bitte anzeigen. Transl.: Very well then, why don’t you show it?
SA user: others Wizard: OK. Transl.: OK. SA
wizard:
presentMM(song-title)
user ratings
taskEase: 2, timing: 2, mmPresent.: 5, verbalPresent: 3, futureUse:3
Comments: