Review: Models of Instrumented Indentation
Measurements of Elastic- Plastic Materials
Javvaji Dileep1, B. Sridhar Babu 2
1
Assistant Professor, Dhruva Institute of Engineering and Technology, Hyderabad.
2
B Sridhar Babu, Associate Professor, CMR Institute Of Technology, Hyderabad.
Abstract: We provide an overview of the basic concepts of Instrumented indentation measurements, followed by a review of some of the recent work on instrumented indentation measurements models. Specifically, we examine conical , pyramidal indentation in elastic–plastic solids with power-law work hardening,. We show that the instrumented indentation modeling provides new insights into several basic questions in instrumented indentation, including, what information is contained in the indentation load–displacement curves? How does hardness depend on the mechanical properties and indenter geometry? What are the factors determining piling-up and sinking-in of surface profiles around indents? Can stress–strain relationships be obtained from indentation load–displacement curves? How to measure time dependent mechanical properties from indentation? How to detect or confirm indentation size effects? The models of instrumented indentation measurements helps organize knowledge and provides a framework for bridging micro- and macro scales. We hope that this review helps in better understanding of instrumented indentation measurement models.
Keywords: Indentation, mechanical properties, materials
I. INTRODUCTION
Instrumented indentation measurements have also been used in the study of the deformation and fracture of rocks for a better understanding of rock mechanics related to geological evolution of the planets.
This challenge, along with the ever-increasing availability of commercial indenter systems, has driven a major increase in indentation as a research tool. However, in contrast to other established mechanical tests, e.g. uniaxial tension, the goal of indentation experiments is not always to extract a ‘‘value’’, or rather, should not be. As has been noted in the literature, and will be shown in this review, the concepts of hardness and modulus, as extracted via indentation, are manufactured parameters that are strongly dependent upon tip geometry, elastic and inelastic material behavior, and specimen boundary conditions. That this is beginning to be recognized in scientific circles is partially illustrated by the increasing use of the term ‘‘indentation modulus’’ when reporting results, and careful scrutiny in comparison of indentation-extracted properties to those under different loading conditions. Indeed, as more complex material systems are probed via indentation, robust scientific conclusions can only be strengthened by maintaining this perspective.
II. SIMPLE MODELS FOR MECHANICAL BEHAVIOR OF SOLIDS
The success of continuum mechanics is its predictive models based on a relatively few measurable parameters that provide reasonably good predictions about the bulk mechanical behavior of materials across many length scales, enabling the construction of bridges, highways, skyscrapers, airplanes, and automobiles. It has been recognized that certain mechanical properties of materials are structurally insensitive and size independent and others are structurally sensitive and size dependent [6]. Properties such as the elastic modulus are size independent, the measured values from macroscopic experiments are consistent with that predicted from first-principles quantum mechanics calculations. Other properties are size-dependent, for example the yield strength of polycrystalline solids which depends on the grain size and the mechanical/thermal history that the samples have experienced. In this section, we summarize several simple models for elastic, elastic–plastic, behavior of materials. These models allow detailed analysis of indentation problems, thus providing insights that might be obscured if more complex mechanics models are used.
A. Isotropic Linear Elastic Materials
Most materials deform elastically when deformation is small. The stress–strain relationships of isotropic linear elastic materials can be expressed in two equations by separating the deviatoric stress and strain, sij and dij, from the dilatational stress and strain, sii and eii, as follows [6]:
sij =2Gdij
σii=3Kεii (1)
where G is the shear modulus and K is the bulk modulus representing the inverse of compressibility. Using the definition of sij and sii together with Eq. (1), the stress–stain relationship can be expressed as
2
1
(1
)(1 2 )
ij ij ij ij ij
E
G
(2)where
K
(2 / 3)
G
and G are called Lame´’s constants; E is Young’s modulus and n is Poisson’s ratio. The dimension ofλ, G, and E is the same as that of stress and n is dimensionless. The mechanical properties of isotropic linear elastic solids can be
prescribedby any two of these parameters of these parameters, for example, E and n.
B. Power-Law Work-Hardening
With increasing degree of deformation, plastic deformation occurs, leading to permanent deformation. Although many mechanisms of plastic deformation exist, it has been found that, at least for metals, a fairly good approximation is power-law work-hardening [7] and the stress–strain curves under uniaxial tension are assumed to be given by
n
Y
E f o r
E
Y
C f o r
E
(3)
where Y, the initial yield stress, and C, the strength coefficient, have the same dimension as stress and n, the strain-hardening
exponent, is dimensionless. To ensure continuity, we note C = Y[E/Y]n. Consequently, either E, Y, and C or E, Y, and n are
C. Power-law Creep
Time dependent plasticity occurs when materials are deformed at an elevated temperature, often greater than 0.5 Tm, where Tm is the absolute melting temperature. Creep is timedependent plasticity under constant stress at elevated temperatures. Three regions are typically delineated Stage I or primary creep is typically characterized by increasing strain with decreasing strain rate. Stage I is followed by Stage II, known also as the secondary or steady-state creep, where the strain increases at a constant strain rate. Eventually, cavitation and/or cracking cause the strain to increase with increasing rate until rupture takes place. This regime is termed State III. In the steady-state creep regime, which usually persists for substantial portion of the material’s life, the strain-rate sensitivity of materials can be modeled by a simple power-law relation,
III. INDENTATION IN ELASTIC–PLASTIC SOLIDS WITH POWER-LAW WORK-HARDENING
A. Shape Of Indentation Loading Curves
An indentation loading curve is the relationship between load, F, and displacement, h, that can be continuously measured during an indentation experiment. The aim of this section is to review the approaches used to describe indentation loading curves, including expressions derived from dimensional analysis for conical and pyramidal indentation in homogeneous elastic–plastic solids. This section serves to answer questions such as what is the expected shape of indentation loading curves and what information is contained in these curves? The contact between a rigid conical indenter normally loaded into a flat specimen is well known for two types of materials, elastic materials and rigid-plastic materials.
Fig. 1. Schematic illustration of conical indentation with definition of terms.
For elastic materials, ananalytic expression was obtained by Love [8], Harding and Sneddon [9], and Sneddon [10] between the load, F, and the penetration depth, h, in the case of a nonadhesive rigid conical punch, normally loaded, on the surface of a smooth elastic body as
2
2 2
2
tan
(1
)
eEh
F
k h
(4)The load is proportional to the square of the indenter displacement during both loading and unloading. The proportionality factor,
Ke, depends on both the elastic parameters 2
(1
)
E
and indenter geometry,θ. For rigid-plastic solids, Tabor [11], applying theprincipal of geometric similarity, shows that the mean pressure acting on a conical or pyramidal indenter is the same whatever the size of indentation, as long as the material is uniform and homogeneous. He found, for fully work-hardened metals, the semi-empirical relation for the mean pressure
m
P
C Y
(5)where CӨ is function of indenter geometry and Y is the yield strength. Since the mean pressure was empirically found to be
independent of the depth of indentation, the load is thus proportional to the square of indentation depth,
F = Kp h2 (6)
F = Keph2 (7)
where Kep is a function of materials properties and indenter geometry. Several equations have been proposed that link Kep to Ke and
Kp [12]. It has also been proposed that the indentation loading curves can be more generally described by the so called Meyer’s law,
F = Khα (8)
where a is not necessary an integer. In the following, the origin of the square dependence and its implications are examined. The dependence of K on the mechanical properties of materials and indenter geometry will also be explored.
Several authors have proposed explicit equations for indentation loading curves for conical and pyramidal indenters. The square dependence on the indentation depth is usually either assumed or verified by finite element calculations, although details vary depending on the underlining assumptions. For example, Larrson et al. [13] proposed expressions for indentation loading curves for Vickers and Berkovich indenters based on extensive finite element calculations. Their equationfor loading curves was inspired by that of the spherical cavity model and was parameterized in terms of several quantities, including a representative stress corresponding to a ‘‘representative’’ strain of about 0.3. Sakai [14] and Rother [15] suggested that the prefactor in the square-depth dependence is a function of work of indentation. Hainsworth et al. [16] derived an equation for the loading curves where the prefactor contains a function of H/E*, the ratio of hardness to reduced modulus. A modification of the loading curve equation first proposed by Hainsworth et al. was recently made by Malzbender et al. [17] and Troyona and Martin [18].
From dimensional analysis, it is evident that the square dependence is a consequence of the absence of a length scale. Therefore, it should hold for more complex constitutive laws which do not contain length scales, as has been shown recently by Li et al. [19] for anisotropic elastic solids, other plasticity models, and materials with finite impressibility. The dimensionless pre-factor depends on a large number of dimensionless parameters, though the square dependence remains valid. On the other hand, the square dependence is expected to breakdown if there exists a relevant length parameter, l. Indeed, we note from dimensional analysis,
2
..., ,..
h
F
Eh
l
(9)The loading curve is thus no longer proportional to the square of indenter displacement. For example, we have shown [20] that loading curves can depart from the square dependence if the conical or pyramidal indenter has a finite tip radius R (Fig. 8). In this case, the tip radius, R, enters the above equation as a length parameter in place of l. In fact, it has been shown that both tip radius, R, and load frame compliance can be determined from the loading curve, thus facilitating the calibration of indentation systems [21]. Hence, the square dependence of loading curves should hold for sharp conical and pyramidal indentation in homogeneous solids without a length parameter
B. Contact Depth, ‘‘Sinking-In’’ And ‘‘Piling-Up’’ Phenomena
It is well known that the materials immediately outside the contact area of an indentation usually deform and do not remain flat . For a heavily work-hardened metal, such as copper or mild steel, the surface of the specimen around the indentation bulges upwards or piles-up, and for a fully annealed metal, the surface of the specimen around the indentation sinks in [22]. Both piling-up and sinking-in behavior are schematically illustrated in Fig. 5. The piling-up and sinking-in phenomena are of interest because they affect the accurate determination of contact areas and thus the hardness measurements. Other interesting issues include whether the pile-up area carries load, the optical appearance of indents on surfaces, and the use of the shape of the indents to infer the mechanical properties of the solids. Dimensional analysis can help identify the parameters affecting the degree of piling-up and sinking-in [23]. In general, the contact depth is a function of all independent parameters
( , , , , , )
c
h
g E
Y n h
(10)They are consistent with experimental observations of sinking-in and piling-up phenomena reported in the literature. previous experiments clearly demonstrated the influence of work-hardening on piling-up and sinking-in. Previously, it has been suggested that piling-up and sinking-in was determined by the work-hardening exponent [22]. Others have shown that for highly elastic solids, such as polymers, sinking in is often observed [11].
C. Relationships Between Hardness And Mechanical Properties Of Solids
several hardness definitions exist in the standards or protocols for indentation measurements. The one commonly used in recent instrumented indentation literature is given by
c
F
H
A
; (11)where Ac is the projected contact area under load F. The traditional definition of hardness is
trad
trad
F
H
A
; (12)where Atrad is the residual projected area of the hardness impression after load removal. The two hardness values can differ
significantly, when Ac/Atrad
1. This is, for example, the case of indentation in rubbers where Ac is finite and Atrad approacheszero. We will use primarily the first definition (Eq. (26)) in this review. Hardness, once defined, allows ranking of materials by their hardness values. While it is useful to assign materials their hardness, it has been of persistent interest to understand relationships between hardness and fundamental properties of materials and address questions such as ‘‘Is hardness a material property?’’ ‘‘Is it determined by the plasticity of solids?’’ ‘‘Does elastic property play a role?’’ ‘‘Can indenter geometry and loading conditions affect hardness measurements?’’ More generally, ‘‘What is hardness?’’ This section helps provide some answers to these questions by establishing relationships between hardness, elastic modulus, yield stress, work-hardening exponent, and indenter geometry. As early as 1945, Bishop et al. [24] suggested that the stress distribution under a conical indenter might be approximated by that of a spherical or cylindrical cavity. Using known solutions from the newly developed plasticity theory for spherical and cylindrical cavities, the authors established a relationship between the mean pressure under the indenter and Young’s modulus and yield strength, as well as work-hardening behavior. For elastic-perfectly plastic solids, the pressure at which the cavity expands depends on the ratio of Young’s modulus to yield strength and Poisson’s ratio according to
2
(1 ln
)
3
3(l
)
p
E
Y
Y
(13)In a serious of experiments with a variety of materials Marsh [25] found that his hardness results followed a pattern very close to that of equation above, but the constants were somewhat different. An extension of the spherical cavity was made by Johnson in the early 1970s [26]. He pointed out that the radial displacement of material lying on the elastic–plastic boundary must accommodate the volume of materials displaced by the indenter during indentation. He derived an equation for conical indenters of semi-angle y and Poisson’s ratio 0.5:
2
cot
(1 ln
)
3
3
p
E
Y
Y
: (14)This equation has been used often to provide an approximate, analytical description of conical indentation in elastic-perfectly plastic solids, though questions remain about the validity of the expanding cavity model for indentation problems, such as the simplification of the stress-field [27] and the neglect of the piling-up and sinking-in effects [4]. Based on slip-line field solution for indentation in a rigid-plastic solids by a frictionless rigid wedge and experimental bservations of indentation in metals with elastic-perfectly plastic behavior, Tabor [28] established a relationship between hardness, H, and yield stress, Y,
H = 3Y (15)
For most metals experiencing work-hardening, the indentation process itself produces an increase in the yield or flow stress in the materials. The plastic strain will consequently vary over the deformed region so that the amount of work hardening will vary from point to point. Although the strain distribution under an indenter is complex, Tabor suggested that there is a ‘‘representative’’ or ‘‘average effective’’ strain such that the indentation hardness is
H = 3Y0; (16)
where Y0 is the uniaxial flow stress at some specified strain value. For a Vickers indenter, this representative strain is between 0.08
hardness is a multiple function of materials mechanical properties. The practical implication is that one can achieve a desired hardness value by judicially engineering E, Y, and n. Furthermore, hardness is indenter geometry dependent as evident from several classic experiments [31] and recent calculations [32]. dimensional analysis together with finite element calculations can be used to unveil the relationships between hardness, mechanical properties, and indenter geometry.
D. Unloading-Curve, Initial Unloading Slope, Contact Area, And Elastic Modulus
For indentation in purely elastic solids, unloading curves would retrace loading curves. They do not, therefore, contain any new information. In contrast, unloading curves for indentation in elastic–plastic solids are thought to possess more information and have attracted much study. In particular, the initial unloading slope has been used for the determination of elastic modulus and hardness using, for example, the Oliver–Pharr procedure [2]. While this procedure is routinely used, the underlying assumptions are not always understood by the practitioners.
Many people have studied indentation unloading curves for a variety of materials [2]. It has been suggested [2] that the unloading curves could be described by
F
b h h
(
f)
m (17)Some authors treated b and m as numerical fitting parameters. Others believed them to be materials constants. The exponent m was usually found between 1.2 and 1.7, although m equals 2 was also hypothesized. Recently, Pharr et al. [34] advanced the concept of an ‘‘effective shape’’ of indenters that takes into account the observation that the unloaded shape of indents is not perfectly conical or pyramidal but exhibits a subtle convex curvature. They analyzed elastic reloading and found that the exponent m is related to the shape of the deformed surface, thus providing the parameter, m, a physical meaning. This idea has been further developed by Woirgard et al. [33]. Fundamentally, however, the primary difference between loading and unloading curves is the difference in contact conditions, i.e., initially flat surfaces versus deformed surfaces. The presence of the length parameter, hm, in the unloading equation is a consequence of this change in contact condition, leading to the exponent m differing from 2.
2
1
|
m h hdF
Ea
dh
=2 (18)
well-known expression for unloading slopes,and this Eq.(18) was initially derived for indentation into elastic solids [6]. Using the infinitesimal theory of continuum mechanics,
Several authors [14,] have calculated for different indenter angles and found that
2
1
|
m h hdF
Ea
dh
also has a weak dependence on y and on n. The y and n dependence can be understood by the fact that equations
was derived using linearized boundary conditions and infinitesimal theory of continuum mechanics, finite element calculations take into account nonlinear effects, including large strain and moving contact boundaries. Therefore, the small difference in numerical
values for 2
1
|
m h hdF
Ea
dh
between that given by Eq. (18) is not unexpected. In fact, Tankaka and Koguchi [35] and Bolshakov
and Pharr [36] have shown that
2
1
|
m h hdF
Ea
dh
is about 2.09 and 2.16, respectively, after taking into account the finite radial
displacements of points along the surface of contact. While their analyses were for conical indentation in elastic solids [35], Eq. (18) can be generalized to elastic–plastic solids with work-hardening. Taking into account these corrections, the unloading slope equation is typically written as
2
2
|
1
m h hdF
E
A
dh
(19)where b is found to be somewhat greater than 1 for a Berkovich indenter. Oliver and Pharr have recently [35] reviewed the improvements made to their procedure since the publication of their
method for estimating the contact area under load is the procedure proposed by Oliver and Pharr [2] for estimating the contact depth from the initial unloading slope. The above dimensional and finite element analysis provide an opportunity to methodically evaluate this procedure. Based on the results of Sneddon [10] on the shape of the surface outside the area of elastic contacts for an indenter of conical and paraboloid of revolution, Oliver and Pharr developed an expression for, hc, at the indenter displacement, hm,
m
c m
m
F
h
h
dF
dh
(20)
where Fm and (dF/dh)m are the respective load and the initial slope of the unloading curve at the
indenter displacement depth, hm. The numerical value of x is 0.72 for conical indenter, 0.75 for the paraboloid of revolution, and 1.0 for flat punch. Although Eq. (20) was derived from solutions to elastic contact problems, it has been used to estimate contact depth for general elastic–plastic solids. The implicit assumption is that unloading is elastic at least during the initial stage of unloading. This assumption warrants a close inspection, because the contact condition prior to unloading is not the same as that for elastic contacts due to plastic deformation during loading.
For materials with a wide range of Y/E (e.g., 10_4 to 10_2), such as metals, the Oliver and Pharr procedure should be used with caution. For example, the procedure is approximately correct for most Y/E values if the work-hardening exponent is approximately 0.3 However, the procedure underestimates the contact area for elastic-perfectly plastic solids over most Y/E values. The error is most significant when piling-up occurs, i.e., hc/hm > 1. In fact, the contact depth, hc, estimated using Eq. (20) is always less than 1. It should also be noted that Eq. (20) could also overestimate contact area for materials with a large work-hardening exponent, ). Similar conclusions have also been obtained by Bolshakov and Pharr [37]. Thus, the Oliver–Pharr procedure should be used with caution when piling up occurs. The piling up problem is most severe when Y/E is small and n is close to zero, which is also the condition for little elastic recovery or rebound upon unloading, i.e., hf/hm _ 1. Consequently, the contact area under load is well approximated by that of residual indents. The shape and size of the indents after unloading can be measured using techniques such as atomic force microscopy, scanning electron microscopy, and optical profilometry. Following this line of thinking, we have developed a method [38] that consists of imaging surface profiles and measuring load–displacement curves, circumventing the problem of piling-up .
E. Work Of Indentation
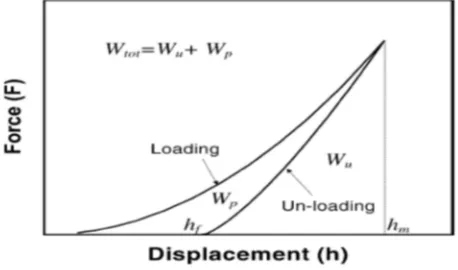
By integrating the loading and unloading curves, the work of indentation can be readily obtained. Specifically, the area under the loading curve is the total work, Wtot; the area under the unloading curve is the reversible work, Wu; and the area enclosed by the loading and unloading curve is the irreversible work, Wp (see Fig. 2) of indentation. Obviously,
Wtot = Wu + Wp (21)
Less obvious, however, are their physical meaning and significance. How do reversible and irreversible work relate to the mechanical properties of solids? Do they provide new information about indentation-induced elastic and plastic deformation?
Several authors have previously explored correlations between Wp/Wtot and hf/hm. Lawn and Howes [39] studied the elastic
recovery effect in the indentation of several ceramic materials and steels. By assuming that the respective loading and unloading
curves are given by F =Ah2 and
F
b h h
(
f)
m , where A and B are constants, a relationship between Wp/Wtot and hf/hm was [image:7.612.182.411.586.721.2]obtained
Loubet et al. [1] and Mencik and Swain [3] have also explored the relationship between Wp/ Wtot and hf/hm.. By assuming that the respective loading and unloading curves are given by Eqs. (8) and (17), a relationship between Wp/Wtot and hf/hm is then given by several methods exist that corroborate a correlation between Wp/Wtot and hf/hm. This relationship is independent of indenter geometry (y). It is also explicitly independent of the details of the materials properties, and the stress distribution under the self-similar indenters. The advantage of the approach based on dimensional analysis and finite element calculation is that it does not rely on the assumptions about the shape of the indentation loading and unloading curves. This one-to-one correspondence suggests that Wp/Wtot and hf/hm contain the same information about the mechanical properties of materials so far as indentation tests are concerned. The measurement of one leads to another. In practice, however, the determination of Wp and Wtot can be made more accurately than that of hf, since the former is from the integration of loading–unloading curves and the latter is from the estimate of a single point on the unloading curve. A potential application of this correlation is to predict surface deformation based on the work of indentation and vise versa.
F. Probing Stress–Strain Relationships
[image:8.612.236.394.544.703.2]We have seen from previous sections that hardness is a function of the mechanical properties, as well as indenter geometry. There can be multiple combinations of mechanical properties, such as E, Y, and n, that give rise to the same hardness values even when the indenter geometry is the same. Furthermore, hardness usually cannot be directly used in modeling unless it is converted to a yield strength. Thus, it is highly desirable to go beyond the measurement of hardness. Probing the local stress–strain behavior of materials by indentation has in recent years become a focal point of interest in the indentation literature [48]. One of the main questions we discuss in this section is whether it is possible to obtain the fundamental mechanical behavior from instrumented indentation experiments, an issue evidently was taken for granted until recently [49]. Dimensional analysis has made this question tractable. We have seen that ‘‘in principle’’ a unique loading and unloading curve can be obtained either from calculations or experiments for a given set of material properties (i.e., E, n, Y, and n) and indenter geometry (y). In practice, this ‘‘uniqueness’’ is, of course, subject to numerical or experimental errors. But, we have no doubt that the load–displacement curve for the same sample measured using the same indenter and instrument is reproducible everyday and anywhere. Likewise, the calculated load– displacement curves should be the same using numerical methods based on the same theory. Thus, we say that this ‘‘direct problem’’ of generating indentation loading–unloading curves from given material properties and indenter geometry is unique. We now consider the reverse process of deducing the material properties, i.e., E, n, Y, and n, from a loading–unloading curve generated by a prescribed indenter y. The uniqueness of this ‘‘inverse problem’’ should not be taken for granted. Indeed, the non-uniqueness has been demonstrated with help from dimensional analysis either by examples [49] or by statistical methods [506]. Fig. 20a and b are some of the examples that illustrate the non-uniqueness of this inverse problem [49]. They were constructed using finite element calculations with input parameters selected based on the scaling functions for the loading curves , initial unloading slopes , final depth , or work of indentation . These examples demonstrated that for each indenter (i.e., fixed y) and given n and E values, there is a range of values of Y and n for which the calculated loading and unloading curves are virtually indistinguishable. The sensitivity of the inverse process was further examined through a series of finite element calculation and statistical methods [50].
Searches the global parameter space. All three approaches demonstrate that 1% noise levels preclude the accurate determination of Y and n based on a single force–displacement curve. An example is shown in Fig. 21. Therefore, loading and unloading curves from conical indentation alone cannot uniquely determine stress–strain relationships. Since pyramidal indenters are also geometrically self-similar, scaling relationships such as those for conical indenters exist [5]. Furthermore, since previous numerical work has shown that the loading and unloading curves are the same for pyramidal and conical indentation, provided that the volume-to-depth relationships are the same for the two types of indenters [51]. Consequently, loading and unloading curves from pyramidal indentation alone also cannot uniquely determine stress–strain relationships. This non-uniqueness is not surprising, considering that many features of loading–unloading curves are related to each other, such as Wu/Wtot, hf/hm, and H/E*, making the
IV. SUMMARY
We have provided an overview of the basic concepts of the modeling of instrumented indentation in elastic–plastic solids, we have answered many of the basic questions posted in the Introduction section of this review.
For indentation in elastic–plastic solids, we introduced equations for loading–unloading curves; identified parameters controlling piling-up and sinking-in; established relationships between hardness, mechanical properties, and indenter geometry; examined methods for estimating contact area from initial unloading slopes; discovered relationships between hardness, elastic modulus, and the work of indentation; and identified the limitations and possibilities of deducing stress–strain relations from load–displacement curves.
REFERENCES
[1] J.L. Loubet, J.M. Georges, O. Marchesini, G. Meille, J. Tribol. 106 (1984) 43. [2] W.C. Oliver, G.M. Pharr, J. Mater. Res. 7 (1992) 1564.
[3] J. Mencik, M.V. Swain, Mater. Forum 18 (1994) 277. [4] Y.-T. Cheng, C.-M. Cheng, Phil. Mag. Lett. 77 (1998) 39. [5] Y.-T. Cheng, C.-M. Cheng, J. Appl. Phys. 84 (1998) 1284.
[6] Y.C. Fung, P. Tung, Classical and Computational Solid Mechanics, World Scientific, Singapore, 2001. [7] G. Dieter, Mechanical Metallurgy, second ed., McGraw-Hill, New York, 1976.
[8] A.E.H. Love, Quat. Math. (Oxford) 10 (1939) 161.
[9] J.W. Harding, I.N. Sneddon, Proc. Camb. Phil. Soc. 41 (1945) 16. [10] I.N. Sneddon, Int. J. Eng. Sci. 3 (1965) 47.
[11] D. Tabor, Rev. Phys. Technol. 1 (1970) 145.
[12] J.L. Loubet, J.M. Georges, J. Meille, in: P.J. Blau, B.R. Lawn (Eds.), Microindentation Techniques in Materials Science and Engineering, American Society for Testing and Materials, Philadelphia, 1986, p. 92.
[13] A.E. Giannakopoulos, P.-L. Larsson, R. Vestergaard, Int. J. Solids Struct. 31 (1994) 2679. [14] M. Sakai, Acta Metall. Mater. 41 (1993) 1751.
[15] B. Rother, Surf. Coat. Technol. 86–87 (1996) 535.
[16] S.V. Hainsworth, H.W. Chandler, T.F. Page, J. Mater. Res. 11 (1996) 1987. [17] J. Malzbender, G. de With, J. den Toonder, J. Mater. Res. 15 (2000) 1209. [18] M. Troyon, M. Martin, Appl. Phys. Lett. 83 (2003) 863.
[19] Z.Y. Li, S. Chandrasekar, H.T. Yang, J. Appl. Mech. 69 (2002) 394. [20] Y.-T. Cheng, C.-M. Cheng, J. Mater. Res. 13 (1998) 1059. [21] S. Sun, S. Zheng, T. Bell, J. Smith, Phil. Mag. Lett. 79 (1999) 649. [22] A.L. Norbury, T. Samuel, J. Iron Steel Inst. 117 (1928) 673. [23] Y.-T. Cheng, C.-M. Cheng, Phil. Mag. Lett. 78 (1998) 115. [24] R.F. Bishop, R. Hill, N.F. Motts, Proc. Phys. Soc. 57 (1945) 147. [25] D.M. Marsh, Proc. R. Soc. A279 (1964) 420.
[26] K.L. Johnson, J. Mech. Phys. Solids 18 (1970) 115. [27] E.H. Yoffe, Phil. Mag. A46 (1983) 617.
[28] D. Tabor, Proc. R. Soc. Lond. A192 (1948) 247. [29] M.M. Chaudhri, Acta Mater. 46 (1998) 3047.
[30] D. Tabor, in: P.J. Blau, B.R. Lawn (Eds.), Microindentation Techniques in Materials Science and Engineering, American Society for Testing and Materials, Philadelphia, 1986, p. 129.
[31] A.G. Atkins, D. Tabor, J. Mech. Phys. Solids 13 (1965) 149. [32] Y.-T. Cheng, Z. Li, J. Mater. Res. 15 (2000) 2830.
[33] A. Bolshakov, W.C. Oliver, G.M. Pharr, Mater. Res. Soc. Symp. Proc. 356 (1995) 675. [34] J. Woirgard, J-C. Dargenton, J. Mater. Res. 12 (1997) 2455.
[35] K. Tanaka, H. Koguchi, Jpn. J. Tribol. 40 (1995) 129.
[38] Z. Li, Y.-T. Cheng, H.T. Yang, S. Chandrasekar, Surf, Coat. Technol. 154 (2002) 124. [39] Y.-T. Cheng, Z. Li, C.-M. Cheng, Phil. Mag. A 82 (2002) 1821.
[40] J.A. Williams, Engineering Tribology, Oxford University Press, Oxford, 1994. [41] D.B. Marshall, T. Noma, A.G. Evans, J. Am. Ceram. Soc. 65 (1982) C-175. [42] A. Leyland, A. Matthews, Wear 246 (2000) 1.
[43] N.A. Stilwell, D. Tabor, Proc. Phys. Soc. Lond. 78 (1961) 169.
[44] A.M. Korsunsky, M.R. McGurk, S.J. Bull, T.F. Page, Surf. Coat. Technol. 99 (1998) 171. [45] A.E. Giannakopoulos, S. Suresh, Scripta Mater. 40 (1999) 1191.
[46] J. Malzbender, J. Eur. Ceram. Soc. 23 (2003) 1355.
[47] W. Ni, Y.-T. Cheng, C.-M. Cheng, D.S. Grummon, J. Mater. Res. 19 (2004) 149. [48] Y.-T. Cheng, C.-M. Cheng, J. Mater. Res. 14 (1999) 3493.
[49] T.W. Capehart, Y.-T. Cheng, J. Mater. Res. 18 (2003) 827.
![Fig. 4. For a given indenter geometry (i.e., fixed y) there exist overlapping loading and unloading curves: (a) for highly elastic solids (i.e., large Y/E) and (b) for highly plastic solids (i.e., small Y/E) [49]](https://thumb-us.123doks.com/thumbv2/123dok_us/1250060.651786/8.612.236.394.544.703/indenter-geometry-overlapping-loading-unloading-elastic-solids-plastic.webp)
