With 12 text-figures Printed in Great Britain
FROG FAST MUSCLE
I. MECHANICAL POWER OUTPUT IN ISOTONIC TWITCHES BY C. J. PENNYCUICK
Department of Zoology, University of Cambridge
(Received 15 June 1963)
INTRODUCTION
The results of most experiments in muscle physiology may be interpreted either from an analytic point of view, in which they are regarded as descriptions of behaviour which must be reproduced by a hypothetical model of the muscle mechanism, or from a synthetic point of view where the object is to describe how the muscle behaves under particular conditions of load and stimulus. The first (and more usual) approach is designed to unravel the underlying mechanism by which the muscle works, while the second is concerned with the muscle as a unit, and seeks to describe the way in which it interacts with other parts of the body, and with the environment.
The present study is primarily concerned with the synthetic aspect. The question originally asked was: given a particular muscle, to which is attached a load of known properties (mass, viscous resistance, compliance...), then with what changes of length and tension will the system respond to a given series of impulses in the motor nerve? Or, expressing the same question conversely: if the muscle, attached to the known load as before, is required to cany out a given movement, then what series of impulses must be applied to the nerve? The synthetic nature of the question arises in that the answer to it must be reflected in the properties of the animal's central nervous system, which has to generate instructions to particular muscles to carry out particular movements, coded in terms of series of impulses in the respective motor nerves.
Clearly, different types of muscles' interpret' the motor signals sent to them in widely different ways; for instance, the responses of mammalian striated muscle, molluscan smooth muscle and insect fibrillar muscle to identical motor signals would generally be so qualitatively different as to require entirely different methods of description. The type of muscle considered here is frog fast muscle ('twitch fibres'), and the method of treatment is intended to be suitable for any muscle in which one motor nerve impulse gives rise to one propagated action potential in a muscle fibre or group of muscle fibres.
92 C. J. PENNYCUICK
interrupted by another stimulus, and so on. Between each pair of stimuli a certain amount of work (possibly negative) is done by the muscle, and the object of the inquiry is to predict this amount, and how it is divided into work done on the load and that done in stretching the muscle's internal series compliance. Clearly, such a prediction calls for a knowledge of how power output, tension, and any other quantities found to be relevant, are interrelated at every instant throughout the entire cycle of a twitch.
THE RISE AND FALL OF 'ACTIVE STATE'
The concepts with the aid of which the contraction of this type of muscle has been described in recent years have been derived primarily from the analytical approach, and it is instructive to consider, with the other point of view in mind, to what extent they can be used to predict the behaviour of a muscle at any time during the cycle of a twitch.
Components of muscle
According to the scheme developed by Hill (1938), a muscle may be analysed into the following components:
(1) A contractile component, capable of developing tension and doing mechanical work by shortening against tension.
(2) A series-elastic component which is stretched by the contractile component when tension is built up. Its compliance need not be constant under changing tension. It is not necessarily thought of as being anatomically distinct from the contractile component, but the compliance of the tendons at either end of vertebrate skeletal muscle naturally makes a large contribution to it.
(3) A parallel-elastic component, thought to reside in the sarcolemma and also in the connective tissue around and within the muscle. This element only produces a signi-ficant tension when the muscle is stretched beyond its normal length in the body, and will not be further considered.
The active state
This model of a muscle is brought to life, as it were, by the concept of the ' active state'. It is obvious that the properties of any muscle change for a while after stimula-tion, and the change is held to take place in the contractile component which is extremely compliant in the resting, unstimulated state. On stimulation there is a latent period, after which the muscle suddenly becomes relatively highly inextensible and capable of doing positive work. These properties then gradually decline, until eventually the resting extensible condition is re-established.
Hill (1938) distinguished the 'active' from the 'resting' state on the ground that in the former the tension in the muscle and the speed of shortening of the contractile component are uniquely related by a characteristic relationship. When determining empirically this relationship between tension and shortening speed, he explicitly confined his attention to the fully active condition of the muscle, which he obtained by subjecting it to stimuli at a high rate (tetanus). The resulting curve thus refers only to the momentary state of the muscle immediately after the arrival of a stimulus.
the two extreme states—'fully active' and 'resting'. The notion of active state as a single quantity which can be measured, and whose decline during a twitch accounts for the observed changes of length and tension, has led to a number of experiments in which a particular quantity which seemed to have promising characteristics was identified, named 'active state', and its time course measured.
In the simplest of these, deriving from the experiments of Gasser & Hill (1924), a quick stretch was applied to the muscle at various times after the stimulus, and the resulting rise of tension was measured. Hill (1951a) initially described the results simply as showing that there is an abrupt decrease of extensibility at a certain time after the stimulus, but later he (1953 b) and others (e.g. Ritchie, 1954) have interpreted them more deeply as indicating the time course of the active state, and have thus come to consider in what units active state should be measured. Ritchie (1954), following Hill (1949, 1950), defines the magnitude of the active state at any moment as that tension which the contractile component can bear without either shortening or lengthen-ing ; in an isometric contraction it is then that tension at which rate of change of tension is momentarily zero. Active state is thus measured in grams weight.
The limitations of this view were already recognized by Hill (1951c), who pointed out that the ability to shorten is also a feature of the active state, and showed that the speed of shortening rose to its maximum within a time too short to be resolved by his apparatus after the end of the latent period. This was interpreted as another indication that the active state rises abruptly to its full value, but no attempt was made to re-define active state in more general terms, so that its value might be determined from experiments under conditions other than isometric.
The beginning of the change of state which follows the initial burst of activity in a twitch has been identified by various direct methods, for instance, as the point where the isometric myogram for a twitch begins to diverge from that for a tetanus (Macpher-son & Wilkie, 1954), or the point where tension in a twitch during release at a constant speed drops below the tension in a tetanus under similar conditions (Hill, 1953 a). These experiments have been interpreted as identifying the beginning of the decline of the active state.
The later time course of this supposed quantity has been investigated in a very roundabout experiment by Ritchie (1954), who quick-released a muscle at various times during the decline of tension in an isometric twitch, by an amount sufficient to allow its tension to drop to zero. The tension then built up again to a new maximum before again declining, and the tension at this maximum was regarded as the magnitude of the active state at that moment. As Pringle (i960) has pointed out, it is implicit in the design of this experiment that active state shall by definition be unaffected by quick releases. The peak tension measured may be regarded as the time integral of rate of change of tension from the end of the quick release until peak tension is reached, and it will be shown later that this quantity is affected by changes of tension.
The notion of an active state defined in terms of tension was carried to its conclusion by Ritchie & Wilkie (1958). They started with Hill's equation relating isotonic speed of shortening to tension
= b(P0
94 C. J. PENNYCUICK
be developed isometrically, and a and b are constants. This equation applies to the tetanus, and hence to the initial moment only of the twitch. It was assumed that the form of the equation and the constants a and b remain the same throughout the twitch, and the declining activity is represented solely by decreasing Po. The value of Po as
a function of time was obtained from an 'active state' curve prepared by Ritchie's method. Two further relationships were required to complete the analysis: the varia-tion of Po with muscle length, and the tension vs. extension curve for the series-elastic
component.
All four sets of measurements were made on the same muscle, and were used, with the aid of an analogue computer, to predict the time course of muscle length during the shortening phase of an isotonic twitch (i.e. until the speed reached zero). The result was compared with an actual isotonic twitch, again made by the same muscle. The actual and predicted twitches differed to an extent which the authors considered unsatisfactory, and the conclusion seems inescapable that their hypothesis does not correctly describe the twitch.
Jewell & Wilkie (i960), reconsidering the 'active state' concept, compared twitches against a variety of different types of load, considered various measurable quantities which decline during the latter part of a twitch, and concluded that 'no particular one can claim to be the index of declining activity'. However, they do not seem to have ex-plicitly abandoned the idea of ' activity' as some process in the muscle which rises to a peak at the beginning of the twitch and then declines, going through its cycle of changes unaffected by mechanical changes in the muscle—they state only that they cannot identify any quantity which gives a practical measure of this ' activity'. In the present paper it is not assumed that 'activity' has any meaning in this sense.
Equivalence of contractions against different types of load
There is a further assumption, originating from Hill (1938), which has been inherent in many subsequent experiments on muscle, especially those concerned with the internal series compliance. This is that the speed of shortening of the contractile component depends solely on the tension applied to it, and some quantity such as ' active state'. Hill (1938) made this assumption for the tetanus only, and showed that it gave plausible agreement between the observed rise of tension in an isometric tetanus and that predicted from the isotonic force vs. velocity curve combined with an estimate of the internal series compliance. The assumption appears to have gone unchallenged until Jewell & Wilkie (1958) repeated Hill's prediction of the isometric tetanus, for the first time measuring all the quantities used in the prediction on the same individual muscle. A large discrepancy was found between observed and predicted curves. Their calculation, as they remark, 'appears to be based on perfectly sensible premises', and extreme care was taken with details of technique. Their result thus throws grave doubts on the validity of the above assumption in the case of the tetanus, and its validity in later parts of the twitch will be investigated in a further paper.
definite delay, which was constant for a given muscle at a given temperature. This points to a feedback mechanism with a delay in the feedback path. The quantity 'activation'proposed byPringle(i9.6o) to account for this would notonlyberesponsible for the mechanical activity of the muscle, but would also be affected in turn by mechan-ical changes brought about by the contraction.
Object of experiment
The relationship between speed of shortening and tension in an isotonic tetanus has been investigated in several animals by various authors (Hill, 1938; Katz, 1939; Wilkie, 1950) and much discussed and interpreted. It has been mentioned that the resulting curve refers only to the initial moment of the twitch, and it seemed of interest to determine a series of similar curves later in the cycle. This involves measuring the speed of shortening at frequent intervals as the twitch proceeds. The curve for a given time after the stimulus is then prepared by taking the speed at that time from a series of twitches at different tensions.
MATERIALS AND METHODS
The experiments were carried out on the ilio-fibularis (biceps cruris) of the frog
Rana temporaria. This muscle may seem an odd choice for the study of twitch fibres
since it is well known to contain about 10 % of slow fibres (Kuffler & Gerard, 1947; Giinther, 1949). However, the data given by Kuffler & Vaughan Williams (1953) for the slow fibres show that they would not come into play in the present experiments for the following reasons. (1) A tetanus lasting 20 sec. was necessary to develop the full isometric tension in these fibres. Stimulation in the present experiments lasted o-i sec., with three stimuli only, in which time no detectable response would occur in the slow fibres. (2) All experiments began at a resting tension of 5 g. wt., which is above the optimum for the slow fibres (C-3-C7 g. wt.). They would only be able to develop a part of their maximum tension under these conditions. (3) The maximum isometric tension observed for the slow fibres of an ilio-fibularis weighing 70 mg. was 2-7 g. wt., which would be of the order of 5 % of the maximum tension attainable in an isometric tetanus of the whole muscle, so the effects would be small even if present. These results relate to isometric tension, but the isotonic shortening speeds of which the slow fibres are capable are also much slower, and they would not be expected to be able to develop any tension at the speeds of shortening observed in the present experiments. It was therefore not thought necessary to exclude the slow fibres from stimulation.
Stimulation
96 C. J. PENNYCUICK
by means of a time switch, which was arranged to start the stimulator at the beginning of the interval between two stimuli: thus the stimuli always appeared in the same places on the screen in a series of records.
The use of supramaximal volleys in the nerve was intended to ensure that every muscle fibre was maximally stimulated at the same time. In muscles where single fibres are
Fig. 1. Diagram of apparatus, b, brake; bp, base plate; c, clamp; en, cotton; d, damping plate; e, electrodes; ec, elastic; It, length transducer; m, electromagnet, also serving as long stop for length-transducer lever; p, paraffin layer; r, Ringer's solution, inlet and outlet indicated by arrows; tp, scale pan; ss, short stop of length-transducer lever; tt, tension trans-ducer; to, wire connecting muscle to length-transducer lever and thence to elastic.
Arrangement of apparatus
The muscle was mounted vertically in a cylindrical Perspex bath 2 in. in diameter. The arrangement is shown in Fig. i. The distal tendon was held in a Perspex clamp at the bottom, which was connected through a thin rubber diaphragm to a tension trans-ducer mounted underneath the bath. This transtrans-ducer was thus loaded by the mass of liquid in the bath, but as it deflected only about 25^ for 70 g. wt. (which was seldom exceeded) this did not significantly affect its response.
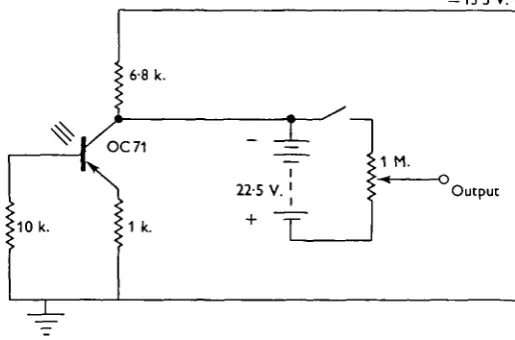
-13-5 V.
6-8 k.
+
T
[image:7.451.95.353.180.350.2]1 M.
22-5 V. ] | " * "Output
Fig. 2. Circuit of length and tension transducers. Light is focused on the emitter-base junction of the transistor, after scraping a hole in the paint. From Machin (1959).
A small piece of ilium was left attached to the proximal end of the muscle, and a length of 36 s.w.g. enamelled copper wire was knotted round the tendon below this. The wire was connected to the lever of the length transducer, and thence to a length of elastic which passed over a pulley, and was then joined to a piece of cotton passing over a second pulley, on the end of which was a pan weighing 5 g., the lowest tension used. Isotonic tension was set by stretching the elastic by additional weights, and then locking the second pulley with a brake in order to avoid movement and oscillation of the scale pan. Over the range of shortening allowed, the elastic kept the tension constant within about 3 % at the lowest tension, and less at higher tensions.
Measurement of length and speed
The length-transducer lever was arranged to interrupt a beam of parallel light, which was then focused on a phototransistor in the temperature-compensated circuit of Fig. 2 (Machin, 1959), giving a voltage output proportional to muscle length. This was calibrated with a micrometer, and found to be linear over the range used, within the limits of measurement.
Most authors measuring speed of shortening have recorded length vs. time and measured the slope of the record, a method which may be adequate where the velocity-is constant over a considerable length of record, but velocity-is not suitable for measuring a continually changing velocity at frequent intervals. Abbott & Wilkie (1953), in order
98 C. J. PENNYCUICK
to test the validity of this procedure, tried drawing tangents by eye to known curves, and found they made large errors in estimating the slope. They therefore differentiated the output of their length transducer with a passive CR network, which is a valid method provided that the time constant of the network is short compared with the highest frequency of interest in the signal. In the present experiments the length output was differentiated by a feedback method commonly used in analogue computers
R
www-Amplifier -OVQ
6SL7 6SL7 + 240V.
Fig. 3. (a) With a phase-reversing d.c. amplifier, this arrangement results in Vo = RCidVJdt).
(6) Amplifier circuit. From Clayton (i960). The circuit works equally well with ECC 83 valves.
(Wass, 1955). The circuit, recommended by Clayton (i960), is shown in Fig. 3ft, and gives a voltage output proportional to the speed at which the lever is moving. This was calibrated by observing the peak deflexions when the lever was moved sinusoidally by a cam rotating at various speeds (this cam was also used for checking the calibration of the length transducer after each experiment). The time constant of the arrangement is the product of the output resistance of the transducer and the input capacitance of the differentiator. The former was about 6-5 k£2, and the largest input capacitance used was 0-005 M^"., giving a time constant of about 3 x io~6 sec.
Equivalent mass of lever
equivalent mass of over 6 g., while an acceleration of about 170 cm./sec.2 gave about 3 g. The measurements used in the argument were not made in the phases of the twitch where these high accelerations occurred, and there was never any detectable change of tension in the parts of the twitch being studied, in which the equivalent mass may be assumed to have been of the order of 1 g. This is still high compared with calculated figures given by previous authors (e.g. Jewell & Wilkie (1958), 200 mg.; Podolsky (i960), 170 mg.) and was doubtless responsible for the oscillations which can be seen on the records. These were partly suppressed by impaling a disk of shim brass f in. in diameter on the connecting wire where it passed through the paraffin layer. Measure-ments were made from the records by drawing a line through the middle of the oscillations.
Magnetic release
In the interests of speed and simplicity the magnet was made to hold the lever up directly, as opposed to the more usual arrangement in which it is made to withdraw a catch. The electromagnet out of a Siemens high speed relay was mounted as shown in Fig. 1 so as to form the long stop of the length-transducer lever. A piece of soft iron from the relay armature was glued to the lever with Araldite. The current through the magnet coil was variable, and was set to restrain the lever against a force rather greater than the maximum likely to be applied to it—usually about 70 g. wt. The magnet was connected in the screen circuit of a Miller sweep generator, and was arranged to come 'on' 50 msec, before the first stimulus was delivered to the muscle. The magnet remained on for a preset time, and was then turned off, releasing the muscle.
Measurement of tension
The tension transducer was based on torsion of a piece of clock spring, carrying a vane which interrupted a beam of parallel light as in the length transducer. The same circuit was used (Fig. 2).
. Display and recording
A Cossor 1049 Mk. IV oscilloscope was used, with the time base externally triggered for single sweeps. An illuminated graticule was made by ruling a grid on a piece of Perspex, spaced so as to give 1 o msec./division at the sweep speed used; this was checked by 50 cyc./sec. intensity modulation of the beam. The tube face was photographed on
z\ in. square negatives with a single-lens reflex camera. All calibrations were carried
out by counting graticule divisions on the focusing screen of the camera, thus avoiding parallax errors, and rendering unnecessary any allowance for the scale of enlargement of prints from the negatives.
Ringer's solution
The muscle was immersed in the solution recommended by Jewell & Wilkie (1958), containing (min/l.): NaCl, 115-5; KC1, 2-0; CaClj,, i-8; Na phosphate buffer, 2. The phosphates were adjusted to give pH = 7-0.
Temperature and aeration
About 0-5 1. of solution was used in the system, and this was continuously circulated through the muscle bath, whose capacity was about 100 c.c. The pump was of the 'air lift* type, which also aerates the solution. The compressed air for this came
IOO C. J. PENNYCUICK
from the laboratory main, and was filtered through a cotton-wool pad. The greater part of the circulating fluid was held in a thermally insulated beaker containing a sealed glass vessel full of ethylene diamine (NH2. CHJJ . CHj. NHa), whose melting
point is io° C. The ethylene diamine was kept in a refrigerator between experiments, and, on immersing the vessel, was quickly brought to its melting point, whereafter it acted as a thermal buffer. The temperature range was chosen to secure slower response than would have been obtained at room temperature, without going down to a temper-ature at which frogs hibernate.
Procedure
The experiment was started as soon as the temperature in the muscle bath, which was noted each minute, settled down to a steady value—usually about 45 min. after pithing the frog, and 30 min. after immersing the muscle in Ringer's solution. One or two twitches were given during the cooling-down period to check correct operation of the triggering circuits, transducers and differentiating circuit. Observations were made at intervals of either i o r i | min., and a predetermined sequence of recordings was run through, the temperature being noted after each observation. Immediately after the last observation the calibration of the tension and length transducers was checked with the muscle still in the bath. The bath was then drained, and the muscle was removed and weighed.
RESULTS
Basis of observations
In an isotonic twitch the velocity typically becomes first positive, then zero, then negative, so clearly no single relation between speed and tension can hold throughout the twitch. However, it may be assumed that at any given time measured from the stimulus there is such a relationship, the whole curve changing from moment to moment. Working on this assumption, the muscle was made to perform isotonic twitches at a series of different tensions and the speed of shortening was measured at intervals of 10 msec. Hence, at a given time after the stimulus, a speed vs. tension curve could be built up by reference to each isotonic record in turn. The result is a family of such curves, with time after stimulus as parameter.
Form of the isotonic twitch
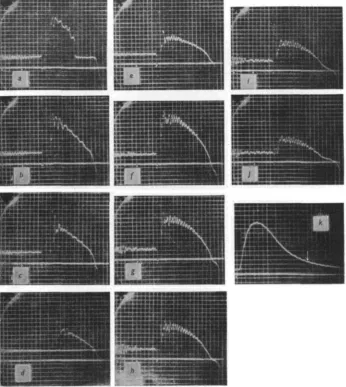
Fig. 4 shows a set of isotonic twitches recorded in the manner described. The end of the latent period is marked by a rise of the speed of shortening to its maximum in about 5-9 msec, whereupon the acceleration abruptly ceases. According to Abbott & Ritchie (1951) the velocity would rise to its maximum instantaneously if all parts of the muscle were stimulated simultaneously, and the time taken in acceleration is due
Fig. 4(0-3). Isotonic twitches. Upper trace: speed, shortening upwards. Lower trace: stimuli. The lever was here released at the time the last stimulus left the stimulator, Le. 5-10 msec before it reached the muscle. The initial oscillations were reduced in other experiments by releasing 10 msec, or so earlier. Decrease of speed checks slightly before velocity break (visible in e-j). Shortening allowed was insufficient in a. Tensions in g. wt.: a, 5; b, 10; c, 15; d, 20; e, 2s;f, 3O;g, 3s; h, 4o;i, 45; /, 50. Scale:*, 10 msec, per division ;y(a-t), 0-432 cm./sec per div.; (j-j), 0-157 cm./sec. per div.
102 C. J. PENNYCUICK
to propagation of the action potentials; the acceleration time is independent of tension, as would be expected on this view. The term 'latent period' here includes conduction time in a variable length of nerve, so although it was constant for a particular pre-paration, it naturally varied from one preparation to the next. Times ' after stimulus' are therefore actually measured from the end of the acceleration.
[image:12.451.45.411.210.356.2]At the lower tensions, after acceleration is complete, the velocity immediately starts slowly to decrease, and the speed vs. time curve slopes steadily more steeply downwards until the muscle is slowly lengthening. There is then a discontinuity—the smooth decrease of speed down to some negative value ends abruptly in a sudden lengthening acceleration which may exceed 15 muscle lengths per sec.2 This occurs earlier at
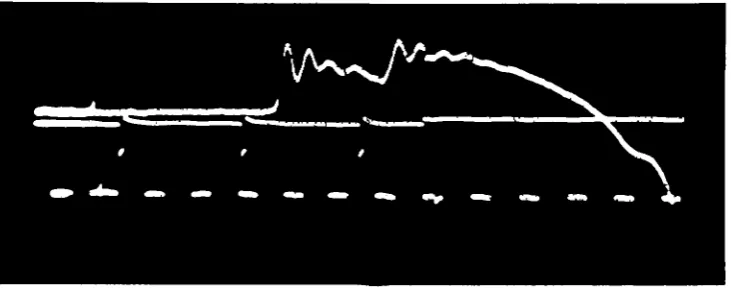
Fig. 5. Upper trace: speed, shortening upwards. Lower trace: stimuli. Time marks: 50 eye./sec. intensity modulation. Isotonic contraction at 22'S g. wt., showing check in decrease of shortening speed before velocity break.
low than at high tensions. At high tensions the decreasing trend of the speed curve generally checks a few msec, before the break (Fig. 5). This 'break' in the speed record indicates that the high extensibility characteristic of the resting state is restored very suddenly at the end of an isotonic twitch, in marked contrast to the end of an isometric twitch, for example (Jewell & Wilkie, i960).
The variation with tension of the speed vs. time trace will now be considered from various points of view.
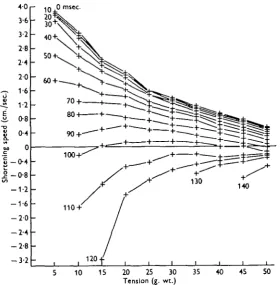
Speed vs. tension curves
lengthening at all tensions. By this time, however, the velocity break has interrupted contraction at the lower tensions, so the last members of the series are incomplete, with only the high tension end represented.
0 msec.
[image:13.451.88.369.116.402.2]20 25 30 Tension (g. wt.)
Fig. 6. Curve* of shortening speed vs. tension, plotted from Fig. 4. The first curve is taken immediately on completion of the initial acceleration, and the others later in the twitch, at the times marked. Only the first few curves resemble the tetanu* curve: at 100 msec, the muscle is still shortening at medium tensions, but lengthening at low and high tension*. Each column of points represents one twitch. Muscle weight, 74 mg.; resting length, 25 mm.
Power vs. tension curves
For the purpose of comparing performance under different types of load it is more convenient to express the data in the form of mechanical power output (force x velocity), and Fig. 7 shows the same data as Fig. 6, plotted in this way. Hill (1938) showed that his characteristic equation, expressed in this form, has a maximum at a particular tension, and this humped curve now appears as the first member of the series. Later members are approximately parallel to the first for about 100 msec., after which the low tension end begins to drop, and velocity breaks appear.
Speed and power vs. time
104 C. J. PENNYCUICK
form, with the ordinate scaled down. Indeed the velocity reaches zero sooner at low than at medium tensions, giving the humped speed vs. tension curves already mentioned.
i
4 r -- 5
20 25 30 Tension (g. wt.)
50
Fig. 7. The same data as in Fig. 6, expressed as mechanical power output vs. tension. Up to ioo msec, successive curves are approximately parallel to one another. Circle shows the time and tension at which zero power occurred in the isometric twitch by the same muscle in Fig. 4 A.
^ , I 30 g. wt.
i
0 10 20 30 40 50 60 70 80 90 100 110 120 Time (msec.)
If the oscilloscope traces are converted into power by multiplying the ordinates by the appropriate tensions, they become plots of power vs. time, with tension as para-meter. Over the central range of tensions used the form of the curve is almost independent of tension, as can be seen by comparing the columns of points at 20, 25, 30 and 35 g. wt. in Fig. 7. In Fig. 8 the observations at 10, 30 and 50 g. wt. are plotted as power vs. time. The curves for 20, 25 and 35 g. wt. are hardly distinguishable from that for 30 g. wt., and the others are intermediate between these and the end members shown.
It can be seen that for any given time up to 100 msec, the mechanical power output is less at high and low than at medium tensions, but the slopes of the curves are much the same, that is, the rate of decrease of power is a function of time, but is virtually independent of tension. This ceases to be true towards the end of the twitch, where the velocity break intervenes at low tensions, while at the highest tensions there is a decrease of slope, the break being off the end of the record in this case.
£ x
c v *
10 20 30 50
[image:15.451.90.373.255.404.2]Isotonlc tension (g. wt.)
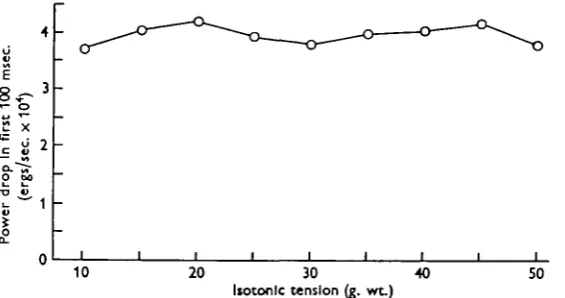
Fig. 9. Over the first i oo msec, the decrease of power output may be regarded as independent of tension.
Power run-down rate
The difference of power between two consecutive points in a column of Fig. 7 constitutes an estimate of the average rate of decrease of power (power run-down rate) over a period of 10 msec. By n o msec., power has started to drop more rapidly at the low than at the high tension end, but the 100 msec, curve is approximately parallel to that for zero time. The drop of power over the first 100 msec, is plotted against time in Fig. 9, and it can be seen that it is more or less independent of tension. It is therefore legitimate to display the variation with time of power run-down rate by averaging the power decrements for each interval of 10 msec, over all the tensions used. Nine estimates of average run-down rate, centred at 5, 15, ..., 95 msec., are thereby obtained, and are plotted against time in Fig. 10, from which it can be seen that they do not greatly diverge from a straight line.
For the purpose of predicting performance it is thus an adequate approximation to
say that power run-down rate in an isotonic twitch is independent of tension and increases linearly with time. The approximation neglects the final part of the twitch, the region
io6 C. J. PENNYCUICK
Effect of length
The effect of changing the overall muscle length has not been specifically investi-gated. However, it has been mentioned that before the magnetic release was installed some experiments were carried out in which the muscle was allowed to shorten freely as soon as its tension reached that in the elastic, resulting in observations at low tensions being made at shorter lengths than those at high tensions. Power vs. tension curves for such an experiment differ from those of Fig. 7 in that the curves converge towards the right-hand side of the diagram, that is, power run-down rate decreases with increasing tension. As this effect was removed by the introduction of the magnetic release, it seems likely that it was due to the length difference.
08 o 07 • > 06
DO
S 05 £
I 0-2
Q-01
15 25 35 45 55
Time (msec) 65
75 85 95
Fig. 10. Regarding the curves of Fig. 7 as parallel to one another, the average gap between each pair of curves (i.e. decrease of power in each 10 msec.) is here plotted against time, showing linear increase of rate of fall of power with time.
Progressive changes: influence of temperature
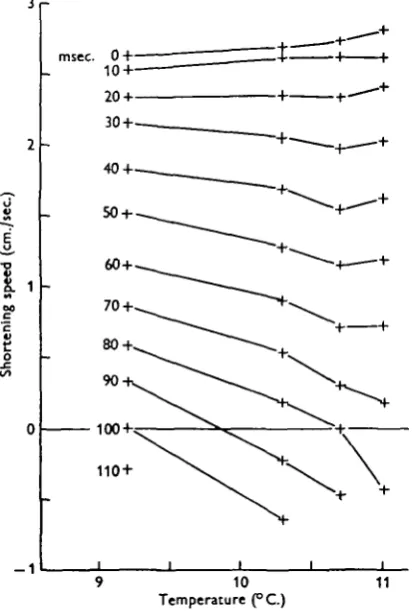
When making a set of isotonic records, observations were first made at progressively increasing tensions, using only every other tension of the series required. The inter-vening tensions were then filled in in decreasing order, so that progressive change was apparent. There was sometimes a difference in temperature of o-i or 0-2° C. between the first and last observations, and such changes as were observed were associated with this temperature drift.
power output later in the twitch decreased with temperature. In addition the velocity break set in earlier. In Fig. 11 each column of points represents a twitch at the same isotonic tension (10 g. wt.). The temperature was here allowed to drift over i-8° C. over a period of 1 \ hi., and the curves show speed of shortening vs. temperature with time after stimulus as parameter. It can be seen that the speed increases with tempera-ture at the beginning of the twitch, but the slope soon reverses, and towards the end of the twitch speed decreases strongly with temperature. The curves end at the velocity
3r
msec. 0 +•
10 +
§
1,
- 1
10 Temperature (°C.)
[image:17.451.125.333.174.480.2]11
Fig. 11. Four isotonic twitches at 10 g. wt. Increasing temperature results in increased speed at beginning of twitch, but more rapid deceleration.
break, which set in some 35 msec, earlier at the highest temperature than at the lowest. In those families of speed vs. tension in which temperature drift has occurred, the twitches at higher temperatures show as columns of points starting slightly higher than their neighbours, but spreading out more rapidly later in the twitch.
i o 8 C. J. PENNYCUICK
DISCUSSION
There is a very interesting difference between the above results and those obtained by Jewell & Wilkie (i960) on frog sartorius. They obtained speed vs. tension curves at different times after the stimulus by quick-releasing an isometrically contracting muscle and observing its initial shortening speed (after the rapid shortening of the series-elastic element was complete) from the slope of a record of length vs. time. The curves obtained, reproduced in Fig. 12, with speed as ordinate, were all concave-upwards, that is, they had a continuously decreasing negative slope, and in the opinion of the authors could have been fitted by Hill's equation, with altered constants. The method precludes the measurement of negative shortening speeds.
Tension (g. wt.)
Fig. 12. Speed vs. tension curves from Jewell & Wilkie (i960), which should correspond to Fig. 6. Observations at different times during a twitch were made by releasing a muscle, which had up till then been contracting isometrically, and measuring the initial speed of isotonic shortening, by drawing a tangent to a record of length vs. time. Only positive speeds of shortening can be recorded by this method.
is-never any drop in tension between the last stimulus and the observation, and only at the highest tensions is there any change in tension at all after the final stimulus.
The difference can be accounted for by postulating that a sudden drop in tension leads to an increase in power output, over that which would occur at the same time and tension without a preceding drop in tension.
Prediction of the isometric twitch
On the simple hypothesis (Hill, 1938) of a contractile component whose mechanical power output depends solely on the tension, stretching a passive series-elastic element, the form of an isometric twitch would be completely predictable from the set of iso-tonic power vs. tension curves described above, and any lack of correspondence may be regarded as a test of this hypothesis.
If the power run-down rate, represented by f(t), is independent of tension, then the derivative of power with respect to tension will be independent of time—two ways of saying that the curves of Fig. 7 are parallel to one another. Then, writing P for power and F for force,
f-££-*>• w
The condition for an isometric contraction is that
P -
Ǥ.
«4
where C is the total series compliance; in other words, the condition means that the entire power output is expended in stretching the series compliance. Substituting (2) in (1) allows—in principle—the form of the isometric twitch to be calculated.
Experiments in which the time course of power output in isotonic twitches is compared with that in twitches under other types of loading will be described in a later paper, but a simple comparison between an isometric twitch and the isotonic curves is possible from the data presented in the present paper, by observing the time and tension at which the peak of the isometric twitch occurs. At this moment, since rate of change of tension is zero, power output is also zero, and the time and tension at which zero power occurs can be read off the isometric myogram. Referring to a set of isotonic curves, such as Fig. 7, for the same muscle, one can immediately see whether zero power would also have occurred under isotonic conditions at the same time and tension.
It was found that peak tension in isometric twitches was reached at a time and tension when, according to the isotonic data, tension should still have been rising. Thus, during the rising phase of the twitch, power falls to zero more rapidly than would be predicted from the assumptions made, which may be because it has been too low from the beginning of the contraction, or because it has been falling more rapidly than would be predicted from the isotonic data, or both.
n o C. J. PENNYCUICK
from the isotonic data for the same time and tension, and the fourth the ratio of this power to the maximum power, Pmftx, observed at any time and tension under isotonic
conditions.
Table i t (msec.)
80 90 90 75
F (g. wt.)
26 28 29 40
(P) (ergs/sec.) 0-85 x io* 0-56 x io4 o-i8x 10* i-6ox io*
SUMMARY
(DIP, 0-26 O-2I o-io O'4O
1. The paper is primarily concerned with predicting the response of the muscle (frog ilio-fibularis fast fibres) to a given stimulus under given conditions of load. The predictive value of theories based on ' active state' is considered in this context.
2. A method is described for measuring the speed of shortening at frequent intervals during an isotonic twitch.
3. A family of speed vs. tension curves is drawn up, each curve representing a particular time after the stimulus. These are translated into power vs. tension curves. 4. The rate of fall of mechanical power output increases linearly with time after the stimulus, but is independent of tension.
5. At the beginning of the twitch, mechanical power output increases slightly with temperature, but later in the twitch the trend is reversed, as rate of fall of power also increases with temperature.
6. The high extensibility, characteristic of resting muscle, reappears suddenly at the end of an isotonic twitch, causing a ' break' in the speed record. This occurs earlier at low than at high tensions.
7. The basis of predicting an isometric twitch from isotonic data, based on certain assumptions which have been made by previous authors, is explained.
8. The tension peak in an isometric twitch is reached sooner than would be pre-dicted on these assumptions.
REFERENCES
ABBOTT, B. C. & RITCHIE, J. M. (1951). The onset of shortening in striated muscle. J. Pkytiol. 113,
336-45-ABBOTT, B. C. & WILKIE, D. R. (1953). The relation between velocity of shortening and the tension-length curve of skeletal muscle. J. Pkysiol. 120, 214-23.
BONE, Q. (1963). Patterns of muscular innervation in the lower chordates. Int. Rev. Neurobiol. (in the Press).
CLAYTON, G. B. (i960). Simple analogue computer. Wireless World, 66, 229-32.
GASSER, H. S. & HILL, A. V. (1924). The dynamics of muscular contraction. Proc. Roy. Soc. B, 96,
398-437-GONTHER, P. G. (1049). Die Innervation der tetanischen und tonischen Fasern der quergestreiften Skeletmuskulatur der Wirbeltiere. Anat. Anz. 97, 175-91.
HILL, A. V. (1938). The heat of shortening and the dynamic constants of muscle. Proc. Roy. Soc. B, 136, 136-95.
HILL, A. V. (1949). The abrupt transition from rest to activity in muscle. Proc. Roy. Soc. B, 136, 399-420.
HILL, A. V. (1950). The development of the active state of muscle during the latent period. Proc. Roy. Soc. B, 137, 320-9.
HILL, A. V. (1951 a). The earliest manifestation of the mechanical response of striated muscle. Proc. Roy. Soc. B, 138, 339-48.
HILL, A. V. (19516). The influence of temperature on the tension developed in an isometric twitch. Proc. Roy. Soc. B, 138, 349-54.
HILL, A. V. (1951c). The transition from rest to full activity in muscle: the velocity of shortening. Proc. Roy. Soc. B. 138, 329-38.
HILL, A. V. (1953a). The mechanics of active muscle. Proc. Roy. Soc. B, 141, 104-17.
HILL, A. V. (1953ft). The 'plateau' of full activity during a muscle twitch. Proc. Roy. Soc. B, 141, 498-503.
HLNSEY, J. C. (1934). The innervation of skeletal muscle. Pkysiol. Rev. 14, 514-85.
JEWELL, B. R. & WILKIE, D. R. (1958). An analysis of the mechanical components in frog's striated muscle. J. Physiol. 143, 515-40.
JEWELL, B. R. & WILKIE, D. R. (i960). The mechanical properties of relaxing muscle. J. Pkysiol. 15a,
3O-47-KATZ, B. (1939). The relation between force and speed in muscular contraction. J. Physiol. 96, 45-64. KUFFLER, S. W. & GERARD, R. W. (1947). The small-nerve motor system to skeletal muscle. J.
Neuro-pkysiol. 10, 383-94.
KUFFLER, S. W. & VAUGHAN WILLIAMS, E. M. (1953). Properties of the 'slow' skeletal muscle fibres of the frog. J. Physiol. iai, 318-40.
MACHIN, K. E. (1959). The electronic simulation of the load applied to an insect muscle. Electron. Engng. 31, 740-44.
MACHIN, K. E. & PRINGLE, J. W. S. (i960). The physiology of insect fibrillar muscle. III. The effect of sinusoidal changes of length on a beetle flight muscle. Proc. Roy. Soc. B, 15a, 311-30.
MACPHERSON, L. & WILKIE, D. R. (1954). The duration of the active state in a muscle twitch. J. Physiol. i*4. 292-9.
PODOLSKY, R. J. (i960). Kinetics of muscular contraction: the approach to the steady state. Nature, Land., 188, 666-8.
PRINGLE, J. W. S. (i960). Models of muscle. Symp. Soc. Exp. Biol. 14, 41-68.
RITCHIE, J. M. (1954). The effect of nitrate on the active state of muscle. J. Physiol. ia6, 155-68. RITCHIE, J. M. & WILKIE, D. R. (1958). The dynamics of muscular contraction. J. Physiol. 143.104-13-WASS, C. A. A. (1955). Introduction to Electronic Analogue Computers. London.