Abstract—The aim of this study is to get a better comprehension of gas-particles fluidization regimes. Experiments have been conducted in an experimental Circulating Fluidized Bed (CFB) with solid particles of high density (bronze) compared to those generally encountered in literature (sand, glass beads or FCC). Analysis of the standard deviation of pressure drop fluctuations normalized with pressure drop amplitude and visual observations have shown a choking limit and a bubbly-turbulent transition. We have shown that correlations of literature can well predict the choking limit and experimental specific velocities identified for turbulent transition, thus extending their application range.
Index Terms—fluidization, regime transition, choking, turbulent flow.
I. INTRODUCTION
HE literature proposes numerous correlations associated with regime transitions, most of them developed for non-circulating fluidized beds and then applied to Circulating Fluidized Bed (CFB). However, in some cases it is apparent that the authors disagree concerning the types of regime on either side of identified transitions. This can be due to the disparity of the geometrical aspect of CFBs (with particular reference to riser section) from one author to another, although the powder used and the operating conditions are very similar.
Bai and co-authors [1] stressed the need for clear identification of the fluidization regimes in the riser of a CFB, to ensure better comprehension of the thermohydraulic context, and thus correctly design the loop. They emphasize the ambiguity of definitions proposed in the literature, both in qualitative and quantitative terms, and demonstrate a number of contradictions between theoretical predictions and experimental results.
Furthermore, the available correlations for CFBs have been developed for FCC type powders which density is around 2000 kg/m3 and for which extrapolated studies
concern at least densities less than 5000 kg/m3 [2]. For
example, among the recent compilation made by Yang & Leu [3] gathering 29 experimental cases, only 2 of them involve powder density higher than 5000kg/m3 (less than 7%
of all cases). As a consequence, extrapolation of fluidization regimes observations and results appears to be not so easy. Yet, high density powders such as bronze are of interest
Manuscript received: March 15, 2012; revised: April 15, 2012. Ph. Fauquet-Alekhine is Physicist in the Laboratory for Research in Sciences of Energy since 2001. Before, he worked in the Thermal Transfer & Aerodynamics Dept. of EDF in Chatou (France) and for the French national space research center (CNES). Phone: +33(0)2549224461. Email: [email protected]
since bronze and air show the same density ratio than ashes and hot gas inside industrial CFB furnaces. High density powder can thus help to work with better hydrodynamic similitude.
We therefore decided to carry out experimental identification of regime transitions for those types of gas/particle flow with which it is concerned. Analysis of pressure drop fluctuations in the riser was conducted as done by others (see, for example, [4]-[6]), in order to identify the various fluidization regimes. Identified transition velocities have been confirmed by visual observations and compared with existing correlations which we consider to be the most appropriate for the studied flows. The transition velocities are namely the choking velocity for which the bed collapses, the velocity Uc related to the onset of transition between
bubbly flow and turbulent flow and Uk related to the onset of
established turbulent flow.
A good comprehension of gas-particles fluidization regimes will contribute to give us the means to appreciate the possibility of extrapolating experimental CFB correlations to industrial units as done for example in a previous work [7], which have much larger scale than laboratory facilities.
II. EXPERIMENTAL FACILITIES AND PROTOCOL
A. Experimental facilities
The experimental loop is a CFB which internal height of riser is 6.61m from the fluidization grid to the roof, and a square section measuring 0.175m x 0.175m (see Fig. 1), with transparent perspex walls. The exit riser is located on one side of the riser, at the top of it, with a 0.175m x 0.13m section, and the exit pipe forms a 90 degrees angle with the riser axis. The bed is supplied with air at ambient temperature by a booster pump, via a fluidization grid. Powder is introduced at the bottom of the riser, through side wall. Evacuation of the gas/particles suspension is made through the same side wall, at the top of the riser. The powder distributor system is a screw feeder (80R type, Parimix). Gas/particles separation is obtained by means of a centrifuge cyclone, which leads the solid phase to the distributor, via a solid flow rate measurement device (Endress & Hauser impact plate type flowmeter). The solid flow rate in the loop is thus known continuously. The riser is equipped with 12 differential pressure transducers (deltabar PMD 130, Endress & Hauser), which deliver a 4-20 mA signal proportional to the measured pressure. They can be connected as required to 50 pressure taps, 6 mm diameter drilled through the perspex wall, uniformaly arranged on the center line of the riser wall, and two absolute pressure transducers, located at the top and bottom of the riser. The taps are exempt of filters, which would prevent solid
Gas-particles Flow Transitions for High Density
Powder
Ph. Fauquet-Alekhine
particles from getting inside the measurement line, but would also reduce the transducers sensitivity to dynamic pressure fluctuations. Pressure measurement lines have been optimized as suggested by Clark et al. [8] in order to guaranty the best response of the lines when measuring pressure drop fluctuations. This implies to purge systematically all connected pressure taps before measurements and limits the maximum acquisition duration time. Fluidization velocity inside the riser is determined from the measurement of air mass flow upstream the riser (AT 533 thermal mass flowmeter, Endress & Hauser), temperature and pressure in the riser.
Fig. 1: Experimental device. 1: riser. 2: fluidization grid. 3: fluidization flowmeter. 4: solid screw feeder. 5: solid mass flowmeter. 6: separator. 7:filter.
Parameters of operating conditions are given in Table I. Bronze powder is used, which characteristics are also given in Table I. The particles are fluidized with air at ambient temperature. Bronze and air show the same density ratio than ashes and hot gas inside industrial CFB furnaces.
B. Experimental protocol
The differential pressure signals are acquired at 100Hz during 45 to 120 seconds, both for the riser segments defined between pressure taps, and for the total riser pressure drop. Acquisition duration has been adjusted regarding on the period of the pressure drop fluctuations observed.
A mean value and a standard deviation are calculated for each of these signals. The ratio of standard deviation on mean value (called normalized standard deviation and
denoted NSD) is used for the flow transition analysis as suggested in previous works [9], [10] and then again by Johnsson et al. [11]. It is based on the method suggested first by Yerushalmi et al. [12] analyzing pressure drop fluctuations. NSD reflects variations in the amplitude of measured pressure fluctuations. By plotting evolution of this quantity versus fluidization velocity, it is possible to identify fluidization regime transitions (for example, see [3], [6], [13]-[15]).
Besides, visual observations were performed through the perspex walls of the riser to identify a change of the two-phase flow behavior with changing U0. These observations
were obtained in order to confirm fluidization regime transitions detected with NSD analysis.
Two types of test program were proposed. The first one involved constant solid flow rate in the loop, with a variable fluidization velocity, while the second one was associated with a constant pressure drop in the riser (namely a constant effective solid inventory in the riser) when the fluidization velocity varies.
III. RESULTS & DISCUSSION
A. Experimental results
Measurements of NSD at constant pressure drop in the riser did not show any detectable fluidization regime transitions. In all cases, we observed a growth of NSD with increasing fluidization velocity U0.
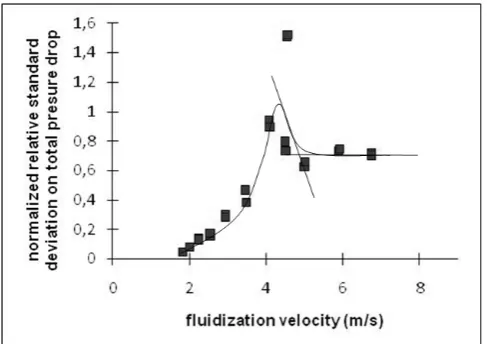
NSD at constant mass flow rate Gs plotted versus U0 were
fitted with curves which present a maximum value for a specific fluidization velocity Uc, as shown on Fig. 2. For the
five values of Gs investigated, these specific velocities have
been identified as fluidization regime transition when compared with visual observations. Fig. 3 a and b illustrate the change of flow behavior for Gs = 5,2 t/h (47 kg.m-2.s-1) :
at U0 less than the transition velocity Uc, we can observe,
through the bottom bed walls, the presence of clusters impinging the walls (white patterns on Fig. 3a) and of numerous trails spreading on the walls. Clusters and trails have no well defined displacement: some go up, others down, and it is clear that numbers of them have transverse velocity. These observations let us think of the existence of a splash zone over a dense bed, where the two-phase flow is the most turbulent. At U0 greater than Uc, we no longer
observe clusters impinging the walls (Fig. 3b). Only few trails can be seen. Furthermore, it is important to notice that, for the whole range of Gs and U0 investigated, the bottom
bed voidage ε was closed to 0,95 and visual observations have shown, close to the perspex walls and all along the riser height, the existence of a boundary layer where particles were flowing down to the bottom bed. These observations show that pneumatic transport has not been reached since such a fluidization regime is characterized by a dilute bed with particles all going upflow.
At constant mass flow rate Gs and for the five values of Gs
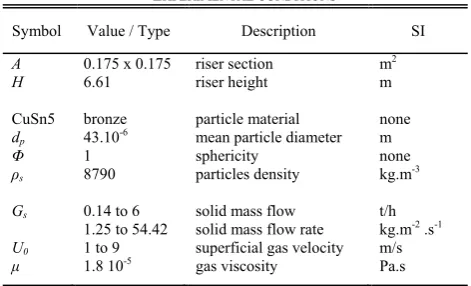
investigated, we found a minimum fluidization velocity below which mass flow rate could not be maintained. When the minimum fluidization velocity was reached from upper values, the CFB flow, which was the most dense and turbulent we could observed, suddenly broke down: the bed TABLEI
EXPERIMENTAL CONDITIONS
Symbol Value / Type Description SI
A 0.175 x 0.175 riser section m2
H 6.61 riser height m
CuSn5 bronze particle material none dp 43.10-6 mean particle diameter m
Φ ρs
1 8790
sphericity particles density
none kg.m-3
Gs 0.14 to 6 solid mass flow t/h
1.25 to 54.42 solid mass flow rate kg.m-2 .s-1
collapsed. No solid recirculation was possible (except with increasing U0) and the riser presented two distinct regions.
The first one, in the bottom of the riser, was a dense bed which could be described as a bubbling bed with very few air bubbles. The second one, localized over the first one, was so dilute that it was hardly possible to detect solid particles entrained to the top of the riser. Thus, solid mass flow rate was zero. These results were completed by investigation of
Gs down to 0.14 t/h (1.25 kg.m-2.s-1) in order to have a better
[image:3.595.46.290.182.354.2]description of this limit.
Fig. 2. Normalized standard deviation for total pressure drop in the riser versus fluidization velocity for Gs = 1 t/h (9.07 kg.m-2.s-1). Fitted
[image:3.595.60.271.409.531.2]curve and lines allow to identify transition velocities.
Fig. 3.a. U0 = 3 m/s < Uc Fig. 3.b. U0 = 7 m/s > Uc
Fig. 3.a & 3. b. Pictures a and b showing the change of flow behavior at the bottom of the riser for Gs = 5,2 t/h (47 kg.m-2.s-1).
In conclusion, two fluidization regime transitions have been observed at constant mass flow operating conditions : a bubbly-turbulent transition and, at lower fluidization velocity, a breakdown limit in terms of fluidization velocity called choking velocity Uch at which sudden change from
CFB to bubbling/fixed bed was observed, and under which constant mass flow rate could not be maintained. These transitions are discussed and analyzed in further sections.
The present results give average values for the characteristic velocities of the flow as following:
Uc = 4.5 m/s and Uk = 5 m/s.
As shown on Fig. 2, Uc is determined as the extreme of the
NSD curve and Uk is the intersection of the extended lines of
the NSD attenuation and plateau parts. As noticed by others [3], values of Uk are not easy to obtain and may sometimes
not be identified at all.
B. Analysis & discussion
Observations and measurements performed in the present
experimental program showed fundamental changes in the gas - particles flow behavior while U0 was modified at
constant Gs. For the high values of fluidization velocity U0
investigated, and for constant mass flow rate Gs, a maximum
of turbulence in the riser appears to correspond to a specific velocity Uc. Then, when decreasing U0, a minimum
fluidization velocity is reached, below which only bubbling or fixed bed is observed, consequently to a sudden breakdown of the flow. Those transition limits are discussed and compared with existing correlations in the following sections.
Transition from captive regime to turbulent regime
Transition from captive to fast transport regime involves turbulent regime, as observed by many authors [1], [6], [14]-[19]: with the increase in U0, the fluidized bed in the riser
changes from a dense condition to a bubbly condition, and turbulence inside the riser grows consequently. This increase in turbulence is accompanied by variations of density fluctuation amplitude. It has been verified [19] that these density fluctuations can be quantified by riser wall pressure measurement, comparing the signals delivered by wall pressure transducers with those delivered by optical probes. Thus the maximum standard deviation of total pressure drop in the riser corresponds to a maximum level of turbulence in the riser, associated with a specific velocity. This description agrees with results of the present work. The upper bound that we denoted Uc is related to the transition
from bubbly to turbulent regime.
Above Uc, as U0 is increased, turbulence then smoothly
decreases while fluidization regime tends to fast transport type and can tend to pneumatic transport. The established turbulent regime is achieved for a characteristic velocity Uk.
Below Uc, another specific velocity is reached when
decreasing U0. This corresponds to a sudden breakdown of
the bed with no possible solid recirculation. This specific velocity has been called by many authors "choking velocity" (see [20]-[22] for example). Bi et al. [18] have proposed a review of choking description, pointing out that some choking occurrence can be induced by equipment-limited operating modes, while others are due to the suspension characteristics. It has been verified, in the present work, that the choking transition obtained was not of the first type by comparing the pressure balance in the CFB loop and upstream the fluidization grid. The present choking transition is of the second type, the same as observed by Louge et al. [21].
Many correlations have been proposed for estimation of
Uc and Uk, in the case of powders with ρs < 5000 kg/m3,
fluidized in a pipe or a vessel without any solid recirculation. Most of them, expressed in terms of Archimede number Ar
and Reynolds number Re, have been reviewed by Arnaldos et al. [23]. It is obvious that such correlations cannot fully describe CFB transition regimes as a main parameter as solid mass flow rate is ignored.
For the onset of transition between bubbly flow and turbulent flow, Yang & Leu [3] have suggested a correlation for a wide range of density particle values, expressed in terms of Reynolds and Archimede numbers:
Rec = 0.837 .(Ar) 0.487 (1)
where
Ar= ρs g (ρs - ρg) dp3 / µ2 (2)
Rec = ρ g Uc dp / µ (3)
[image:4.595.299.548.93.432.2]When plotting our data on Fig. 4 with others results of studies [25]-[39] gathered in [3], the correlation coefficient of Yang & Leu's correlation value changes from 0.820 to 0.817. This allows to claim the validation of this correlation for a wide range of particle density extended to high density particles.
Fig. 4. Onset of transition between bubbly flow and turbulent flow: comparison between experimental velocity values of Uc (including
air/bronze flow for the present work) with Yang & Leu's correlation [3]. Data extracted from [3],[25]-[39]. Correlation coefficient is 0.817.
For the onset turbulent flow, Yang & Leu [2008] have suggested a correlation for a wide range of density particle values, expressed in terms of Reynolds and Archimede numbers:
Rek = 1.174 .(Ar)0.481 (4)
where
Rek = ρ g Ukdp / µ (5)
When plotting our data on Fig. 5 with others results of studies gathered in [3], the correlation coefficient of Yang &
Leu's correlation value changes from 0.890 to 0.857. This allows to claim the validation of this correlation for a wide range of particle density extended to high density particles.
Fig. 5. Onset of turbulent flow: comparison between experimental velocity values of Uk (including air/bronze flow for the present work) with Yang &
Leu's correlation [3]. Data extracted from [3], [28], [31]-[33], [38]. Correlation coefficient is 0.857.
Correlation for choking transition
For choking transitions, the review of Bi et al. [18] suggests that correlations of Yang [20] and Bi et al. [22] correspond to the type of choking encountered in the present work.
Yang 's correlation [20] is :
g
2.2 5
s 2.2 4.7
0.5
+ =
1
10
6.81
U g D
ε
chU
t ch
ch 2 (6)
with
1
= ch t ch s
s U U
G (7)
and Bi 's correlation [22] is:
Ar U
ρ
G . = d g
U .
ch g
s .
p
ch 0105
542 0
6 21
(8)
[image:4.595.46.285.266.602.2]correlations (6) and (8). We find here conclusions of Bi et al. [18] who noticed the over-estimation of correlation (4), while (5) under-estimates the experimental data. The prediction of these correlations can be considered satisfactory.
[image:5.595.44.291.116.263.2]
Fig. 6. Comparison of choking limits from Yang [20] and Bi et al. [22] correlations (6) and (8) with experimental choking data of the present work.
IV. CONCLUSION
Experiments have been conducted in a CFB with solid particles of high density (bronze) compared to those encountered in literature (sand, glass beads or FFC). Bronze was chosen to give with fluidization air the same density ratio than that of industrial CFB suspensions. Investigations have been performed for a large range of solid mass flow rate and fluidization velocity. Analysis of the standard deviation of pressure drop fluctuations normalized with pressure drop amplitude and visual observations have shown that i) a choking velocity is found at low fluidization velocity, associated with a sudden breakdown of the flow and no possible solid recirculation, ii) a bubbly-turbulent transition at higher fluidization velocity is identified, characterized by the maximum of normalized standard deviation of pressure drop fluctuations, iii) the onset of established turbulent flow is characterized.
Concerning the choking velocity, our data have been successfully bounded by existing correlation developed by Yang [20] and Bi et al. [22] as suggested by Louge et al. [21].
Concerning turbulent transition, application of the Yang & Leu’s correlations [3] has been successfully extended to high density particles using the present experimental results.
Further investigations are planned for refined characterization of high density particle suspensions with X-ray measurements.
REFERENCES
[1] D. Bai, Y. Jin, Z. Yu, "Flow regimes in CFB", Chem. Eng. Techn., 16, pp. 307–313, 1993.
[2] A. Luckos, P. den Hoed, “Fluidization and Flow Regimes of Titaniferous Solids”, Ind. Eng. Chem. Res., 43, pp. 5645-5652, 2004. [3] T.Y. Yang, L.P. Leu, “Study of transition velocities from bubbling to
turbulent fluidization by statistic andwavelet multi-resolution analysis on absolute pressure fluctuations”, Chemical Engineering Science, 63, pp. 1950–1970, 2008.
[4] F. Johnsson, A. Svensson, B. Leckner, "Fluidization regimes in CFB boilers", in Fluidization VII, (eds. Potter O.P. and Nicklin D). J., Engineering Foundation Conference, Brisbane, pp. 471-478, 1992.
SYMBOLS &UNITS
[5] F. Johnsson, A. Svensson, S. Anderson, Leckner, B., "Fluidization regimes in boilers", in Fluidization VIII, Tours, France, pp. 129–136, 1995.
[6] A. Chehbouni, J. Chaouki, C. Guy, D. Klvana, "Characterization of flow transition between bubbling and turbulent fluidization", in Ind. Eng. Chem. Res., 33, pp. 1889–1896, 1995.
[7] D. Montat, Ph. Fauquet, L. Lafanechere, J. L. Bursi, "SILVA : EDF two-phase 1D annular model of CFB boiler furnace", in 14th. FBC Conf. ASME, Vancouver, pp. 1023-1032, 1997.
[8] N. N. Clark, C. M. Atkinson, "Amplitude reduction and phase lag in fluidizaed bed pressure measurements", in Chem. Eng. Sc., 43 (7), pp. 1547-1557, 1988.
[9] Ph. Fauquet, E. Brunier, “Experimental study of circulating fluidization regimes with dense powder”, Proceeding of the Second Europeen Congress of Chemical Engineering, october 1999, Montpellier, France.
http://www.hayka-kultura.com/phfa%20pub%28fr%29.html [10] Ph. Fauquet, R. Seigle, E. Brunier, “Prediction of solid mass flow in
circulating fluidized bed”, Proceeding of the 14th International Congress of Chemical and Process Engineering CHISA2000, paper 727, 27-31 August 2000, Praha, Czech Republic.
http://www.chisa.cz/2000/
[11] F. Johnsson, R.C. Zijerveld, J.C. Schouten, C.M. van den Bleek, B. Leckner, “Characterization of ¯uidization regimes by time-series analysis of pressure fluctuations”, International Journal of Multiphase Flow, 26, pp. 663-715, 2000.
[12] J. Yerushalmi, N.T. Cankurt, D. Geldart, B. Liss, “Flow regimes in vertical gas–solid contact systems” A.I.Ch.E. Symposium Series, 174 (176), pp. 1–12, 1978.
[13] A. Chehbouni, J. Chaouki, C. Guy, D. Klvana, "Effet de différents paramètres sur la vitesse de transition de la fluidisation en régime turbulent", in Can. J. of Chem. Eng., 73, pp. 41-50, 1995.
[14] S. Mori, O. Hashimoto, T. Haruta, K. Mochizuki, W. Matsutani, S. Hiraoka, I. Yamada, T. Kojima, K. Tuji, , “Turbulent fluidization phenomena”, in Circulating fluidized bed Technology II, Pergamon, Oxford, pp. 105-112, 1988.
[15] J. Yerushalmi, N. T. Cankurt, "Further studies of the regimes of fluidization", Powder Techn., 24, pp. 187–205, 1979.
[16] M. Horio, "Hydrodynamics", in Circulating fluidized beds, edited by J. R. Grace, A. A. Avidan, and T. M. Knowlton, Chapman and Hall, London, pp. 21– 85, 1997.
[17] J. F. Perales, T. Coll, M. F. Llop, L. Puigjaner, J. Arnaldos, J. Casal, "On the transition from bubbling to fast fluidization regimes", in Circ. Fluid. Beds III, Pergamon Press, pp. 73-78, 1991.
[18] H. T. Bi, J. R. Grace, J. X. Zhu, "Type of choking in vertical pneumatic systems", Int. J. Multiphase Flow, 19 (6), pp. 1272-1280, 1993.
[19] J. G. Yates, S. R. J. Simons, "Experimental methods in fluidization research", Int. J. Multiphase Flow, 20, pp. 297–330, 1994.
[20] W. C. Yang, "Criteria for choking in vertical pneumatic conveying lines", Powder Techn., 35, pp. 143-150, 1983.
Symbol Quantity SI a
Ar Rec
Archimede number Reynolds number for Uc
none none Rek
A dp
Reynolds number for Uk
riser section
mean particle diameter
none m2
m ds mean Sauter particle diameter m
D riser internal diameter D = (4 A/π) ½ m
g gravitational acceleration m/s2
Gs solid mass flow
or solid mass flow rate
kg/s kg.m-2 s-1
H riser internal height m Uà superficial gas velocity, fluidization
velocity m/s
Uc,k,t characteristic velocity m/s
Uch choking velocity m/s
Φ
porosity sphericity
none none
gas viscosity Pa.s
[21] M. Louge, H. Chang, " Fluid dynamic similarity of CFB", Powder Techn., 70, pp. 259-270, 1992.
[22] H. T. Bi, L. S. Fan, "Regime transitions in gas-solid CFB", in AIChE Annual Mtg., Los Angeles, AC, paper n°101, 1991.
[23] J. Arnaldos, J. Casal, "Prediction of transition velocities and hydrodynamical regimes in fluidized beds", Powder Techn., 86, pp. 285-298, 1996.
[24] G. Yang, J. Sun, "Transition of flow regime from turbulent to fast fluidization and from fast to dilute phase transport", in Fluidzation 91, Sc. & Techn. (Sc. Press) Beijing, pp. 37-45, 1991.
[25] S. Satija, L.S. Fan, “Characteristics of slugging regime and transition
to turbulent regime for fluidized beds of large coarse particles”, A.I.Ch.E.Journal, 31 (9), pp. 1554–1562, 1985.
[26] Y. Jin, Z.Q. Yu, Z. Wang, P. Cai, “A criterion for transition from bubbling to turbulent fluidization” in Ostergaard, K., Sorensen, A. (Eds.), Fluidization, vol. V. New York: Engineering Foundation, pp. 289–296, 1986.
[27] G.S. Lee, S.D. Kim, “Pressure fluctuations in turbulent fluidized beds”, Journal of Chemical Engineering of Japan, 21,pp. 515–521, 1988.
[28] S. Mori, O. Hashimoto, T. Haruta, K. Mochizuki, W. Matsutani, S. Hiraoka, I. Yamada, T. Kojima, K. Tuji,. “Turbulent fluidization phenomena” in: Basu, P., Large, J.F. (Eds.), Circulating Fluidized Beds Technology, vol. II. Oxford: Pergamon Press, pp. 105–112, 1988.
[29] J.E. Son, J.H. Choi, C.K. Lee, “Hydrodynamics in a large circulation fluidized bed” in: Basu, P., Large, J.F. (Eds.), Circulating Fluidized Beds Technology, vol. II. Oxford: Pergamon Press, pp. 113–120, 1988.
[30] P. Cai, Y. Jin, Z.Q. Yu, Z.W. Wang, “Mechanism of flow regime transition from bubbling to turbulent fluidization”, A.I.Ch.E. Journal, 36, pp. 955–956, 1990.
[31] L.P. Leu, J.W. Huang, B.B. Gua, “Axial pressure distribution in turbulent fluidized beds” in: Lu, W.M., Leu, L.P. (Eds.), Proceedings of Asian Conference on Fluidized-Bed and Three-Phase Reactor, Kenting, Taiwan, pp. 71–79, 1990.
[32] M. Horio, H. Ishill, M. Nishimuro, “On the nature of turbulent and fast fluidized beds”, Powder Technology, 70, pp. 239–246, 1992. [33] M. Tsukada, D. Nakanishi, M. Horio, “The effect of pressure on the
phase transition from bubbling to turbulent fluidization”, International Journal of Multiphase Flow, 19, pp. 27–34, 1993. [34] A. Chehbouni, J. Chaouki, C. Guy, D. Klvana, “Characterization
ofthe flow transition between bubbling and turbulent fluidization”, Industrial & Engineering Chemistry Research, 33, pp. 1889–1896, 1994.
[35] H.T. Bi, J.R. Grace, “Effect of measurement method on velocities used to demarcate the transition to turbulent fluidization”, Chemical Engineering Journal, 57, pp. 261–271, 1995.
[36] H. Cui, N. Mostoufi, J. Chaouki, “Characterization of dynamic gas– solid distribution in fluidized beds”, Chemical Engineering Journal, 79, pp. 134–143, 2000.
[37] V.N. Kashkin, V.S. Lakhmostov, I.A. Zolotarskii, A.S. Noskov, J.J. Zhou, “Studies on the onset velocity of turbulent fluidization for alphaalumina particles”, Chemical Engineering Journal, 91, pp. 215– 218, 2003.
[38] M.C. Shou, L.P. Leu, “Energy of power spectral density function and wavelet analysis of absolute pressure fluctuation measurements in fluidized beds”, Trans IChemE, Part A, Chemical Engineering Research and Design, 83 (A5), pp. 478–491, 2005.
![Fig. 5. Onset of turbulent flow: comparison between experimental velocity Leu's correlation [3]](https://thumb-us.123doks.com/thumbv2/123dok_us/1282633.656852/4.595.299.548.93.432/fig-onset-turbulent-flow-comparison-experimental-velocity-correlation.webp)
![Fig. 6. Comparison of choking limits from Yang [20] and Bi et al. [22] correlations (6) and (8) with experimental choking data of the present work](https://thumb-us.123doks.com/thumbv2/123dok_us/1282633.656852/5.595.44.291.116.263/comparison-choking-limits-yang-correlations-experimental-choking-present.webp)
