Abstract— In the present paper, numerical simulation of
thermal barrier coating system under thermo-mechanical loadings is performed, using the finite element method in ABAQUS software. The base material is Aluminum-silicon alloy, A356.0 which is widely used in automotive components such as diesel engine cylinder heads. Thermal barrier coatings (TBCs) are applied to combustion chamber in order to reduce fuel consumption and pollutions and also improve fatigue life of components.
The roughness effect of coating layers on stress distribution of test specimens is investigated. Semi-ellipsoid roughness of the interfaces between substrate/bond coat and bond coat/top coat are simulated to get the stress distribution by considering different wave lengths and roughness amplitudes. Mutual influence of waves positioning (in phase and out of phase) is also studied in present investigation. Results show that separation of the TBC system from substrate (in cylinder heads application) is more probable than separation of BC and TC due to higher stresses in substrate/BC interface. Moreover the magnitude of stress increases when the roughness amplitude enhances and wave length shortens which leads to crack initiation in TBC system. Crack propagation and failure in TBCs accelerate when the peak regions of asperities position on each other, leading to more tensile zones in BC layer.
Index Terms—Finite element method, thermal barrier
coating, roughness profile, thermo-mechanical loading
I. INTRODUCTION
HE thermal barrier coatings (TBCs) are multi-layer material systems which can be applied to the combustion chamber of diesel engines. This may increase the thermal efficiency, improve the fatigue life, reduce some emissions such as hydrocarbons and save the fuel consumption [1-4]. A typical TBC system consists of the substrate, metallic bond coat (BC), mostly made of Ni-Cr-Al-Y, a thermally grown oxide (TGO) formed as a result of BC oxidation, and ceramic top coat (TC), mostly Yttrium stabilized Zirconium (YSZ) with composition ZrO2
-8%Y2O3. These layers were applied by Air Plasma Spraying
(APS) to substrates [5].
Manuscript received March 06, 2011; revised April 05, 2011. This work is supported in part by the Irankhodro Powertrain Company (IPCo.) under project number of 450008.
A. Moridi is MSc student at Material Life Estimation and Improvement Laboratory, School of Mechanical Engineering, Sharif University of Technology, Tehran, Iran (e-mail: [email protected]).
M. Azadi is PhD candidate at Material Life Estimation and Improvement Laboratory, School of Mechanical Engineering, Sharif University of Technology, Tehran, Iran (e-mail: [email protected]).
G.H. Farrahi is Professor at School of Mechanical Engineering, Sharif University of Technology, Tehran, Iran (Corresponding author: phone: 98-21-66165533; fax: 98-21-66000021; e-mail: [email protected]).
Aluminum alloy cylinder heads are exposed to two types of loading with low and high frequency. High frequency loadings include combustion pressure on the combustion chamber and low frequency loadings include initial static forces (such as bolts forces) and thermal expansion. Due to these loadings, cylinder heads should have suitable material properties to endure high cycle fatigue (HCF) and thermo-mechanical fatigue (TMF). In thermo-thermo-mechanical loading conditions, a combination of modern cooling methods or protective coatings such as TBCs can be used which leads to lower thermal stresses due to lower temperature gradient.
To model and predict the fatigue life, different failure mechanisms of TBC systems must be considered. A major weakness in the system, is the interfaces between substrate/BC and BC/TC. These interface regions undergo high stresses due to the mismatch of thermal expansion between materials and due to interface roughness [6]. Another failure mechanism is the development of TGO at the interface formed as a result of bond coat oxidation at about 900 oC [7].
The purpose of the present paper is to investigate the influence of the interfaces roughness on stress distribution by using finite element (FE) modeling of TBC systems. FE modeling of TBC systems on aluminum alloys is rare and most researches were about simulation of coating on super alloys. High temperature application of these alloys cause forming of TGO layer between BC and TC which is the vital failure mechanism. Bengtsson and Persson [8] and also Widjaja et al. [9] presented FE analysis for the development of residual stresses during spraying of zirconia-based thermal barrier coatings. It was assumed a flat interfaces hypothesis between dissimilar materials, in order to simplify the approach.
The time-dependent model of CMSX-4 was studied by Schubert et al. [10]. The development of cracks at the BC/TGO interface has been simulated using cohesive zone elements. The effect of curvature and height of the interface asperity on stresses formation during the service was examined by Hsueh and Fuller [11]. A numerical simulation of crack development within APS TBC systems was performed by Bialas [6] by modeling the TGO thickening and creep deformation of all system constituents and using two dimensional periodic unit cell to examine the effect of interfacial asperity on stress distribution and subsequent delamination of APS TBC.
By considering a homogenous type for the temperature distribution, Sfar et al. [12] modeled the BC/TC interface roughness, the volume growth of the oxide layer, the cyclic loading and the creep relaxation to predict their effects on the stress distribution. Liu et al. [13] performed
Numerical Simulation of Thermal Barrier Coating
System under Thermo-mechanical Loadings
A. Moridi, M. Azadi, G.H. Farrahi
experimental and numerical life prediction of thermally cycled thermal barrier coatings by considering different thicknesses for top coat. A new step in the objective to continue the development of the TBCs performance was presented by Ranjbar-Far et al. [14]. In their study, the finite element code ABAQUS was used by considering a non-homogenous temperature model to study the thermo-mechanical behavior of the thermal barrier coatings system. The results show that the oxide formed on rough TC/BC interface during service has an intrinsically different morphology and different growth rate compared to those formed when considering a homogenous temperature.
In the present paper, the interface roughness effect on stress distribution of A356.0 with TBC system is performed under mechanical loadings. As a result, thermo-mechanical stress distributions for different roughness with various amplitudes and wave lengths and also mutual roughness influence of substrate/BC and BC/TC interfaces (in phase and out of phase) are presented.
II. FESIMULATION
Many efforts have been done to numerically investigate stress development in TBC systems. The interface between a plasma sprayed TC and BC, has a complex shape due to manufacturing process. In spite of this, often times a two dimensional unit cell symbolizing a single asperity has been used to be representative for the entire surface area of stress field [6]. This is because of long calculation times and difficulties of generating a suitable mesh in the realistic simulation. In a 2D approach, the interface shape can be simplified as sinusoidal, semicircle, semi-ellipsoid, with different amplitude and wave length. In order that the modeled segments of the TBC system behave as if it were a part of a much greater medium, a combination of symmetry boundary condition and periodic boundary condition must be applied.
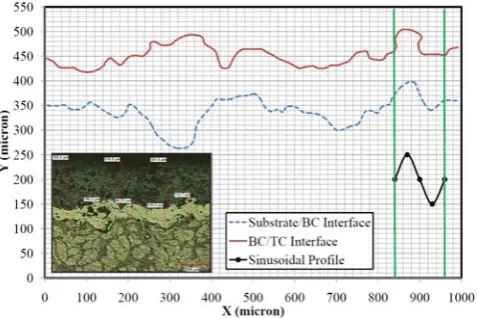
Although in the most published works [6,7,12,14], only the roughness of BC/TC is studied but both interfaces are considered in this paper as an innovation. This is because of a type of failure observed in thermal shock test (Fig. 1). This thermal shock test has been performed on 3 different thicknesses of TC. This experiment was carried out by repeating flame heating of the specimens to a specific temperature and abruptly quenching at water. Failure analysis shows that coating layers including both BC and TC were separated from the base material. However, on one of the specimens with thinner TC thickness, some parts of BC layer was still remained. This can be a good reason to consider the roughness of substrate/BC interface in the model and to study the stress distribution there. Interface profile between substrate/BC and BC/TC has a random nature, as it is shown in Fig. 2.
In addition, due to the considered temperature condition which is below 250 oC, the TGO cannot be formed [7] and thus, TGO layer is not taken into account.
In order to improve the modeling of the multilayer system, a micrograph of the cross section and surface profile of the substrate/BC and BC/TC interface, extracted by image processing, were employed (Fig. 2). As mentioned, single asperity is used instead of the entire roughness profile
for modeling. The thermal and mechanical loadings and boundary conditions are shown in Figs. 3 and 4.
The FE model is shown in Fig. 4 where multi point constraint condition is considered in the bottom face. Symmetric condition is applied for the top face, thermal load is applied for the right face and mechanical load is applied to the bottom face. The transient de-coupled temperature-displacement analysis is used in present investigation. Finer mesh is used at interface layers where excessive gradient of temperature and stress may occur.
The TBC system is composed of A356 substrate, Ni-Cr-Al-Y bond-coat and ceramic top-coat (ZrO2-8%Y2O3). For
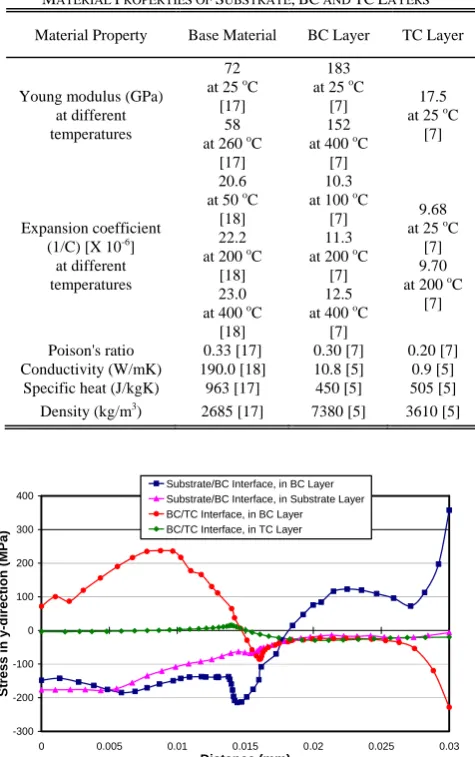
material properties, the cyclic hardening characteristic is expressed by the isotropic hardening law. The non-linear kinematic hardening component describes Bauschinger effect by explaining the translation of the yield surface in stress space through the back-stress. This law is defined as a supplement combination of a linear term and a relaxation term, which presents the non-linearity. The material properties are listed in Table 1 and for complementary data, refer to [7,14,15,16].
[image:2.595.306.547.456.585.2]The load cycle is composed of thermal and mechanical cycling in synchronized out-of-phase (OP) triangular waves. The temperature varying from 100 to 250 oC in 10 minutes, is applied on right face of the specimen as shown in Fig. 3. The mechanical strain amplitude varying ±0.5 percent, is applied on bottom face of the specimen as shown in Fig. 3. The OP thermo-mechanical loading is shown in Fig. 4. The mentioned loading simulates cylinder heads at the most severe engine condition [5]. For models considering the absence of crack propagation, the influence of the thermal cyclic loading on stress distribution is not important [7], therefore, a single cycle is considered.
Fig. 1. Specimens after separation of coating layers from substrate in thermal shock test
[image:2.595.309.548.619.778.2]Fig. 3. Thermal and mechanical loadings applied to the specimen
Fig. 4. FE model of the specimen with meshed TBC system
III. RESULTS AND DISCUSSION
Thermo-mechanical stresses in y-direction which is through the coating thickness and along the interfaces of substrate/BC and BC/TC are shown in figures for different wave lengths and amplitude of semi-ellipsoid profile of the interfaces. Normal stresses lead to more probable mode I fracture; furthermore delamination of TBC is due to the effect of normal stress in y-direction, thus only this component of stress is studied. Moreover, in-phase (IP) and out-of-phase (OP) types for substrate/BC and BC/TC interfaces waves are considered for comparison purpose.
Fig. 5 shows the stress level in BC, TBC and substrate. Values of yield strength for TBC vary from 10 to 100 MPa while for BC is equal to 270 MPa [7,14]. According to the layers yield strength, the BC stress, both in substrate/BC and BC/TC is much higher than its yield value. Thus, that can be a reason for crack initiation that results the separation of BC layer from the base material and also from TC which can be considered as a failure mechanism in TBC system. This is confirmed by observation in thermal shock test. In the BC/TC interface, at TC side, the stress value is very low and has a compressive nature in most of distances. Thus for other cases only the stress distribution in BC layer, both in substrate/BC and BC/TC is considered.
-300 -200 -100 0 100 200 300 400
0 0.005 0.01 0.015 0.02 0.025 0.03
Distance (mm)
S
tress
i
n y-d
irecti
on (MP
a)
[image:3.595.310.548.66.445.2]Substrate/BC Interface, in BC Layer Substrate/BC Interface, in Substrate Layer BC/TC Interface, in BC Layer BC/TC Interface, in TC Layer
Fig. 5. Thermo-mechanical stresses in y-direction versus the distance of the profile, for in-phase roughness, wave length = 60 (micron) and amplitude = 15 (micron)
In Fig. 6, the IP and OP positioning of interface waves roughness are compared for a defined wave length and amplitude. At the BC/TC interface, the stress for both OP and IP roughness is similar. However, at the substrate/BC interface, the maximum tensile stress in y-direction is considerably lower in OP positioning of interface waves. Although tensile stress in OP positioning of waves is less than IP, but the tensile zone of peaks in substrate/BC and BC/TC merge in the middle of BC layer. This can provide a suitable condition for crack propagation.
The amplitude and wave length effects on the stress distribution in BC layer are shown in Figs. 7-10. For wave length effect, in order to make a better comparison, the normalized distance of the profile is used, where the distance is divided by the wave length,.
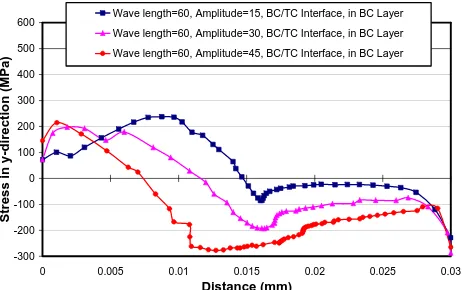
Figs. 7 and 8 show the influence of the interface amplitude on stress distribution. The maximum tensile stress at the peak in substrate/BC interface rises from 357 to 518 MPa when the roughness amplitude changes from 15 to 45 micron. Simultaneously, the compressive stress region increases and extends. These results are in good agreement with those given by Bialas [6] and Hsueh et al. [11]. Stresses in the BC/TC interface are less than those of substrate/BC and do not change considerably by varying amplitude.
TABLEI
MATERIAL PROPERTIES OF SUBSTRATE,BC AND TCLAYERS
Material Property Base Material BC Layer TC Layer
Young modulus (GPa) at different temperatures
72 at 25 oC
[17] 58 at 260 oC
[17]
183 at 25 oC
[7] 152 at 400 oC
[7]
17.5 at 25 oC
[7]
Expansion coefficient (1/C) [X 10-6]
at different temperatures
20.6 at 50 oC
[18] 22.2 at 200 oC
[18] 23.0 at 400 oC
[18]
10.3 at 100 oC
[7] 11.3 at 200 oC
[7] 12.5 at 400 oC
[7]
9.68 at 25 oC
[7] 9.70 at 200 oC
[7]
Poison's ratio 0.33 [17] 0.30 [7] 0.20 [7]
Conductivity (W/mK) 190.0 [18] 10.8 [5] 0.9 [5]
Specific heat (J/kgK) 963 [17] 450 [5] 505 [5]
[image:3.595.49.293.233.476.2]Figs. 9 and 10 show the influence of wave length magnitude on stress distribution. The maximum tensile stress at the peak falls from 518 to 419 MPa when the wave length magnitude changes from 60 to 120 micron.
By the results in Figs. 11-16,it is obvious thatthe peak regions of the asperities are subjected to tensile stresses, making possible crack propagation at the asperity interface. However, due to very high compressive stresses in the valley, cracks are not able to propagate into the valley region. As another result, for higher roughness amplitude and lower wave length magnitude, the region of
compressive stresses becomes wider and the region of tensile stresses becomes smaller leading to a larger TBC lifetime. -300 -200 -100 0 100 200 300 400
0 0.005 0.01 0.015 0.02 0.025 0.03
Distance (mm) St res s in y-dir ecti o n (M Pa)
[image:4.595.309.540.62.207.2]IP Roughness, Substrate/BC Interface, in BC Layer OP Roughness, Substrate/BC Interface, in BC Layer IP Roughness, BC/TC Interface, in BC Layer OP Roughness, BC/TC Interface, in BC Layer
Fig. 6. Thermo-mechanical stresses in y-direction versus the distance of the profile, for in-phase and out-of-phase roughness, in BC layer, wave length = 60 and amplitude = 15 (micron)
-300 -200 -100 0 100 200 300 400 500 600
0 0.005 0.01 0.015 0.02 0.025 0.03
Distance (mm) Str es s in y-di rec ti on (MPa)
Wave length=60, Amplitude=15, Substrate/BC Interface, in BC Layer
Wave length=60, Amplitude=30, Substrate/BC Interface, in BC Layer
[image:4.595.55.551.256.439.2]Wave length=60, Amplitude=45, Substrate/BC Interface, in BC Layer
Fig. 7. Thermo-mechanical stresses in y-direction versus the distance of the profile, at substrate/BC interface, for in-phase roughness, in BC layer, different amplitude and wave length = 60 (micron)
-300 -200 -100 0 100 200 300 400 500 600
0 0.005 0.01 0.015 0.02 0.025 0.03
Distance (mm) Str es s in y-di rec ti on (MPa)
Wave length=60, Amplitude=15, BC/TC Interface, in BC Layer
Wave length=60, Amplitude=30, BC/TC Interface, in BC Layer
Wave length=60, Amplitude=45, BC/TC Interface, in BC Layer
Fig. 8. Thermo-mechanical stresses in y-direction versus the distance of the profile, at BC/TC interface, for in-phase roughness, in BC layer, different amplitude and wave length = 60 (micron)
-600 -400 -200 0 200 400 600
0 0.1 0.2 0.3 0.4 0.5 0.6 0.7 0.8 0.9 1
Normalized Distance S tr ess i n y -d ir e ct io n ( M P a )
Wave length=60, Amplitude=45, BC/TC Interface, in BC Layer
Wave length=90, Amplitude=45, BC/TC Interface, in BC Layer
[image:4.595.50.284.460.607.2]Wave length=120, Amplitude=45, BC/TC Interface, in BC Layer
Fig. 9. Thermo-mechanical stresses in y-direction versus the distance of the profile, at substrate/BC interface, for in-phase roughness, in BC layer, different wave length and amplitude = 45 (micron)
-600 -400 -200 0 200 400 600
0 0.1 0.2 0.3 0.4 0.5 0.6 0.7 0.8 0.9 1
Normalized Distance S tr e s s in y -d ir e c tio n (M P a )
Wave length=60, Amplitude=45, Substrate/BC Interface, in BC Layer
Wave length=90, Amplitude=45, Substrate/BC Interface, in BC Layer
Wave length=120, Amplitude=45, Substrate/BC Interface, in BC Layer
[image:4.595.309.557.485.660.2]Fig. 11. Thermo-mechanical stress contour in y-direction, for in-phase roughness, wave length = 60 (micron) and amplitude = 15 (micron)
[image:5.595.47.559.199.308.2]Fig. 12. Thermo-mechanical stress contour in y-direction, for out-of-phase roughness, wave length = 60 (micron) and amplitude = 15 (micron)
[image:5.595.49.297.363.469.2]Fig. 13. Thermo-mechanical stress contour in y-direction, for in-phase roughness, wave length = 60 (micron) and amplitude = 30 (micron)
Fig. 14. Thermo-mechanical stress contour in y-direction, for in-phase roughness, wave length = 60 (micron) and amplitude = 45 (micron)
Fig. 15. Thermo-mechanical stress contour in y-direction, for in-phase roughness, wave length = 90 (micron) and amplitude = 45 (micron)
Fig. 16. Thermo-mechanical stress contour in y-direction, for in-phase roughness, wave length = 120 (micron) and amplitude = 45 (micron)
IV. CONCLUSION
The main object of this work is to improve the understanding of the stress development in TBC system. Mutual influence of waves positioning (in phase or out of phase) along with the variations of wave length and amplitude, improve the comprehension of the stress distribution. Cracking and spalling are vital TBCS failure modes both dependent on the nature and magnitude of stresses with respect to the relative yield strengths. Note that the yield strength represents the threshold stress of forming micro-cracks.
This study puts in evidence that the value of stress in substrate/BC interface is mostly higher than those of BC/TC layer. So separation of the TBC system from substrate, in cylinder heads application, is more probable than separation of BC and TC, which is more probable in gas turbines application.
Moreover the magnitude of stress increases when the roughness amplitude enhances and wave length shortens. This increasing in stress level leads to cracking in tensile region but high compressive stresses in the valley do not allow cracks propagate into the valley region. Cracks tend to propagate towards tensile zones. OP positioning of interfaces enhance a suitable path for crack propagation due to a tensile zone in the middle of the BC layer.
ACKNOWLEDGMENT
[image:5.595.48.294.521.621.2]REFERENCES
[1] T. Hejwowski and A. Weronski, “The effect of thermal barrier coatings on diesel engine performance”, Vacuum, Vol. 65, pp. 427-32, 2002.
[2] I. Taymaz, K. Cakir and A. Mimaroglu, “Experimental study of effective efficiency in a ceramic coated diesel engine”, Journal of Surface and Coating Technology, Vol. 200, pp. 1182-5, 2005. [3] I. Taymaz, “The effect of thermal barrier coatings on diesel engine
performance”, Journal of Surface and Coating Technology, Vol. 201, pp. 5249-52, 2007.
[4] P. Ramu and C.G. Saravanan, “Effect of ZrO2-Al2O3 and SiC coating
on diesel engine to study the combustion and emission characteristics”, SAE International, Paper No. 2009-01-1435, 2009 [5] E. Tzimas, H. Mullejansi, S.D. Peteves, J. Bressers and W. Stamss,
“Failure of thermal barrier coating systems under cyclic thermo-mechanical loading”. Acta Materialia, Vol. 48, pp. 4699-707, 2000 [6] M. Bialas, “Finite element analysis of stress distribution in thermal
barrier coatings”. Journal of Surface and Coating Technology, Vol. 202, pp. 6002-10, 2008.
[7] M. Ranjbar-Far, J. Absi, G. Mariaux and F. Dubois F, “Simulation of the effect of material properties and interface roughness on the stress distribution in thermal barrier coatings using finite element method”,
Material and Design, Vol. 31, pp. 772-81, 2010.
[8] P. Bengtsson and C. Persson, “Modelled and measured residual stresses in plasma sprayed thermal barrier coatings”, Journal of Surface and Coating Technology, Vol. 92, 78-86, 1997.
[9] S. Widjaja, A.M. Limaraga and T. Hon-Yip, “Modelling of residual stresses in a plasma sprayed zirconia/alumina functionally graded-thermal barrier coating”, Journal of Thin Solid Films, Vol. 434, pp. 216-27, 2003.
[10] F. Schubert, G. Fleuri and T. Steinhaus T, “Modelling of the mechanical behaviour of the single-crystal turbine alloy CMSX-4 during thermo-mechanical loading”, Journal of Model Simulation of Material Science and Engineering, Vol. 8, pp. 947, 2000.
[11] C.H. Hsueh and E.R. Fuller, “Residual stresses in thermal barrier coatings: effects of interface asperity curvature/height and oxide thickness”, Journal of Material Science and Engineering, Vol. A283, pp. 46-55, 2000.
[12] K. Sfar, J. Aktaa and D. Munz, “Numerical investigation of residual stress fields and crack behaviour in TBC systems”. Journal of Material Science and Engineering, Vol. A333, pp. 351-60, 2002. [13] prediction of thermally cycled thermal barrier coatings”, Journal of
Thermal Spray Technology, Vol. 13, pp. 415-24, 2004.
[14] M. Ranjbar-Far, J. Absi, S. Shahidi and G. Mariaux, “Impact of the non-homogenous temperature distribution and the coatings process modelling on the thermal barrier coatings system”, Material Design,
Vol. 32, pp. 728-35, 2011.
[15] K.M. Zhao and J.K. Lee, “Finite element analysis of the three-point bending of sheet metals”, Journal of Material Process Technology,
Vol. 122, pp. 6-11, 2011.
[16] T. Takahashia and K. Sasaki, “Low cycle thermal fatigue of aluminium alloy cylinder head in consideration of changing metrology microstructure”, Proccida Engineering, Vol. 2, pp. 767-76, 2010. [17] J.G. Kaufman, Properties of Aluminum alloys; Tensile, creep and
fatigue data at high and low temperature, The Aluminum Association, Inc. and ASM International, 1999.