University of Warwick institutional repository: http://go.warwick.ac.uk/wrap This paper is made available online in accordance with publisher policies. Please scroll down to view the document itself. Please refer to the repository record for this item and our policy information available from the repository home page for further information.
To see the final version of this paper please visit the publisher’s website. Access to the published version may require a subscription.
Author(s): Steve Strand
Article Title: Surveying the views of pupils attending supplementary schools in England Year of publication: 2007
Link to published version:
Surveying the views of pupils attending
supplementary schools in England.
Dr Steve Strand
Institute of Education
University of Warwick
This paper was subsequently published as:
Strand, S. (2007). Surveying the views of pupils attending supplementary
schools in England, Educational Research, 49, (1), 1-19.
ACKNOWLEDGEMENTS
This study was funded by the Centre for British Teachers (CfBT) and the African Schools Association (ASA) as part of the evaluation of the Departmemt for Education and Skills (DfES) funded Supplementary School Support Service. We gratefully acknowledge the co-operation and support of the CfBT/ASA staff and the teachers and students of the 63 supplementary schools who participated in the research, too numerous to mention individually.
Surveying the views of pupils attending supplementary schools in England.
ABSTRACT
offering grant aid to supplementary schools that provide study support using the medium of English for pupils from ethnic minority communities in England. Supplementary schools are community based organisations that provide additional learning activities such as literacy, numeracy, ICT, homework support or a culturally relevant curriculum.
This report is the first part of a wider research project intended to evaluate the role of supplementary school in supporting pupils’ educational progress. This study reports on the first phase of this research An attitude survey to find out what young people think about mainstream and supplementary education, about the core subjects of reading and
mathematics, about themselves as learners and about their reasons for attending
supplementary school.. Pupil questionnaires were sent to all schools who were successful in being awarded grants from the support service. Schools were asked to administer the
questionnaires to ten nominated pupils within the school, although they could give the questionnaire to more than 10 pupils if they chose. Questionnaires were returned from a total of 772 pupils attending 63 supplementary schools in four major cities in England. This is the first study to systematically explore the attitudes of pupils attending supplementary school in England and is the largest ever study of supplementary schools and their pupils.
Overall, pupils were very positive about supplementary school. Seventy-four percent reported that they were happy when they were at supplementary school, 84% reported supplementary school helped them with their (mainstream) school work, 84% said they got on well with the supplementary school teacher, 75% said the work they did at supplementary school was interesting and 70% disagreed with the statement that I am bored at supplementary school. Pupils were also generally positive about mainstream school. However they were more positive about supplementary school than they were about mainstream school. For example while 22% said they were bored in mainstream school lessons only 12% reported they were bored in supplementary school lessons.
There was a significant age trend in attitudes to mainstream school with older pupils reporting less positive attitudes to mainstream school. While the same trend existed in
attitude to supplementary school it was not statistically significant. Older pupils did not have significantly less positive attitudes to supplementary school than their younger peers. This suggests that supplementary school continue to motivate and engage older pupils who may become disaffected with mainstream school. This is a significant strength of supplementary schools.
There were few sex differences in attitudes. Girls liked reading more than boys and were less likely to want to do other things than reading. Boys liked maths and sums more than girls and were more likely to believe they were good at maths. No other significant sex differences were found.
There was some evidence to indicate that pupils who had been attending supplementary school for a longer period of time, more than a year, had more positive attitudes to
mathematics than their peers. Those who had been attending supplementary school for less than 6 months or for 7-12 months had significantly less positive scores for maths than those who had been attending for 1-3 years or for more than 3 years. This does not establish any causal link between these factors. Nevertheless it is an encouraging result.
The reasons pupils attended supplementary school were varied. The most frequently reported reason was to get extra help in things that pupils found difficult. This was cited by over one-third (68%) of all pupils. However, it was also notable that a significant minority (27%) attended supplementary school “to do more of the things they felt they were good at”. Around one-third (35%) reported that they attended because their parents wanted them to, and 29% because it was fun. 20% attended because their friends were there. There are interesting differences in the reasons pupils give for attending supplementary school depending upon their age. Older pupils were more likely to attend to get extra help in things they found difficult but less likely to attend because their parents want them to or because it was fun. In an analysis of an open-ended question the most frequent reasons given for attending
supplementary school were general educational improvement (39% of pupils), learning about home language or culture (21%), improvement of English or maths (12%), help with
mainstream school (11%) and general fun/enjoyment (7%).
Pupils were asked what they most liked about supplementary school. The most frequent responses were general learning (20% of pupils), social activity and meeting friends (15%),
learning particular National Curriculum subjects (13%), getting help with mainstream school (10%), learning home language/culture (10%), their teachers (10%), using computers and ICT (6%), the general qualities of the school (6%), specific activities and sports (5%) and the benefits of small classes (2%). A detailed breakdown of pupils’ responses is given in Table 14.
Pupils were also asked what if anything they did not like about supplementary school. The most frequent response, accounting for 29% of the responses, was that there was nothing the pupils disliked! Where issues were reported, most frequently these related to the organisation of the school or the curriculum provided (17%), the fact that school was held on a Saturday morning (8%), dislike of specific subjects (8%), the school social environment including peers (8%), a lack of difficulty in the work provided (8%), poor resources (6%), poor physical environment (5%) and particular aspects of the teaching (4%). Similar issues are often raised by pupils about mainstream schools, so these comments should not be taken as specific to supplementary school. Most of the responses were constructive and much can be gained by supplementary schools in listening and acting on such pupil feedback. A detailed breakdown of pupils’ responses is given in Table 15.
Supplementary school tutors were asked to provide feedback on the process of administering the pupil questionnaires. Tutors reports were very positive, indicating that the questionnaire was easy and quick to administer in practical terms, and would prove useful in their own evaluations.
RECOMMENDATIONS
Supplementary schools should consider using the questionnaire in their own self-evaluation. The large amount of data collected in this study can operate as a comparative base for schools to evaluate the attitudes of their own pupils against a wider sample. They should supplement this questionnaire with any other questions they feel are particularly important for their own contexts (See Appendix 2 for some of the additional questions suggested by supplementary school tutors).
This study has produced a large store of baseline questionnaire data that could be used to track the future progress of the sample. The logistics of tracking these pupils may be problematic given the high level of spelling errors in the pupil name data, especially where pupils may have left the supplementary school they were attending in June 2001. However there may be value in attempting to approach these pupils again at the start of summer term 2002 to repeat the questionnaire and gauge any changes in the intervening 12 months.
Having a single questionnaire for use across the entire age range from KS1 to KS4 can be problematic. Future projects should focus on a particular key stage/s. It may be valuable to have both a primary and a secondary project.
Further in-depth study should be completed with the 15 schools receiving the ‘partnership grants’. These schools receive a large financial grant relative to those receiving the ‘small grants’ and ‘youth grants’. Focusing on a smaller number of pupils will allow more detailed information to be collated on the experience of each pupil. The mainstream schools these pupils attended should also be involved in the project, and sufficient inducements to enlist their support will be needed.
There may be advantages to working in partnership with Local Education Authorities (LEAs) in areas with large concentrations of supplementary schools. Some LEAs have extensive pupil databases which might facilitate collection of data on pupils’ attainment in mainstream school.
INTRODUCTION
Supplementary schools broadly refer to extra schooling organised by and for particular ethnic groups outside of mainstream provision. These schools are organised mainly on Saturdays, hence are also sometimes called Saturday schools, but can be held on Sundays or weekdays before or after mainstream school. Most schools are run for three to four hours a week in youth clubs, community centres, places of worship and state-maintained schools. In general supplementary schools are non profit making organisations, frequently registered as charities, that often rely on enthusiastic and dedicated volunteers and on the generosity of funders to operate. They may differ in size from 10 to 300 or more pupils, and in the subjects they teach or the activities they engage in. No one knows the number and size of supplementary schools in the UK, there exist no official records or national surveys of such schools. While
supplementary schools are as diverse as the communities they serve, Abdelrazak (2000) argues that most of them do not differ in their fundamental aims, which can be summarised as: (i) developing the minority ethnic child’s cultural identity, self-esteem and confidence; (ii) promoting the achievement of minority ethnic children in state-maintained schools. For a review of the history of supplementary schools readers are referred to Mathesion (1995), Newton (1995), Richards (1995) and Rutter (1978).
A search was made of the BEI and ERIC electronic databases to ascertain the research
evidence in relation to the above two aims. The British Education Index (BEI) is produced by the University of Leeds and provides references to 350 British and selected European
English-language periodicals in the field of education and training. Education Resources Information Centre (ERIC) is sponsored by the US Department of Education and corresponds to the printed indexes Resources in Education and Current Index to Journals in Education.
BEI and ERIC have a subject headings system by which all articles are indexed. The subject headings include Supplementary Education as a main term. The scope (definition) of the term is defined as:
Education provided outside the normal school curriculum, usually to enable an individual to develop an increased knowledge of the religion or culture of his/her ethnic group, or to develop some special skill (Note: do not confuse with
“Remedial Education” or “Special Educational Needs”).
A search on “Supplementary Education”, limited to articles published in the last ten years (1991-2001), generated only 9 references from BEI. Clearly there is very little UK research in this area. A similar search of the US ERIC database revealed 314 references. However the majority of these related to Supplementary Instruction (SI). These are predominantly programmes for ethnic minority undergraduates in US universities and bear little relation to Supplementary Education in terms of the schools who are the focus of this research. (For an excellent review of the scope, content and effectiveness of SI programmes see Congos & Schoeps, 1993). A further search for ‘supplementary education’ excluding ‘instruction’ found only 55 references. There were no articles giving any evaluation of the impact of
supplementary education in terms of pupils’ educational outcomes or attitudes. It is clear that there is little published research on supplementary education in the UK. This supports the observation of Bastiani (2000) that “there is very little literature and no hard evidence (especially systematic comparative data) on the topic of supplementary schools as such” (p10).
In summary, as far a supplementary education in the UK is concerned there is:
• No previous research at a national level;
• Some case studies but no large scale quantitative studies; • No long term tracking of pupil progress over time.
The current study
This study was funded by the Centre for British Teachers (CfBT) and African Schools Association (ASA) as one part of the evaluation of the Supplementary School Support Service (SSSS). These organisations run the Supplementary School Support Service, which was a one year pilot project funded by the Department for Education and Skills (DfES). The service aims are to:
• Contribute to raising the achievement of ethnic minority pupils in National Curriculum subjects;
• Promote co-operation between mainstream and supplementary schools;
• Build the management capacity of supplementary schools; • Share good practice between supplementary schools.
The service offered a total of £600,000 in grant funding in 2001 to organisations that run supplementary schools. Grants of £10,000 (partnership grants) and £2,000 (small grants, youth grants) were available to community organisations in Bristol, Birmingham, London or Manchester that provided learning activities in English for ethnic minority pupils. All
supplementary schools that applied for and received grants were included within the research project.
The results reporterd here are from the first phase of the stiudty. The initial aim was to gather evidence of the effect of supplementary school through a large scale attitude survey to find out what young people think about mainstream and supplementary education, about the core subjects of reading and mathematics, about themselves as learners and about their reasons for attending supplementary school;
The Research Design
The questionnaire
A questionnaire was required to find out what young people thought about mainstream and supplementary education, about the core subjects of reading and mathematics and about themselves as learners. The target age range was pupils in Key Stage 2 (age 7-11), although ultimately pupils from a much wider age range were involved. A survey of existing attitude measures for primary age pupils revealed that no existing questionnaires addressed all these areas. A specific questionnaire was therefore developed for the project. The questioaire covered six broad areas:
• Attitudes to mainstream school - 5 statements • Attitudes to supplementary school - 5 statements • Attitudes to reading – 5 statements
• Attitudes to mathematics - 5 statements • Attitudes to learning - 10 statements
• The reasons pupils attended supplementary school and what they liked and disliked about
supplementary school.
A copy of the questionnaire is attached as Appendix 1.
The questions asked pupils to rate how they felt about each of the 30 statements on a five point scale ranging from ‘strongly agree’ through to ‘strongly disagree’. In order to avoid response bias, positively and negatively worded statements were intermingled throughout the questionnaire. This was done to avoid the situation where some pupils might give ‘strongly agree’ responses throughout because they felt it was expected of them. The negatively worded items were 1.2, 2.1, 3.3, 3.5, 3.8, 3.9 and 4.3.
Tutor feedback indicated the questionnaire took around 15 minutes to complete, that there were no significant difficulties in administering the questionnaire, no inappropriate questions and supported the project. See Strand (2002) for a detailed analysis of supplementary school tutors feedback on the questionnaire and its administration.
Factual information on each pupil was also collected including their name, date of birth, the name of their Saturday school, the date they completed the questionnaire, how long they had attended supplementary school and the number of books in their home. This information was collected for two reasons. First so that the response to the questionnaire could be linked to a second questionnaire repeated by the pupils at the end of the year. In the event delays in starting the project meant it was not feasible to administer the second questionnaire. Second, the information also let us complete analyses by background variables, for example to look separately at the responses for boys and for girls.
The notes of guidance accompanying the questionnaire are also given in Appendix 1. Tutors were asked to complete some demonstration questions with the class so that pupils
understood the format of the questions. They were also asked to stress that the questions were asking the pupils how they felt about the question and that there were no right or wrong answers.
Distribution of the questionnaires and sampling strategy
The questionnaires were sent out to schools as and when they were awarded grants from the
supplementary school support service.. Questionaires were disteribured to 72 schools,returns were receibed frin 63 school *(88%) which is very high. Thre design decided on a sampling strategy that would require schools to identify 10 named pupils to participate in the research project. Each school receiving funding was required to nominate 10 pupils, obtain permission from their parents/carers to their participation in the project and forward these details to CfBT. The purpose of the sampling strategy was to avoid overburdening schools with the administrative requirement to complete a large number of questionnaires. However schools had the option to use the questionnaire with more than the 10 nominated pupils if they chose to.
RESULTS
DESCRIPTION OF THE SAMPLE
Questionnaires were returned for 772 pupils attending 63 supplementary schools in four major geographical regions on England. In the event the vast majority of schools (53 schools or 84%) returned between 7 and 15 questionnaires. Five schools returned less than 7
questionnaires and 5 returned more than 15 questionnaires.
[image:12.595.63.497.565.695.2]The mean age of the sample was 12:1 with a standard deviation of 34 months i.e. two thirds of pupils fell in the age range 9:03 - 14:11. A breakdown by key stages is given in the Table below.
TABLE 2: Numbers of pupils by age band
Age range Frequency Percent
Key Stage 1 ( 5 - 7 ) 53 7.6
Key Stage 2 ( 7 - 11 ) 264 30.2
Key Stage 3 (11- 14 ) 239 34.2
Key Stage 4 ( 14+ ) 196 28.0
Valid total 699 100.0
Date of birth was unknown for 73 pupils.
The sample comprised 52% girls and 48% girls (sex was not given for 2.3% of pupils).
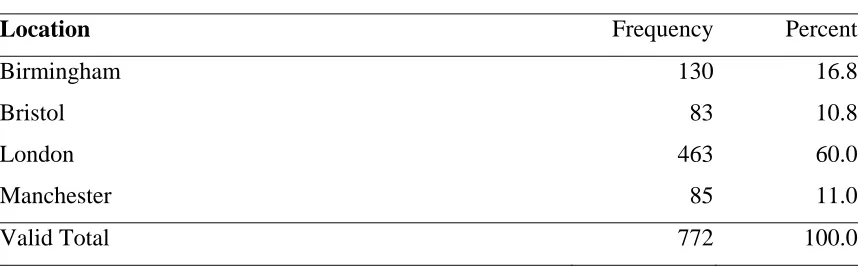
The majority of pupils (60%) were from the London region. This reflects both the greater population density in London, but also the greater number of supplementary schools in London per head of population.
TABLE 3: Number of pupils by region
Location Frequency Percent
Birmingham 130 16.8
Bristol 83 10.8
London 463 60.0
Manchester 85 11.0
Valid Total 772 100.0
[image:14.595.65.495.320.427.2]
There were slightly more pupils from schools receiving partnership grants than from schools receiving small grants or youth grants.
TABLE 4: Number of pupils and schools by Grant Type
Grant type Frequency Percent
Small Grant 231 29.9
Partnership Grant 327 42.4
Youth Grant 203 26.3
Valid Total 761 100.0
Note: Data was missing for 11 pupils.
Pupils were asked how long they had been attending supplementary school. A large proportion 35% had only started attending supplementary school in the last six months. However one-fifth (20%) had been attending supplementary school for more than three years.
TABLE 5: How long have you been coming to Saturday school?
Frequency Percent
Less than 6 months 250 35.0
About 6 to 12 months 124 17.4
More than 1 year but less than 3 years 192 26.9
More than 3 years 148 20.7
Total valid 714 100.0
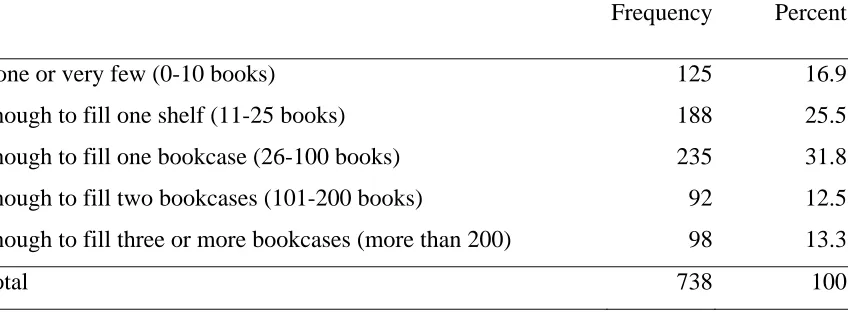
Pupils were asked to report the approximate number of books (excluding magazines, newspapers or any school books) in their home. This measure has been used in many
[image:14.595.74.495.570.701.2]international studies as a proxy indicator for the educational level of the home. The results are shown in the table below.
TABLE 6: About how many books are there in your home (excluding magazines,
newspapers or any school books)?
Frequency Percent
None or very few (0-10 books) 125 16.9
Enough to fill one shelf (11-25 books) 188 25.5 Enough to fill one bookcase (26-100 books) 235 31.8 Enough to fill two bookcases (101-200 books) 92 12.5 Enough to fill three or more bookcases (more than 200) 98 13.3
Total 738 100
These results can be contrasted against other large datasets. Two other studies are particularly relevant. First, the question was used by the National Foundation for Educational Research (NFER) in a national survey of the attitude to school of over 2,274 Year 6 and Year 7 pupils in England and Wales in summer 1995 (Keys, Harris and Fernandes, 1995). The sample of schools were stratified by size (in terms of number of pupils), type of school (Infant, Junior, Comprehensive, Other Secondary, Independent), region (North, Midlands, South) and type of LEA (metropolitan or non-metropolitan) to be representative of the national population. Second, the question was used in the national evaluation of the first 25 study support summer schools funded by the DfES in summer 1999 (Mason et. al., 2000). The NFER administered pre and post course attitude questionnaires to 1,409 pupils attending these summer schools. The target groups for the summer schools were “underachievers, those with special needs or those considered socially disadvantaged” (Mason et. al., 2000, page vi).
The three studies are compared in the figure below. It can be seen that around 42% of the supplementary school sample reported 25 or less books in the home, compared to 29% of the summer school sample and 16% of the national sample. Equally, only 25% of the
supplementary school sample reported more than 100 books in the home, compared to 39% of the summer school sample and 57% of the national sample. It is apparent that the
supplementary school sample are more disadvantaged on this measure, compared both to the national sample and to the summer school sample.
FIGURE 1: About how many books are there in your home?: Comparison of
supplementary school sample with two other large datasets
0 1 0 2 0 3 0 4 0 5 0 6 0
percentage of pupils
0 - 2 5 b o o k s 2 6 - 1 0 0 b o o k s 1 0 1 + b o o k s
0 - 2 5 b o o k s 1 5 . 9 2 8 . 9 4 2 . 4
2 6 - 1 0 0 b o o k s 2 7 . 4 3 1 . 7 3 1 . 8
1 0 1 + b o o k s 5 6 . 7 3 9 . 4 2 5 . 7
N F E R n a t io n a l s u r v e y 1 9 9 5
S t u d y S u p p o r t S u m m e r S c h o o ls
1 9 9 9
S u p p le m e n t a r y S c h o o ls P r o j e c t
[image:16.595.65.561.159.485.2]QUESTIONNAIRE OUTCOMES
Introduction
In reporting these results two formats will be used.
In the first format we will simply report the percentage of pupils making each response to each question, and will aggregate the responses of those who ‘strongly agree ‘ or ‘agree’, and separately aggregate the responses of those who ‘strongly disagree’ or ‘disagree’. This gives basic information on pupil responses to the questions.
However for analytic purposes it is frequently easier to convert responses to numeric scores so that responses can be analysed more readily for groups of pupils to determine patterns or sequences in the results. Scale scores have been created by allocating a scores to each
question from 1 for ‘strongly agree’ through to 5 for ‘strongly disagree’. Where agreeing with the statement indicates a negative evaluation (e.g. I am bored in lessons) these scores are reversed so that a score of 1 is given to ‘strongly disagree’ and 5 to ‘strongly agree’. These scores can then be averaged for each pupil and for each subject area. A low score will indicate a positive evaluation while a high score will indicate a less positive evaluation.
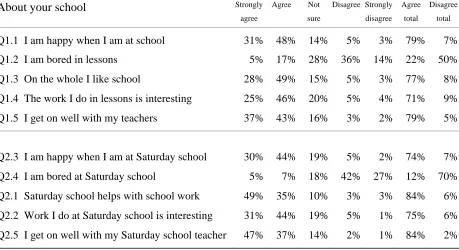
Attitudes to mainstream and supplementary school
Table 7 gives the results for the ten questions related to attitudes to school. Overall, pupils were very positive about supplementary school. A total of 84% reported supplementary school helped them with their (mainstream) school work, 84% said they got on well with the supplementary school teacher, 75% said the work they did at supplementary school was interesting, 74% reported that they were happy when they were at supplementary school and 70% disagreed with the statement that I am bored at supplementary school.
Pupils were also positive in their attitudes to mainstream school. Thus 79% reported they were happy at school, 79% reported that they go on well with their teachers, 77% reported that on the whole they liked school, 71% found the work they did in lesson interesting and 50% disagreed with the statement I am bored in lessons.
TABLE 7: responses to questions about mainstream and supplementary school
About your school Strongly
agree
Agree Not sure
Disagree Strongly disagree
Agree total
Disagree total
Q1.1 I am happy when I am at school 31% 48% 14% 5% 3% 79% 7% Q1.2 I am bored in lessons 5% 17% 28% 36% 14% 22% 50% Q1.3 On the whole I like school 28% 49% 15% 5% 3% 77% 8% Q1.4 The work I do in lessons is interesting 25% 46% 20% 5% 4% 71% 9% Q1.5 I get on well with my teachers 37% 43% 16% 3% 2% 79% 5%
Q2.3 I am happy when I am at Saturday school 30% 44% 19% 5% 2% 74% 7% Q2.4 I am bored at Saturday school 5% 7% 18% 42% 27% 12% 70% Q2.1 Saturday school helps with school work 49% 35% 10% 3% 3% 84% 6% Q2.2 Work I do at Saturday school is interesting 31% 44% 19% 5% 1% 75% 6% Q2.5 I get on well with my Saturday school teacher 47% 37% 14% 2% 1% 84% 2%
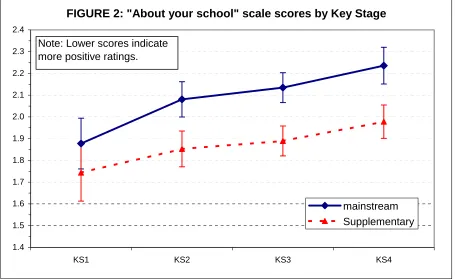
However overall they were more positive about supplementary school than about mainstream school. This can be seen in Figure 2 below which plots the scale scores for attitudes to
mainstream and supplementary school respectively. Lower scores represent more positive attitudes to school and the results indicate consistently more positive attitudes to
supplementary school (p<.01).
There was a significant age trend in attitudes to mainstream school with older pupils reporting less positive attitudes to mainstream school. While the same trend existed in attitude to supplementary school it was less marked. Older pupils did not have significantly less positive attitudes to supplementary school than their younger peers. This suggests that supplementary school continues to motivate and engage older pupils who may become disaffected with mainstream school. This is a significant strength of supplementary school.
FIGURE 2: "About your school" scale scores by Key Stage
1.4 1.5 1.6 1.7 1.8 1.9 2.0 2.1 2.2 2.3 2.4
KS1 KS2 KS3 KS4
mainstream Supplementary Note: Lower scores indicate
more positive ratings.
About Reading and Mathematics
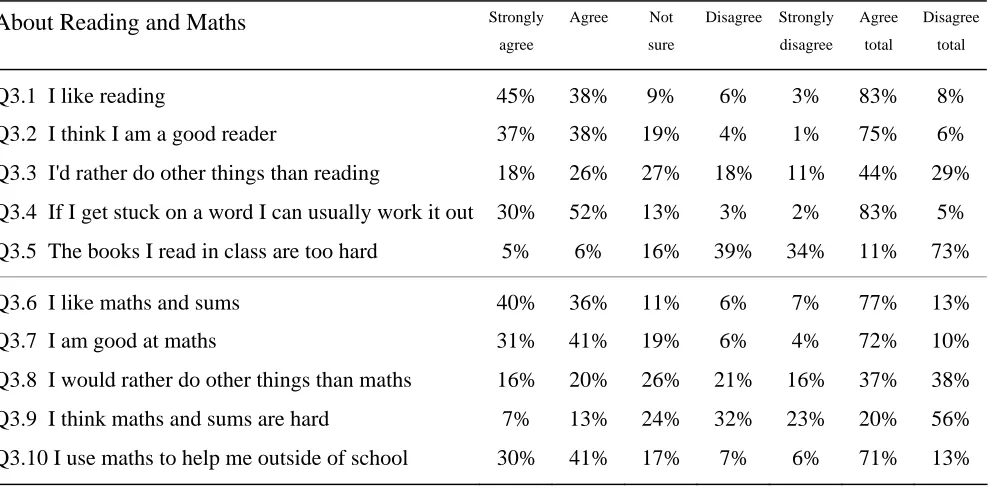
Again pupils were generally positive in their attitudes to reading and to maths, as indicated in the table below.
In relation to reading, 83% of pupils liked reading, 83% reported that if they got stuck on a word they could usually work it out, 75% considered themselves good readers, 73% disagreed with the statement ‘the books I read in class are too hard’ and only 29% would rather do other things than reading.
Similarly for mathematics 77% liked maths and sums, 72% think they are good at maths and sums and 71% use maths to help them outside of school. However overall these responses are less positive than the equivalent questions for reading. This is particularly notable in that over a third (38%) would rather do something else than maths, compared to 29% who would rather do something else than reading, and 20% think that maths and sums are hard compared to only 11% who considered the books they read were too hard.
[image:19.595.68.523.78.357.2]TABLE 8: Responses to question about Reading and Mathematics
About Reading and Maths Strongly agree
Agree Not sure Disagree Strongly disagree Agree total Disagree total
Q3.1 I like reading 45% 38% 9% 6% 3% 83% 8% Q3.2 I think I am a good reader 37% 38% 19% 4% 1% 75% 6% Q3.3 I'd rather do other things than reading 18% 26% 27% 18% 11% 44% 29% Q3.4 If I get stuck on a word I can usually work it out 30% 52% 13% 3% 2% 83% 5% Q3.5 The books I read in class are too hard 5% 6% 16% 39% 34% 11% 73% Q3.6 I like maths and sums 40% 36% 11% 6% 7% 77% 13% Q3.7 I am good at maths 31% 41% 19% 6% 4% 72% 10% Q3.8 I would rather do other things than maths 16% 20% 26% 21% 16% 37% 38% Q3.9 I think maths and sums are hard 7% 13% 24% 32% 23% 20% 56% Q3.10 I use maths to help me outside of school 30% 41% 17% 7% 6% 71% 13%
Attitudes to learning and learning activities
Detailed responses to each question are given in the table below.
TABLE 9: Responses to attitudes to learning and learning activities
Attitudes to learning and learning activities Strongly agree Agree Not sure Disagree Strongly disagree Agree total Disagree total
Q4.1 I work as hard as I can in class 42% 44% 10% 3% 1% 87% 4% Q4.2 I know how to be a good learner 36% 47% 14% 3% 1% 82% 3% Q4.3 I'm not very good at solving problems 6% 19% 32% 31% 12% 25% 43% Q4.4 When given new work, I feel confident I can do it 28% 47% 19% 5% 2% 75% 7% Q4.5 I like having problems to solve 25% 32% 24% 13% 7% 56% 20% Q4.6 I feel good about myself 42% 44% 11% 3% 0% 87% 3% Q4.7 I like lessons where I can work with my friends 56% 34% 6% 3% 1% 90% 4% Q4.8 I like lessons where I can work on my own 19% 35% 20% 17% 10% 54% 27% Q4.9 I like lessons where we talk about our ideas 45% 40% 9% 5% 1% 85% 6% Q4.10 I like lessons where I can make something 50% 35% 10% 4% 1% 85% 5%
Pupils showed strong support for lessons where they could work with their friends (90%) talk
[image:20.595.68.562.501.731.2]about their ideas (85%) or be involved in practical activities such as making something (85%). There was a less positive rating for lessons where pupils worked on their own, although 50% still reported they liked such lessons.
Questions 4.1 to 4.6 were aggregated to create an attitude to learning scale. This incorporated an affective component (“I work as hard as I can in class, I like having problems to solve”), a self-evaluation of the pupil’s learning and problem solving skills (“I know how to be a good learner, I’m not very good at solving problems, when given new work I feel confident I can do it”) and a measure of global self-esteem (“I feel good about myself”). This will be discussed more fully in subsequent sections.
Sex Differences
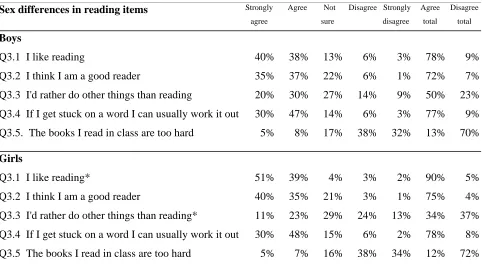
[image:21.595.66.548.442.709.2]Table 10 present a breakdown of the results for the reading questions separately for boys and girls.
TABLE 10: Sex differences in responses to reading items
Sex differences in reading items Strongly agree
Agree Not sure
Disagree Strongly disagree
Agree total
Disagree total
Boys
Q3.1 I like reading 40% 38% 13% 6% 3% 78% 9% Q3.2 I think I am a good reader 35% 37% 22% 6% 1% 72% 7% Q3.3 I'd rather do other things than reading 20% 30% 27% 14% 9% 50% 23% Q3.4 If I get stuck on a word I can usually work it out 30% 47% 14% 6% 3% 77% 9% Q3.5. The books I read in class are too hard 5% 8% 17% 38% 32% 13% 70%
Girls
Q3.1 I like reading* 51% 39% 4% 3% 2% 90% 5% Q3.2 I think I am a good reader 40% 35% 21% 3% 1% 75% 4% Q3.3 I'd rather do other things than reading* 11% 23% 29% 24% 13% 34% 37% Q3.4 If I get stuck on a word I can usually work it out 30% 48% 15% 6% 2% 78% 8% Q3.5 The books I read in class are too hard 5% 7% 16% 38% 34% 12% 72%
Note: * indicates an item with a significant sex difference in favour of girls.
T-tests revealed significant sex differences on questions 3.1 and 3.3. These two questions ask
about children's enjoyment of reading: girls like reading more than boys and girls are less likely to want to do other things than reading. Questions 3.2, 3.4 and 3.5, which asked children to judge how good they are at reading, did no indicate any significant sex differences.
[image:22.595.72.541.321.610.2]
Table 11 presents a similar analysis for the mathematics questions. T-tests revealed a slight but significant difference in favour of boys on two questions. Boys were more likely than girls to report that they liked maths and sums and that they were good at maths and sums. However the sex difference in scale score for mathematics was not statistically significant.
TABLE 11: Sex differences in response to mathematics items
Strongly agree
Agree Not sure
Disagree Strongly disagree
Agree total
Disagree total
Boys
Q3.6 I like maths and sums* 42% 35% 12% 7% 3% 77% 47% Q3.7 I am good at maths* 33% 38% 21% 5% 3% 71% 59% Q3.8 I would rather do other things than maths 14% 21% 25% 19% 20% 36% 47% Q3.9 I think maths and sums are hard 7% 12% 25% 30% 26% 19% 37% Q3.10 I use maths to help me outside of school 29% 37% 22% 7% 5% 66% 59%
Girls
Q3.6 I like maths and sums 36% 36% 13% 8% 7% 72% 48% Q3.7 I am good at maths 26% 40% 20% 8% 5% 66% 60% Q3.8 I would rather do other things than maths 15% 22% 27% 21% 15% 37% 49% Q3.9 I think maths and sums are hard 7% 14% 22% 35% 23% 21% 35% Q3.10 I use maths to help me outside of school 29% 44% 15% 8% 4% 73% 59% * Indicates an item with a significant sex difference in favour of boys,
There were no significant sex differences in attitudes to school or in attitudes to learning or learning activities.
The effect of length of attendance at supplementary school.
A multivariate analysis of variance (MANOVA) was completed to look at the effect of length of attendance at supplementary school on each of the five scale scores (attitudes to
[image:23.595.56.552.340.677.2]supplementary school, mainstream school, reading, mathematics and attitudes to learning). The MANOVA allowed the influence of length of attendance to be assessed while controlling for differences associated with sex and age. The results indicated that pupils who attended supplementary school for a longer period of time had more positive attitudes to maths. Those who attended for less than 6 months or for 7-12 months had significantly less positive scores for maths than those who had attended for 1-3 years or for more than 3 years. This does not demonstrate any causal link between these variables. Nevertheless it is an encouraging result. These results are illustrated in the figure below.
FIGURE 3: Reading, maths and myself as a learner scale scores by
how long the student has attended supplementary school
1.6 1.7 1.8 1.9 2.0 2.1 2.2 2.3 2.4 2.5 2.6
Less than 6 months 6 -12 months >1 but <3 years > 3 years
reading
maths
Learning
Note: Lower scores indicate
more positive ratings.
l
The full results of the MANOVA are given in Appendix 3.
Why do pupils attend supplementary school?
[image:24.595.63.523.237.518.2]Question 12 asked pupils why they came to supplementary school. Pupils were asked to tick any of the following reasons. Pupils were allowed to tick more than one reason so the totals sum to greater than 100%.
TABLE 12: Why I come to supplementary school.
I come to Saturday school….. Key Stage
KS1 KS2 KS3 KS4 All age
groups
(5-7) (7-11) (11-14) (14+)
to get extra help in things I find difficult 55% 64% 69% 75% 68% because my parents want me to 49% 43% 29% 30% 35%
because it's fun 47% 31% 25% 27% 29%
to do more of the things I'm good at 28% 25% 29% 26% 27%
other reason (see below) 26% 25% 21% 22% 22%
because my friends are here 15% 18% 20% 18% 20%
The most frequently reported reason for attending supplementary school was to get extra help in things that pupils found difficult. This was cited by over one-third (68%) of all pupils. However, it was also notable that a significant minority (27%) attended supplementary school “to do more of the things they felt they were good at”. Around one-third (35%) reported that they attended because their parents wanted them to, and 29% because it was fun. 20% attended because their friends were there.
There are interesting differences in the reasons pupils give for attending supplementary school depending upon their age. Thus the proportion of pupils attending to get extra help in things they find difficult increases systematically across key stages from 55% at KS1 to 75% at KS4. Similarly the proportion attending because their parents want them to, decreases from
49% at KS1 to 30% at KS4. The proportion attending because it is fun reduces in a similar fashion from 47% at KS1 to 27% at KS4. These results may indicate pupils taking greater ownership of their learning as they grow older, including realising their own need for additional support in specific areas.
Pupils were asked for ‘any other’ reason they attended supplementary school to allow a free response to the question in contrast to the predetermined choices listed above. 169 pupils (22%) supplied an ‘any other’ reason for attending supplementary school.
These reasons were coded into six categories, as given in the table overleaf. The table gives examples of pupils’ responses for each category to illustrate the basis of the categorisation. The % figures relate to the proportion of students who made a response.
The most frequent reasons given for attending supplementary school were categorised as general educational improvement, mentioned by 39% of the 169 pupils responding to the question. The next most frequent set of reasons were to understand home culture or to improve a home language (21%). The third most frequent category of responses were improvement of English or mathematics (12%) closely followed by help with mainstream school (11%). Lastly, for a smaller proportion of pupils their reasons related to general fun/enjoyment (7%) and to the opportunity to undertake other specific activities such as dance, drawing or sport (6%). Seven responses were uncodeable.
TABLE 13: Results for the question I come to Saturday school because (other reason)?
Category N % Typical comments
General educational improvement
66 39.1% • My teacher helps me with things I cannot do and I learn something extra when I am there.
• Family say I need more confidence.
• Because I want to learn more and understand things which are difficult for me.
• I can learn things that I've never learned before. • Got excluded from last school.
• It will help me and this is good because it's free! • Because I love my work, it is things I have done before
but I still get better. To understand home
culture / improve home language
36 21.3% • To learn Vietnamese (my own language).
• To study my mother tongue and to learn African history.
• Learn more about Urdu and do GCSE. • To help me read and write in Arabic. Improve mathematics
and English
20 11.8% • Because I want to be better at maths mostly. • I want to learn more English and learn more about
study.
• To improve more at maths and English. Help with
mainstream school
19 11.2% • Makes me have more confidence with subjects I have difficulty with.
• It helps you so when you go back to school you know more.
• Help with my GCSE coursework.
• For teachers to check my homework done from my mainstream school.
• Get some more education for SATS. • So I pass my 11+.
• Because I need to get ready for my 11+. Fun, enjoyment,
social activity
11 6.5% • It’s like one big family. • To socialise.
• Because it gets me out of the house and I enjoy it. • I like playing with my friends.
Other specific subjects and sport
10 5.9% • dance or dancing, drawing, football
What do I most like about supplementary school?
Pupils were asked the open ended question “What do you most like about supplementary
school?”. Responses were coded into 12 categories. Because pupils frequently gave more than one reason/activity which they liked about supplementary school, a pupil’s response could be coded into more than one category. A total of 947 discrete responses were coded.
A detailed breakdown of responses by each category are given in the table overleaf. For each category the table gives actual examples of pupils’ responses to illustrate the basis of the categorisation. The percentage figures indicate the proportion of the 947 responses in each category.
The most frequent responses were categorised as general learning, accounting for 20% of the responses. This included any response related to learning other than to specific subjects which were included in a separate category (see Table 14 for specific examples). The next most frequent set of reasons related to social activity and meeting friends (15%), followed by learning particular National Curriculum subjects (13%), specific help with mainstream school (10%), learning home language/culture (10%), their teachers (10%), using computers and ICT (6%), the general qualities of the school (6%), specific activities and sports (5%) and the benefits of small classes (2%).
Table 14 gives examples of the typical responses within each of these categories.
TABLE 14: What I most like about supplementary school.
Category N % Typical examples
General learning 190 20.1% • (subject not
specified)
•
Social life, fgriends
140 14.8% • My friends, the fun I have and the environment. Particular NC
subjects
126 13.3% • I like Saturday School because of the Maths and English. Help with
Mainstream school
97 10.2% •
Home language / culture
93 9.8% •
Teacher/s 91 9.6% • I like the fact that the teachers encourage you to ask them questions and are open to discuss anything with you that you find difficult. They also correct you without embarrassing you.
Computers/ICT 58 6.1% • Being taught computers, doing ICT, using the internet, making a web page, using the laptops
School organisation
56 5.9% • I like all the facilities for pupils, which include the use of the library, qualified teachers, the computer room, internet facilities and so on.
Specific activities
35 3.7% • I like to make things on the day.
Sports 16 1.7% • Football, basketball, running, PE etc.
Small classes 16 1.7% • There is a lot of time for the teacher to teach me and I am happy.
Everything 12 1.3% • I like everything, its cool, every single thing we do.
Nothing 3 0.3% • I don’t know, I don’t like it.
Tell us about anything you do not like about supplementary school?
A similar analysis was completed for the open-ended question asking “Tell us anything you do not like about supplementary school”. Responses were coded into 12 categories. Again, because pupils frequently gave more than one aspect they did not like, each pupil’s responses could be coded into more than one category. A total of 667 responses were coded.
A detailed breakdown of responses by each code are given in the table overleaf. For each category actual responses are given as examples to illustrate the basis of the categorisation.
The most frequent response was that there was nothing the pupils disliked, accounting for 29% of the responses to the question! Where pupils did report there was something they disliked this most often related to the organisation and/or the curriculum of the schools, such as the timing of activities and types of activities. Table 15 gives typical examples of pupils’ comments. Specific subjects were also mentioned quite frequently, as were the school social environment, the lack of difficulty in the work provided, poor resources and poor physical environment and aspects of the teaching. Similar issues would be raised by pupils about mainstream schools so these comments should not be taken as specific to supplementary schools. Most of the responses were constructive and much can be gained by supplementary schools in listening and acting on such pupil feedback.
TABLE 15: Tell us about anything you do not like about supplementary school?
Category N % Typical responses
Nothing 193 28.9% • It all OK. There’s nothing I don’t like Organisation /
curriculum
112 16.8% • The breaks are too short.
• “I don't like it because there are too many boys and only me and another girl”. “I don’t like it because it’s all girls”. • We don’t get enough time for lunch
• I don’t like spelling tests
• I think the teachers should teach in a different way. For example instead of reading books and answering questions we should do group activities which include speaking out loud. This would give us more confidence and this would improve our speaking skills.
• I think if we had more time it would be better for us kids, we would learn more without rushing, we would be grateful if the Saturday School finished at 2pm.
Time it happens 54 8.1% • Because its on Saturday, it starts too early, it’s a long journey to get there, I have to wake up too early, it’s too long.
Subject/s 52 7.8% • I don't like English because the work we do is easy when we have to do a lot of reading.
• I hate PE because it is my worst subject.
• I don't like Wednesday School because there is too much Maths.
• I don't like the English classes because they are boring and I don't learn as much as I do in maths.
• I hate Science. I hate Mandarin.
• The thing I do not like about our Saturday school is the Islamic lesson. It is not the teacher, but the things we do in the lesson. Every week we get a piece of paper, read it and do the
questions. I find this very boring to do every week. School social 50 7.5% • Sometimes children that come, mess around and stop the
lesson.
environment • I dislike whenever I have made a mistake others look at each others faces and laugh, that makes me dislike this school. • I don't like it when people make noise and you can't
concentrate.
• When kids are rude to me.
• I don't like it when we are held back by people disturbing and interrupting the teacher, we don't learn as much as we are supposed to and I know most of the stuff they teach.
• People whispering. When people laugh at me when I get an answer wrong.
• The thing I don't like is that I don't really know anyone in my class, so it's hard to talk to people when I need to use
something.
Continued overleaf
TABLE 15: Tell us about anything you do not like about supplementary school? (cont.)
Category N % Typical responses
General work 50 7.5% • I sometimes do not like what I do in lessons because it is boring.
• I do not like sitting and doing work all the time, though it's part of life.
• Personally I think my work is too easy for me, so I would like harder work.
• Sometimes I feel bored.
• Sometimes the work pace is too slow.
• I don't like Saturday school because it is boring and no games on the computers.
General work (cont.).
• Sometimes I don't like Saturday school because the stuff we are learning is too easy and I know it already.
Resources 42 6.3% • We don’t have the internet. • There is only one teacher.
• We don’t get individual attention. School physical
environment
35 5.2% • I don't like the small room, small board, stuffed in a hot room with no windows.
• I do not like the small classrooms. The toilets sometimes don't work. The furniture is very old.
• The thing I don't like is that the toilets are very smelly.
• I don't like it where we go to learn because the place is so dull and boring. It basically needs to be really bright. It would be really fun if we could change it.
• A lot of people come to Saturday School, minimum ten in a class but some rooms are too small for ten people. Everyone gets cramped.
• I don't like the fact that the rooms are small and not enough practical work is done e.g. Science.
The teacher/s 26 3.9% • Certain lessons because some teachers do not explain things clearly.
• Sometimes teachers are late.
• I do not like Saturday School because sometimes the teachers are a bit too impatient and don't want to spend time with me when I don't understand.
• The teacher always comes late and most of the children are already there.
• Maths teacher and his boring, easy work and he is not interesting like the English teacher.
• I do not like the Islamic Studies teacher and the way the teacher just reads the sheet and tells us to answer questions week after week. I think we need a better strategy of learning or another teacher.
Continued overleaf
TABLE 15: Tell us about anything you do not like about supplementary school? (cont.)
Category N % Typical responses
Loss of friends / social life or activities
21 3.1% • The thing I most dislike about Saturday school is I miss enjoying the weekends with my friends.
• I don't like Saturday because I want to have extra sleep on that day and miss out on the TV programmes.
• Because when I go back home most of my best programme is finished and I miss it every week and I miss out my Saturday football game with my league.
Bullying 11 1.6% • People who pick on others and argue a lot with you.
• I don't like going to the playground because other children call me names.
• There are some bullies in Saturday School. • I don't like it when the boys push me about.
Getting into 10 1.5% • I don't like when the teacher tells me off when I do bad things. trouble • I don't like it when the teacher tells us off and when we are
blamed for things we haven't done. • I don't like getting into trouble.
CONCLUSIONS
This is the first UK study to have sampled so widely the views and attitudes of pupils attending supplementary schools. 772 pupils from 63 schools in Birmingham, Bristol, Manchester and London completed the questionnaires. Pupils were very positive in their attitudes to supplementary schools; they were happy, interested in their lessons, got on well with their teachers and reported that supplementary school helped them with their mainstream school work. Overall, their attitude to supplementary school was more positive than their attitude to mainstream school. Results indicated supplementary schools continued to motivate and engage older pupils who may become disaffected with mainstream school, and this is a significant strength of supplementary schools.
Pupils engaged in a wide range of learning activities at their supplementary schools, but particularly valued gaining a deeper understanding of their home language or culture, specific help with learning English and mathematics, help with mainstream school work, social activities, computer and ICT and the positive support of their supplementary school teachers. There is substantial overlap in the work of mainstream and supplementary schools and there is much to gain for the pupils in closer liaison between the two sets of organisations.
Supplementary schools serve inner city communities and pupils who on average experience high levels of material and social disadvantage. The current research provides further empirical data to demonstrate this in relation to the number of books in the home. It is consistent with other government policies such as Sure Start and the New Deal for
Communities to target resources specifically to support the education of these pupils. Out of School Hours Learning, such as education in supplementary schools, has been a significant focus within education in recent years. The current research provides some evidence that pupils who had been attending supplementary school for more than a year had more positive attitudes to mathematics than their peers who had been attending for less than a year. Further research is necessary to confirm these findings. We strongly hope that the DfES will continue to provide funding for the Supplementary School Support Service, and the communities, schools and pupils they support.
RECOMMENDATIONS
Supplementary schools should consider using the questionnaire in their own self-evaluation. The large amount of data collected in this study can operate as a comparative base for schools to evaluate the attitudes of their own pupils against a wider sample. They should supplement this questionnaire with any other questions they feel are particularly important for their own contexts (See Appendix 2 for some of the additional questions suggested by supplementary school tutors).
This study has produced a large store of baseline questionnaire data that could be used to track the future progress of the sample. The logistics of tracking these pupils may be problematic given the high level of spelling errors in the pupil name data, especially where pupils may have left the supplementary school they were attending in June 2001. However there may be value in attempting to approach these pupils again at the start of summer term 2002 to repeat the questionnaire and gauge any changes in the intervening 12 months.
Having a single questionnaire for use across the entire age range from KS1 to KS4 can be problematic. Future projects should focus on a particular key stage/s. It may be valuable to have both a primary and a secondary project.
Further in-depth study should be completed with the 15 schools receiving the partnership grants. These schools receive a large financial grant relative to those receiving the small grants and youth grants. Focusing on a smaller number of pupils will allow more detailed information to be collated on the experience of each pupil. The mainstream schools these pupils attended should also be involved in the project, and sufficient inducements to enlist their support will be needed.
There may be advantages to working in partnership with Local Education Authorities (LEAs) in areas with large concentrations of supplementary schools. Some LEAs have extensive pupil databases which might facilitate collection of data on pupils’ attainment in mainstream school.
REFERENCES
Abdelrazak, M. (1999). Towards more effective supplementary and mother-tongue schools. Resource Unit for Supplementary and Mother-Tongue schools.
Bastiani, J. (2000). Supplementary schooling in the Lambeth Education Action Zone. London: Lambeth Education Action Zone.
Congos, D. H., & Schoeps, N. (1993). Does supplementary instruction really work and what is it anyway? Studies in Higher Education, 18, (2), 165-176.
Gregory, E. (1993). Sweet and sour: Learning to read in a British ands Chinese school. English in Education, 27, (3), 53-59.
Harnish, D. L. (1994). Supplemental education in Japan: Juku schooling and its implications. Journal of Curriculum Studies, 26, (3), 323-344.
Keys, W., Harris, S., & Fernandes, C. (1995). Attitudes to school of top primary and first-year secondary pupils. Slough: NFER.
Mason, K., Bhabra, S., & Rees, F. (2000). Study Support Summer Schools Pilots 1999: an evaluation of 25 schemes. DfEE Research Report RR220. London: DfEE
Publications.
Mathieson, E. (1995). A Saturday school for primary school children held at a public school. Research in Education, 54, 66-84..
Milar, V (1997). Report backs study centres. Times Educational Supplement, 5th September 1997..
Reay, D., & Mirza, H. S. (1997). uncovering genealogies of the margins: black
supplementary schooling. British Journal of the Sociology of Education, 18, (4), 477-499.
Richards, G. G. (1995). Supplementary Schools - their service to education. Multicultural Teaching, 14, (1), 36-40.
Rutter, J. (1998). Refugee supplementary schools. Language Issues, 10, (1), 7-11.
Sewell, T. (1996). United front to preserve cultural practices. Times Educational Supplement, 25th October 1996.
Sharp, C., Osgood, J., Flanagan, N. (1999). The benefits of study support: A review of opinion and research. Slough: NFER.
Yip, S. (1997). Getting results: Study support in Tower Hamlets. London: London Borough of Tower Hamlets.
APPENDICES
APPENDIX 1: The pupil questionnaire and notes of guidance on administration.
APPENDIX 2: Analysis of the tutor feedback forms.
APPENDIX 1:
The pupil questionnaire and notes of guidance on
administration.
NOTES OF GUIDANCE ON COMPLETING THE
SUPLEMENTARY SCHOOL PUPIL QUESTIONNAIRE
Contents of the pack
You should receive with these notes the following:
• Fifteen copies of the pupil questionnaire, one for each of the 10 nominated pupils in your supplementary school, and five spare copies;
• A tutor feedback form to record your comments on the questionnaire; • A pre-paid A4 envelope to return the completed questionnaires.
The purpose of the questionnaire
One aim of the Supplementary School Support Service is to demonstrate how supplementary schools contribute to raising pupil achievement. A national research project has been set up to track targeted pupils who participate in supplementary school activities. Each supplementary school has nominated ten children aged 7 to 11 years for participation in the project. The purpose of this questionnaire is to gain an indication of these pupils’ attitudes to school, their attitudes to reading and mathematics, their perceptions of their own ability and their broader attitude to learning. We will not identify individual pupils or individual Saturday schools in any reports. The intention is to gain a picture across all pupils and schools.
Administering the questionnaire
The questionnaire must be administered to the 10 nominated pupils in your supplementary school. It may be best to administer the questionnaire to all ten pupils as a group at one sitting. This is so you can explain the reasons for the questionnaire, ensure pupils understand how it should be completed and answer any questions from the pupils on how to complete it. This is especially important for the younger pupils who may need more help in
understanding how to fill out the questionnaire. It should take no more than 15 minutes to complete the questionnaire.
Filling in the pupil details
Please ensure the pupils fill out their details first. The details asked for are: • First name
• Family name • Date of birth • Sex (Boy or Girl)
• Today’s date (the date the questionnaire is being completed) • The name of your Saturday School.
To make it easier for the younger pupils, you may find it helps to write today’s date and the name of the Saturday school on a board at the front of the class so pupils can copy these down.
Explaining the task to the group: the example questions
Please demonstrate completing the two example questions on the front sheet with all the pupils. This is important, especially with the younger pupils, so that they understand what they are being asked to do. You may find the following directions helpful in explaining the task to the pupils. Ensure that all pupils are looking at the first page of their question booklets.
In this booklet there are some questions to find out what you think. You should answer the questions truthfully saying what you think. We want you to read each question and then tick or mark the box that best describes how you feel about the question.
Look at the two example questions at the bottom of the front page. The first question is “I like football”. I like football very much, so I would tick the ‘Strongly Agree’ box. Now look at the second question. This is “I like tidying my bedroom “. I do not like tidying my bedroom very
much, it ‘s not much fun, so I would tick the ‘Disagree’ box.
Now I would like you to complete the rest of the questions. Remember this is not a test. There are no right or wrong answers. You should tick the box that best describes how you feel about the question.
Young children, children not familiar with English or children with reading difficulties
Throughout the questionnaire we have attempted to keep the language as simple and direct as possible. However some children, particular those who are very young or have English as an additional language, may have difficulty in reading the questions. Where the reading
demands of the questionnaire are likely to pose significant problems for the pupils, it would be helpful to read the questions aloud to the child. If there are several children for whom this is likely to be the case, then you may want to administer the questionnaire to them as a separate group, reading out all the questions aloud.
Questions 11 to 15 of Section 4 are not in the “strongly agree strongly disagree” question format. Young children in particular may need extra help in answering these questions. Please pay particular attention to whether pupils understand these questions, and if necessary read these questions to pupils.
You may feel it is not appropriate or possible for a particular child to complete the
questionnaire. If so, then please return the questionnaire with a covering note explaining why it was not appropriate or possible for the pupil to complete the questionnaire. This will help us in identifying issues to address in the next questionnaire to be completed at the end of summer term 2001.
Completing the questionnaire with additional pupils
You only need to complete the questionnaire with your 10 nominated pupils. However some supplementary schools may wish all their pupils, not just the nominated pupils, to complete the questionnaire. This is because it may be easier in terms of organising the activity, or because it would be informative to have feedback on pupils’ attitudes to school, to reading and to mathematics for the whole group. Therefore the pack also includes some spare copies of the questionnaire. You can photocopy additional copies to use the questionnaire with all your pupils if you wish to do so.
Returning the questionnaire
Please collect all the questionnaires at the end of the session and keep them in a safe place. If any pupils were absent then please wait until the following week and administer the
questionnaire then. When you have collected all the completed questionnaires for your nominated pupils, then please:
• Check the pupil details section is completed accurately for each pupil; • Place all the questionnaires in the pre-paid A4 envelope provided;
• Also include the tutor feedback form if you have any comments on the questionnaire; • Return the pre-paid envelope to us.
If you wish to return questionnaires for other pupils in addition to your nominated pupils then please feel free to include these in the envelope as well. The address on the pre-paid envelope will be:
Supplementary Schools Project NFER-NELSON
Darville House 2 Oxford Road East
Windsor, Berkshire SL4 1DF
Questions
If you have any queries about the questionnaire or the research project then please contact your Supplementary School Support Service Regional Co-ordinator. S/he will be happy to help you with any queries.
APPENDIX 2:
ANALYSIS OF TUTOR FEEDBACK ON THE QUESTIONNAIRE
A feedback form for supplementary school Tutors was devised to gather feedback from tutors on the content and administration of the questionnaire. Tutor feedback forms were returned by 39 (60%) of the schools. Given below is an analysis of the responses to each of the six questions asked.
1. Did pupils complete the questionnaire in a single group, in separate age groups
or individually?
The intention of the question was to ascertain the manageability of administering the questionnaire with groups of pupils. The majority of respondents indicated that the questionnaire was completed individually (26). A smaller number completed the
questionnaire in separate age groups (9) or with all pupils as a single group (3). However some responses indicated there may have been a degree of ambiguity present in the question, e.g., responses such “the pupils completed the questionnaire individually in separate groups”. Some schools seemed to interpret the question as asking whether the pupils completed the questionnaire as a collaborative group exercise or individually, rather than as asking about the manageability of group administration of a questionnaire that must be individually
completed. From feedback gained at conferences we judge that it was feasible to administer the questionnaire to a group of pupils, although where the age range of the group was very wide (e.g., 5-16) it was necessary to work with separate age groups.
2. Were there any difficulties in administering the questionnaire? If yes, how did
you overcome these difficulties?
The majority of schools reported there were no problems in administering the questionnaire.
The most frequently mentioned problem (4 schools) was where English was not the pupil’s first language. Ways of overcoming these difficulties included:
• a home visit and also telephone calls to carer/parent; • Translating the questionnaire to home language;
• Clarification of what items were asking through individual and class discussion;
• Reading through the questions and giving examples; • Allowing the kids to take the questionnaires home.
Two schools mentioned difficulties related to the age of the pupils, with one school
considering their children too young, and another considering their children too old, for the questionnaire style. This reflects the difficulty in assessing attitudes across such a wide age range. Two schools reported problems with a lack of resources, a lack of a spare classroom to administer the questionnaire in one case, and a lack of time or staff cover in the other. Other issues included getting consent forms back from parents (one school) and a lack of
experience about filling in surveys (1 school). One school reported that children were not sure what to write on the back page (the free response questions) but after it was explained they could do it.
3. How long did it take, on average, for a pupil to complete the questionnaire?
Answers to this question were coded and the outcomes are given in the table below.
Estimated time Number of responses
% of valid responses
Cumulative percentage
Less than 5 minutes 2 5.3% 5.3%
5 – 10 minutes 13 34.2% 39.5%
11 – 15 minutes 9 23.7% 63.2%
16 – 20 minutes 7 18.4% 81.6%
21 – 25 minutes 2 5.3% 86.8%
More than 25 minutes 5 13.2% 100.0%
TOTAL(1) 38
(1). One response referred to the number of weeks taken to get all the questionnaires completed by all pupils and was therefore excluded.
The most frequent response (34%) was that it took only between 5 to 10 minutes for a pupil to complete the questionnaire. In almost two-thirds of schools (63%) the average pupil completed the questionnaires in 15 minutes or less. In all but 5 schools (i.e. in 87% of