University of Warwick institutional repository: http://go.warwick.ac.uk/wrap
This paper is made available online in accordance with
publisher policies. Please scroll down to view the document
itself. Please refer to the repository record for this item and our
policy information available from the repository home page for
further information.
To see the final version of this paper please visit the publisher’s website.
Access to the published version may require a subscription.
Author(s): Wendy L Wrieden, Annie S Anderson, Pat J Longbottom,
Karen Valentine, Martine Stead, Martin Caraher, Tim Lang, Bill Gray
and Elizabeth Dowler
Article Title:
The impact of a community-based food skills intervention on cooking confidence food preparation methods and dietary choices – an exploratory trialYear of publication: 2007
Link to published version: http://dx.doi.org/
10.1017/S1368980007246658The impact of a community-based food skills intervention
on cooking confidence, food preparation methods
and dietary choices – an exploratory trial
Wendy L Wrieden
1,*, Annie S Anderson
1, Pat J Longbottom
1, Karen Valentine
1,
Martine Stead
2, Martin Caraher
3, Tim Lang
3, Bill Gray
4and Elizabeth Dowler
51Centre for Public Health Nutrition Research, University of Dundee, Ninewells Hospital and Medical School,
Dundee DD1 9SY, UK:2Institute for Social Marketing, University of Stirling and Open University,
University of Stirling, Stirling FK9 4LA, UK:3Institute for Health Sciences, City University, London, UK:4The Scottish Community Diet Project, c/o Scottish Consumer Council, Royal Exchange House, 100 Queen Street, Glasgow G1 3DN, UK:5Department of Sociology, University of Warwick, Coventry CV4 7AL, UK
Submitted 13 September 2005: Accepted 24 August 2006
Abstract
Objective:To evaluate the feasibility of undertaking a food skills intervention study in areas of social deprivation aimed at altering cooking confidence, food preparation methods and dietary choices.
Design: A standardised skills programme was implemented in community-based settings. Pre- (T1) and post-intervention (T2) and 6-month follow-up (T3) measures (7-day diaries and self-administered questionnaires) were undertaken in intervention and comparison groups.
Setting:Eight urban communities in Scotland.
Subjects:One hundred and thirteen adults living in areas of social deprivation.
Results:It was clear that many subjects led fragmented lives and found commitment to intervention classes problematic. Sixty-three subjects completed the final (T3) assessments. The response to each component varied due to inability to attend sessions, illness, study requirements, employment, moving out of the area, change in circumstances, loss of interest and loss of postal questionnaires. At baseline, reported consumption of fruit and vegetables was low (mean frequency 8.1^4.78 times per week). Fruit intake increased significantly (P,0.05) between T1 and T2 in the intervention group (1.7^2.36 to 2.7^3.28 times per week) only. Between T1 and
T3, there was a significant increase (P,0.05) in intervention subjects who reported confidence in following a recipe (67 – 90%,).
Conclusions: This exploratory trial shows that a food skills intervention is likely to have a small but positive effect on food choice and confidence in food preparation. A full-scale randomised controlled trial in this hard-to-reach group would require a range of flexible approaches rather than a fully defined intervention, and presents challenges for trial design.
Keywords Foodskills Deprivation Intervention
A diet rich in starchy carbohydrates, fruits and vegetables and low in fats (especially saturated fats) is likely to delay the development and progression of the major causes of morbidity and mortality (namely coronary heart disease, strokes and cancer, obesity, non-insulin-dependent diabetes and dental decay)1 – 3. However, attaining an optimal diet in the entire population presents a major public health challenge, and particularly so in low-income households4 – 8.
The debates over ways to address food poverty are split between a structuralist approach9 (focusing on access, affordability and availability) and an individual targeted approach10 – 12 (focusing on awareness and acceptability). However, food choices are clearly a
function of both wider structural issues mediated by personal tastes and cultural beliefs, but also influenced by public and private sector policies, responding to financial pressure and market forces.
For many socially disadvantaged families, practical issues restrict the attainment of a healthy varied diet. Such issues include low disposable income, limited access to good-quality food at affordable prices, and minimal cooking facilities and skills. A number of studies7suggest that, in addition to personal social disadvantage, poor neighbourhoods provide fewer opportunities for health-promoting activities than more affluent communities. In low-income households, domestic food preparation is thought to play a key part in balancing household budgets7.
Dowleret al.13have demonstrated that lone-parents who ‘regularly cooked from fresh or raw ingredients . . .
achieved healthier dietary variety for themselves and their children’. However, it is also recognised that greater confidence in cooking techniques is more likely in people from higher social class backgrounds14.
There are few data on the relationship between food skills, practical interventions and dietary intake. Stookey
et al.15 showed that cooking skills were positively associated with vitamin C, fruit and vegetable intake, and negatively associated with convenience food con-sumption. Evaluation reports of food skills groups from Glasgow, Grampian and Leicester have reported changes in eating habits and increased vegetable and fruit consumption amongst adult participants16 – 18. However the impact of interventions to improve food preparation skills on dietary and cooking confidence has not been studied in detail. In many areas of social disadvantage, local food skills projects such as ‘Get Cooking!’19,20 and national campaigns as run by the Royal Society for the encouragement of Arts21,22 have developed to address barriers to progressing dietary change. These vary in success, but community ownership (where local people are regarded as equal partners) has been described as a key feature and an important factor in the design of projects targeted at disadvantaged communities7.
It is recognised that dealing with any one barrier to dietary change is unlikely radically to alter eating behaviour that will have developed over a lifetime, but pilot studies suggest that food skills interventions may be a useful starting point for initiating dietary change. In addition, these interventions may contribute to improve-ments in individual factors (e.g. self-esteem) and neighbourhood factors (e.g increased community cohe-sion and capacity to develop and tackle the food supply in an area20,23,24) which influence food choices.
A large number of recent funded community diet projects in Scotland have sought to improve confidence and skill in cooking and shopping25,26. However, the overall impact of such interventions on food preparation habits and dietary intake has not been systematically assessed to present an evidence base for cost-effective and efficient work in this arena.
The aim of the current study was to evaluate the feasibility of undertaking a food skills intervention (CookWell) study aimed at altering cooking confidence, food preparation methods and dietary choices in areas of social deprivation.
Methods
Overview
A standardised 2 h food skills intervention programme delivered over 7 weeks was designed and implemented in eight community-based settings in Scotland, UK. Quanti-tative evaluations using food diaries, shopping diaries and
questionnaires were carried out in intervention and comparison groups at baseline (T1), immediately after completion of the intervention 2 months later (T2) and at 6 months follow-up (T3). Qualitative interviews were also carried out at T3 in a sample of intervention group participants. Reported measures of dietary intake, food preparation and cooking confidence (at all time points) in both groups are presented herein.
Recruitment of subjects
The intention to run a food skills programme was announced through the Scottish Community Diet Project newsletter and website, and interested community group leaders were invited to contact the CookWell study team. The following inclusion criteria for participating classes were discussed:
. Recruitment of,20 subjects considered likely
. Availability of kitchen/food preparation facilities for 10 people
. Ability to timetable a 2 – 3 h group for 10 weeks from October 2000 to June 2001
. The community was based in an urban area of social deprivation.
Visits were then made to the various sites to assess the premises and to discuss arrangements for equipment, cre`che, tutor and recruitment. It was explained that it was necessary to recruit a group of people within the area who were all interested in improving their food skills but that half the group would be asked to delay their participation in the practical course for 8 months in order to form a comparison group. Thirteen community projects expressed initial interest and eight participated in the project. Six of these communities were based in areas that are ranked in the most deprived 20% in Scotland and two were within the most deprived 40% of the population when scored by the Scottish Index of Multiple Deprivation27. The settings within the
communities included child and family projects, community education centres, community cafe´s and community schools. In nearly all cases, a local community worker recruited people to assist in organisation.
Development of the CookWell programme
The aim of the intervention was to increase cooking confidence and food preparation methods, and promote increases in consumption of fibre-rich starchy carbo-hydrates, fish, vegetables and fruit, and decreases in consumption of fat in adults living in areas of deprivation. The development of the programme was informed by results from focus groups with prospective participants in two of the communities (reported elsewhere28). Respon-dents requested that soups and budget cookery were included in the classes, but practical aspects of fish and vegetable preparation were less desirable. Using this information, a CookWell manual was designed to enable
facilitators to follow a standardised, but flexible, pro-gramme in each community. Attention was given to the use of basic meal items (e.g. rice, pasta and potatoes) with simple ways to achieve dietary balance.
Implementation of the CookWell programme
The design of the CookWell intervention took account of the characteristics of effective dietary intervention programmes identified by literature reviews29 including personal contact with educators, social support, goal setting, group work and activities involving food, which have been identified as ‘promising approaches’ to supporting dietary behaviour change. A protocol for the organisation and delivery of CookWell was developed and included in the facilitator’s pack. The programme was designed to take place over 10 weekly, 2 h sessions and involved both practical and educational elements (Table 1). In weeks 1 and 10, participants assembled for data collection. In week 2, everyone returned baseline food diaries and took part in an informal educational session and covered topics such as food hygiene, nutrition and food tasting, using interactive question and answer sessions. All participants (comparison and intervention) were provided with this education programme at the start of the intervention. This session did not involve any food skills work. Thus, the food skills intervention was delivered on weeks 3 – 9 inclusive. The intention was that the practical sessions were run by a local instructor, but this was only possible in four locations so a CookWell project member ran the other groups. Practical sessions for the comparison groups were run after the final dietary assessment (T3) for the main project.
Evaluation of the CookWell programme
All assessment tools were drafted and piloted in a community group not involved in the main study. The methods outlined here follow those described by Dowler et al.13 in their study of lone parent families. Assessments were carried out by an independent researcher (P.J.L.) not involved in the practical sessions. At each measurement time (T1, T2 and T3), all subjects were asked to complete the following.
1. A general interview questionnaire comprising closed questions on: family sociodemographic characteristics; family mealtimes; frequency of eating out and buying ‘takeaways’; and cooking information, e.g. what kind of meals are prepared.
2. A cooking skills questionnaire comprising multiple choice questions to assess changes over time with reference to: family meals; confidence in cooking certain foods and techniques and following a recipe; kitchen equipment; factors influencing food choice and shopping behaviour; addition of salt; and frequency of eating fish, fruit and vegetables. This questionnaire was based on that used in previous work14,30.
3. Food diaries were used to record estimated dietary intake for 7 days for all members of the family but completed by the participant.
[image:4.612.58.549.482.714.2]4. A food-frequency questionnaire (FFQ) was used as a cross-check for the 7-day food diaries and was completed when the food diaries were collected. The frequency of eating a total of 71 foods was recorded, 27 of those specifically concerning fruit and vegetables. The questionnaire was developed and refined from instruments used in national surveys such as the
Table 1 CookWell programme – action and activities
Week no. Assessments Intervention group Comparison group
1 Baseline measurements for both groups
Recruitment – allocation to intervention or comparison group
Recruitment – allocation to intervention or comparison group
2 Return of 7-day food and shopping diaries and completion of FFQs for both groups
Educational introductory session covering food hygiene, nutrition and food tasting
Educational introductory session covering food hygiene, nutrition and food tasting
3 Cheese sauce and pasta bake No contact
4 Soups and scones No contact
5 Mince-based dishes No contact
6 Rice-based dishes No contact
7 Pizza and salad No contact
8 Chicken curry/stew and potato wedges No contact
9 Participants sent T2 food skills questionnaire and food and shopping diaries
Carrot cake and healthy puddings No contact
10 Collect T2 assessments End of session ‘celebration’ with snacks, presentation of CookWell certificates and cookery packs
End of session ‘celebration’ with snacks, presentation of cookery packs
Scottish Health Survey and the National Diet and Nutrition Surveys31 – 33.
A pack of cooking utensils (including a saucepan, cheese grater and knives) was provided for each participant as an incentive for completing the T2 assessments. By providing this pack for both intervention and comparison groups, lack of equipment could be eliminated as a reason for not cooking. To aid the return of the T3 assessments, a £10 voucher was provided for the written assessments.
Analysis
Analysis of questionnaire and diary data was carried out to assess changes between T1, T2 and T3 for the following factors.
1. Frequency of consumption of key foods (fruit, vegetables and salads, fruit and vegetables, total fish, tuna, total bread, pasta and rice) and changes. This was standardised by comparing information from diaries completed for 7 days at both time points of comparison.
2. Frequency of key food preparation and cooking methods as indicated by answers to questions on the kind of cooking carried out (cooking from basic ingredients, cooking convenience foods), salt added during cooking, as well as frequency of consumption of fried/roast potatoes and boiled/baked potatoes from food diaries, and changes.
3. Confidence in cooking selected items, following a recipe and using basic ingredients was reported and changes in frequency of those expressing confidence from T1, T2 and T3. Confidence was rated on a 4-point scale from ‘Very confident’ to ‘Not at all confident’ with an additional category of ‘Don’t know’. For analysis, categories were merged such that very confident and quite confident became ‘confident’, while not very confident, not confident at all and don’t know became ‘not confident or don’t know’.
The magnitude of changes between these time points (T2 – T1 and T3 – T1) was compared between intervention and comparison groups using the Studentt-test. Although intakes of particular foods such as fruit and vegetables are not normally distributed, the actual changes in consump-tion were, and so were analysed using a parametric method. Changes in frequency categories (e.g. use of salt) over T1, T2 and T3 were analysed using the x2 test in intervention and comparison groups. Only subjects who had completed measurements at both comparative points were included in this statistical analysis of differences.
Results
Recruitment and retention
A local community worker carried out recruitment in each of eight communities. The number initially recruited at
each site varied, but in each community a minimum of 11 participants were recruited and a minimum of five completed the general interview questionnaire. The nature of the intervention meant that it was not possible to randomise subjects to intervention or comparison group. To ask people to come forward if they were interested in improving their cooking skills (and this was a requirement because a similar motivation was required for both groups) and then split them into intervention group and comparison (delayed intervention) groups without any consideration to their needs, e.g. to be supported by a friend or their choice of timing, would have had a deleterious effect on community relations. Even with taking personal circumstances into consideration, some participants who initially expressed an interest in the classes were unable to turn this interest into a commitment to attend and/or complete the assessments.
At each time point, the number of participants completing each instrument varied. Of the 113 originally recruited who completed the general interview question-naire, 20 were considered to be ‘withdrawals’ having, in general, completed only the initial interview and food and cooking skills questionnaires. The remaining 93 comprised 51 intervention and 42 comparison participants.
At T3 a total of 63 (36 intervention and 27 comparisons) completed the interview questionnaire but some did not do the other assessments. The final numbers for comparison of changes in food frequencies calculated from the food diaries was thus reduced to 29 intervention and 21 comparisons for the T1 – T2 comparison, and 24 intervention and 17 comparisons for the T1 – T3 compari-son. The response to each component varied at each measurement time despite efforts by both researchers and community workers to ensure maximum response. The reasons for this were multiple and included inability to attend assessment sessions, illness, the onerous nature of the study, employment, moving out of the area, change in circumstances, loss of interest after the second measure-ment time when cooking sessions were completed and loss of questionnaires returned by post.
The number of female participants at T1 far out-numbered the males, being 100 (88%) to 13 (12%). The mean age of all groups was similar, with an overall mean age of 32.3 years (standard deviation (SD), 10.2) years and an age range of 16 – 65 years at T1. Just under half had incomes of,£150 per week, only 4% of participants were employed full-time and 14% were in part-time employ-ment; 47% of the intervention and 45% of the comparison group were on income support. It was also apparent from qualitative interviews that many led fairly fragmented lives with a high dependence on benefits. The majority (77%) of participants finished their full-time education at 16 years or below, the intervention group having the highest percentage (84%) in this category. Thirty-two per cent of participants had no formal qualifications. Half of all participants smoked (47%).
Overall fruit and vegetable consumption (including fruit juice and salads and calculated from all subjects returning the T1 diariesn¼83) amounted to 8.1^4.8 (SD) times
per week. (Although participants were asked to estimate quantities eaten, this was not done in sufficient detail to measure the number of portions eaten. It was thus only possible to record the number of times that the items were recorded in the diaries.) Subsequently, only complete 7-day diaries were used in the calculations, and the differing numbers of subjects completing both T1 and T2 diaries and both T1 and T3 diaries resulted in slight differences in the overall frequencies reported at T1. Full results are given in Tables 2 and 3 .
At T1, the reported frequency of fruit (including fruit juice) consumption was 2 – 3 times, whilst vegetable and salad consumption was six times a week in the intervention group and seven in the comparison group. Fish was consumed a mean of once a week, with tuna constituting approximately one-third to a half of this. Starchy foods were consumed an average of 17 times a week, with bread constituting 10, and pasta and rice two, of these occasions. At T2, a mean change equivalent to one portion a week was seen in the intervention group for fruit (P¼0.047), but no other significant changes were seen. This change was not sustained and there was no significant difference between the intervention and comparison groups (T1 – T3). The numbers and percentage reporting positive responses to items on food preparation methods are presented in Table 4. There were no significant differences in the proportions reporting that they assembled meals from ready-made ingredients (e.g. pasta and ready-made sauce), used convenience foods or added salt during cooking in either comparison or intervention participants across the three time points.
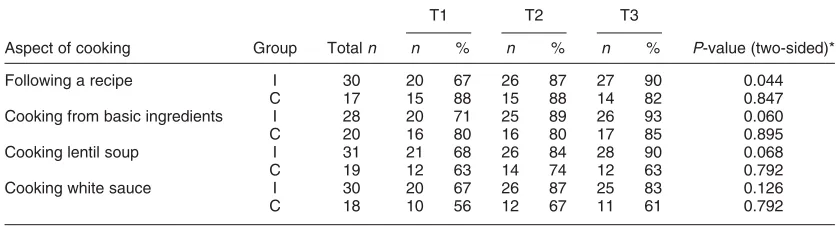
Table 5 presents the changes in confidence ratings for a range of cooking skills. There was a significant increase in the proportion of intervention participants reporting confidence in following a recipe over the 8 months of the project which was maintained at T3. A higher percentage also reported confidence in cooking from
basic ingredients, cooking lentil soup and making white sauce at T2 and T3.
Discussion
Recruitment and retention
It was originally intended that 10 participants per community (with a minimum of six participants finishing the programme) and a similar number of comparison participants would be recruited. However, in practice, it was not possible to recruit an initial 20 people. Recent work in Wales has confirmed findings that facilities in the community are not normally large enough to provide for 10 active participants, and six or less is a more manageable number for practical food skills courses in terms of both premises and tutoring20.
Evaluation of dietary changes
Power calculations carried out before the study showed that for fruit and vegetables, 50 subjects per group would be sufficient to show an increase of seven portions/times a week (95% power and a result significant at the 5% level). However, it is clear that the magnitude of the change in this population subgroup was overestimated, and insuffi-cient study numbers were available to present evidence on whether this type of intervention had a significant impact on dietary choices. This finding raises important issues about recruiting and retaining sufficient numbers of representative participants for community-based trials of healthy people for group-based interventions.
[image:6.612.60.545.582.713.2]Several measures were used to evaluate food and dietary intakes in this study to monitor any changes from baseline to T2 and T3. Participants were asked to keep food diaries for themselves and the family for 7 days. For simplicity, only the intakes recorded for the actual participants themselves are reported here. Given the sample size, it was surprising that a significant change was detected from the food diaries in fruit (excluding fruit juice) consumption in the intervention group from T1 to T2, and this change equated to an increase of one portion of fruit per week on a baseline
Table 2 Mean (standard deviation) weekly frequencies of consumption from completed 7-day diaries for intervention (I,n¼29) and comparison (C,n¼21) groups at T1 and T2, and mean change (T2 – T1)
Mean T1 Mean T2 Mean difference (T2 – T1)
Commodity I C I C I C P-value* (two-sided)
Fruit juice 0.1 (0.31) 0.5 (1.03) 0.3 (0.86) 0.8 (1.72) 0.2 (0.95) 0.3 (1.43) 0.79 Fruit (excluding fruit juice) 1.7 (2.36) 2.3 (2.90) 2.7 (3.28) 2.0 (2.94) 1.0 (2.26) – 0.2 (2.07) 0.05 Fruit and fruit juice 1.8 (2.34) 2.8 (3.42) 3.1 (3.65) 2.9 (4.05) 1.3 (2.55) 0.1 (2.51) 0.11 Vegetables and salads 6.0 (2.97) 7.0 (3.57) 6.4 (4.79) 6.6 (3.89) 0.4 (3.69) – 0.4 (4.96) 0.48 Fruit and vegetables 7.8 (4.26) 9.8 (5.64) 9.5 (7.11) 9.5 (5.11) 1.7 (4.71) – 0.3 (6.00) 0.18 Tuna 0.3 (0.85) 0.4 (0.68) 0.4 (0.73) 0.5 (0.87) 0.1 (1.07) 0.1 (1.00) 0.93 All fish 1.0 (0.98) 1.1 (1.00) 1.2 (1.36) 1.3 (1.06) 0.2 (1.21) 0.2 (1.17) 0.96 Total bread 10.2 (4.28) 10.1 (3.60) 9.3 (4.37) 10.7 (4.70) – 0.9 (4.53) 0.6 (4.73) 0.25 Pasta and rice 2.1 (1.41) 2.0 (1.67) 1.9 (1.75) 2.7 (1.93) – 0.2 (1.80) 0.7 (2.11) 0.12 All starchy foods 17.2 (5.59) 16.6 (5.90) 16.2 (6.35) 18.5 (5.85) – 1.0 (5.63) 1.9 (6.49) 0.10
level of approximately two portions per week (i.e. a 50% increase). Vegetable consumption (as recorded) suggested an increase of less than half a portion on a baseline of six portions per week, but this was not significantly different from the comparison group.
FFQs administered as a cross-check showed no significant differences between time points but confirmed the low fruit and vegetable consumption in this low-income group, with over three-quarters of subjects recording a less than daily (,50%) or no consumption of fresh fruit (approximately one-quarter). The quantities of fruit and vegetables eaten are considerably less than the recommended five portions per day34but are similar to those seen for women of manual social class in the Scottish Health Survey5where fewer than half claimed daily fruit consumption. Results from the MONICA study in north Glasgow in 1995 showed that only 12% of women in the most deprived quarter (as measured by postcode) consumed fruit and vegetables four times a week and that despite a general population increase in fruit and vegetable intake over the previous 10 years, there had been little change in the most disadvantaged group35.
The work described suggests that cooking skills classes make a small, measurable change in dietary habits, but this was not maintained when the encouragement to cook and eat these key foods was withdrawn, suggesting that the
duration of the intervention may have been inadequate. The health promotion literature describes a similar process of regression once a programme is withdrawn. In a review of a pan-European nutrition programme in low-income households, Kennedy36concluded that approaches which responded by teaching people skills to cope within their existing restricted circumstances are limited in their ability to change behaviour: they need to be located within a wider framework of multiagency working designed to develop capacity building and change local settings to ensure sustainability of impact to outcome measures.
Evaluation of changes in cooking methods and cooking confidence
[image:7.612.50.536.79.212.2]The quantitative increase in the percentage of participants reporting that they cooked from basic ingredients was confirmed by comments noted in the qualitative evalu-ations, in which respondents also spoke of increased enthusiasm and ‘adventurousness’ around food prep-aration and trying new foods37. Hence many, but not all, participants reported that they were doing more cooking from basic ingredients and eating fewer convenience foods. This did not mean that convenience foods were being avoided altogether so it was not surprising that the quantitative results showed no change in the percentage of subjects cooking convenience foods. It was
Table 3 Mean (standard deviation) weekly frequencies of consumption from completed 7-day diaries for intervention (I,n¼24) and com-parison (C,n¼17) groups at T1 and T3, and mean change (T3 – T1).
Mean T1 Mean T3 Mean difference (T3 – T1)
Commodity I C I C I C P-value* (two-sided)
Fruit juice 0.1 (0.28) 1.0 (1.78) 0.1 (0.28) 1.0 (1.68) 0.0 (0.29) – 0.2 (2.24) 0.75 Fruit (excluding fruit juice) 1.9 (2.75) 2.1 (2.71) 1.8 (2.58) 1.2 (1.52) – 0.1 (2.45) – 0.9 (2.29) 0.32 Fruit and fruit juice 2.0 (2.73) 3.0 (3.25) 1.8 (2.57) 2.0 (2.35) – 0.1 (2.42) – 1.1 (3.19) 0.29 Vegetables and salads 6.4 (3.31) 6.3 (3.70) 7.2 (4.57) 7.7 (5.67) 0.8 (3.12) 1.4 (2.85) 0.49 Fruit and vegetables 8.4 (4.95) 9.4 (5.41) 9.0 (5.46) 9.7 (6.95) 0.6 (4.06) 0.3 (4.61) 0.84 Tuna 0.4 (0.92) 0.4 (0.61) 0.3 (0.56) 0.8 (1.03) 0.0 (0.91) 0.4 (0.80) 0.10 All fish 1.2 (1.05) 0.9 (1.09) 1.3 (1.13) 1.0 (1.06) 0.2 (0.92) 0.1 (1.48) 0.78 Total bread 10.0 (4.76) 10.5 (3.64) 9.8 (4.49) 12.1 (3.51) – 0.2 (3.71) 1.5 (3.91) 0.16 Pasta and rice 2.2 (1.53) 1.9 (1.36) 1.7 (1.43) 2.4 (1.00) – 0.5 (1.91) 0.5 (2.13) 0.12 All starchy foods 17.0 (6.33) 16.8 (5.85) 17.1 (6.14) 18.9 (4.21) 0.0 (5.12) 2.1 (4.87) 0.20
*t-Test for equality of means.P-value is for the probability that the difference in means is due to chance.
Table 4 Changes in percentage of subjects reporting use of key food preparation and cooking methods
T1 T2 T3
Group Totaln n % n % n % P-value (two-sided)*
Cooking from basic ingredients I 31 21 68 23 74 28 90 0.091
C 15 15 75 17 85 15 75 0.675
Assembling ready-made ingredients I 31 17 55 18 58 19 61 0.876
C 20 14 70 15 75 12 60 0.583
Convenience foods I 31 20 65 21 68 21 68 0.953
C 20 13 65 12 60 16 80 0.367
Adding salt during cooking I 34 17 50 15 44 19 56 0.629
C 20 3 15 6 30 7 35 0.437
I – intervention; C – comparison.
Numbers reported are for those who answered the same question at every time point. *P-values are forx2analysis for differences in proportions of subjects at each time point.
[image:7.612.77.510.583.695.2]encouraging that the percentage of intervention subjects cooking from basic ingredients was higher 6 months after the intervention than at baseline or T2.
A high rating for confidence in cooking from basic ingredients was expressed by 90% of English women and 77% of English men surveyed in the 1993 Health and Lifestyle Survey14. The participants in the CookWell project represent a sample skewed towards the lower socio-economic section of society where confidence in using a range of techniques was generally low. The percentage of subjects expressing confidence in cooking following a recipe and cooking certain dishes increased amongst intervention subjects but not amongst compari-son subjects. Comments from the qualitative work about increased confidence in these areas confirmed this result. These results add to the existing evidence38that cooking skills classes increase cooking confidence. Although it is unclear whether increasing cooking confidence in itself would influence dietary intake, it is unlikely to be associated with a deterioration in healthy choices.
Lessons for public health research
The study highlights the practical difficulties of research on public health nutrition interventions in low-income communities. The extent of the evaluation methods was designed to maximise valuable research time on extensive data collection, but all methods are associated with considerable subject burden and likely to have contributed to low retention rates. Further work on the development of appropriate tools has enabled the development of a much shorter assessment questionnaire for evaluating commu-nity cooking skills interventions. This simplified two page instrument39includes key questions on fruit and vegetable consumption, frequency of using basic ingredients for preparation of meals, confidence in using a recipe, buying less convenience foods, increased likelihood of tasting and experimenting with new foods and increased awareness of food preparation and production. The tool has been designed to be administered by community health workers running cooking skills classes with the potential to be utilised in multicentre studies.
The present study also highlights the challenges and limitations of the ‘gold standard’ controlled trial design in the context of real world interventions40. In summary, it is likely that a randomised controlled trial design will be challenging to undertake in this hard-to-reach population and that alternative evidence may need to be sought to test the impact of intervention approaches. The challenging and sometimes chaotic nature of the CookWell participants’ lives meant that many struggled with the research process and many dropped out altogether; furthermore, as noted above, it was simply not possible or ethical to recruit a ‘pure’ control group. In community participation terms, however, CookWell’s ability to attract community participants and to deliver an intervention in community settings with which participants felt comfor-table was arguably beneficial. Allison and Rootman41have noted that it is often the processes most valued in health promotion programmes, such as community participation, which make rigorous randomised designs impossible.
Conclusion
The results of the assessments contribute to the under-standing of delivery and design of community intervention programmes and add to the evidence base on the value of food skills for healthy dietary choices amongst low-income consumers. Although the impact of the programme appears to be small in quantitative outcomes, the research supports the view that a practical food skills intervention can contribute to improving dietary choice and has provided a springboard for further development in this arena.
Acknowledgements
[image:8.612.92.510.72.185.2]We would like to thank the Food Standards Agency for commissioning this piece of work; the leaders in each community for their invaluable help with recruitment and with the general weekly running of the project; the facilitators who ran the cooking sessions; and all the participants who gave up a considerable amount of their
Table 5 Changes in percentage of subjects reporting cooking confidence for specific aspects at T1, T2 and T3
T1 T2 T3
Aspect of cooking Group Totaln n % n % n % P-value (two-sided)*
Following a recipe I 30 20 67 26 87 27 90 0.044
C 17 15 88 15 88 14 82 0.847
Cooking from basic ingredients I 28 20 71 25 89 26 93 0.060
C 20 16 80 16 80 17 85 0.895
Cooking lentil soup I 31 21 68 26 84 28 90 0.068
C 19 12 63 14 74 12 63 0.792
Cooking white sauce I 30 20 67 26 87 25 83 0.126
C 18 10 56 12 67 11 61 0.792
I – intervention; C – comparison.
time in completing the assessments. We are also very grateful to Linzie Porteous for her work in the initial stages of the project, and to all CPHNR staff who helped with data collection and data entry.
References
1 Department of Health.Nutritional Aspects of Cardiovascular Disease. Report on Health and Social Subjects No 46. London: HMSO, 1994.
2 The Scottish Office.The Scottish Diet: Report of a Working Party to the Chief Medical Officer for Scotland. Edinburgh: The Scottish Office Home and Health Department, HMSO, 1993.
3 World Cancer Research Fund, American Institute for Cancer Research. Food, Nutrition and the Prevention of Cancer: A Global Perspective. Washington, DC: American Institute for Cancer Research, 1997.
4 The Scottish Office.Scotland’s Health. A Challenge to Us All. Eating for Health: A Diet Action Plan for Scotland. Edinburgh: The Scottish Office Department of Health, HMSO, 1996.
5 Joint Health Surveys Unit.The Scottish Health Survey 1998, Volume 1. Edinburgh: Scottish Executive Health Depart-ment, TSO, 2000.
6 Forsyth A, MacIntyre S, Anderson A. Diets for disease? Intraurban variations in reported food consumption in Glasgow.Appetite1994;22: 259 – 63.
7 McGlone P, Dobson B, Dowler E, Nelson M.Food Projects and How they Work. York: Joseph Rowntree Foundation, 1999.
8 Watson A, Williams V. Review of Existing UK Work on Food and Low-income Initiatives. Brighton: A report for the Food Standards Agency by Food Matters, 2003. Also available at http//www.food.gov.uk/multimedia/pdfs/low incamefinalreport.pdf
9 Robinson N, Caraher M, Lang T. Access to shops; the views of low income shoppers.Health Education Journal2001; 59: 121 – 36.
10 Cummins S, MacIntyre S. Food deserts – evidence and assumption in health policy making.British Medical Journal
2002;325: 436 – 8.
11 Dibsdall L, Lambert N, Bobbin R, Frewer L. Low-income consumers’ attitudes and behaviour towards access, avail-ability and motivation to eat fruit and vegetables. Public Health Nutrition2003;6: 159 – 69.
12 Dibsdall LA, Lambert N, Frewer LJ. Using interpretative phenomenology to understand the experiences of a low income group of UK women towards aspects of food choice and health. Journal of Nutrition Education 2002; 34: 298 – 309.
13 Dowler E, Calvert C. Nutrition and Diet in Lone-parent Families in London. London: Family Policy Studies Centre, 1995.
14 Lang T, Caraher M, Dixon P, Carr-Hill R.Cooking Skills and Health. London: Health Education Authority, 1999. 15 Stookey JD, Barker ME. The diets of low-income women: the
role of culinary knowledge.Appetite1995;24: 286. 16 Cresswell J.Get Cooking Project Report. Glasgow: Greater
Glasgow Health Board Health Promotion Department, 1995. 17 Grampian Health Board.Now You’re Cooking. Final Report to Grampian Health Board, Primary Care Development Fund, 1997/98.
18 Dobson B, Kellard K, Talbot D.A Recipe for Success? An Evaluation of a Community Food Project. Loughborough: Centre for Research in Social Policy, Loughborough University, 2000.
19 National Food Alliance.Get Cooking. London: National Food Alliance, Department of Health, 1993.
20 Neathey H, Rowles SJ.Evaluation of Get Cooking! Enhanced Pilot. Report prepared for the Food Standards Agency Wales. Cardiff: Beaufort Research, 2004.
21 Royal Society for the encouragement of Arts, Manufactures and Commerce (RSA). Focus on Food. The Appreciation, Design, Production, Cultural and Social Importance of Food. Dean Clough, Halifax: RSA, 1997.
22 The Royal Society for the encouragement of Arts Manufactures and Commerce (RSA). The RSA Focus on Food Campaign: An Update. Dean Clough, Halifax: RSA, 1998.
23 Caraher M, Lang T. Evaluating Cooking Skills Classes: A Report to Health Promotion Wales. Cardiff: Health Promotion Wales, 1995.
24 Auld G, Fulton D. Value of theoretically based cooking classes for increasing use of commodity foods.Journal of the American Dietetic Association1995;95: 85 – 7.
25 Scottish Consumer Council. The Directory of Community Food Initiatives. Glasgow: Scottish Consumer Council, 2004. 26 Craigie A. A Quantitative Evaluation of the Scottish Community Diet Project’s Grant Giving Systems 2001 – 03. Scottish Community Diet Project 2005(available from the Scottish Community Diet Project, c/o Scottish Consumer Council, Glasgow, UK).
27 Scottish Executive.Social Focus on Deprived Areas[online], 2005. Available at http://www.scotland.gov.uk/Publica-tions/2005/09/2792129/21311
28 Stead M, Caraher M, Wrieden W, Longbottom P, Valentine K, Anderson A. Confident, fearful and hopeless cooks, findings from the development of a food-skills initiative.British Food Journal2004;106: 274 – 87.
29 Agency for Healthcare Research and Quality. Efficacy of Interventions to Modify Dietary Behavior Related to Cancer Risk. Summary, Evidence Report/Technology Assessment No. 25; AHRQ Publication No. 01-E028. Rockville, MD: Agency for Healthcare Research and Quality, November 2000. Also available at http://www.ahrq.gov/clinic/ epcsums/dietsumm.htm
30 Anderson AS, Bell A, Adamson A, Moynihan P. A ques-tionnaire assessment of nutrition knowledge – validity and reliability issues.Public Health Nutrition2002;5: 497–503. 31 Joint Health Surveys Unit. The Scottish Health Survey
1998, Volume 2. Edinburgh: Scottish Executive Health Department, TSO, 2000.
32 Gregory JR, Collins DL, Davies PSW, Hughes JM, Clarke PC.
National Diet and Nutrition Survey: Children Aged 1 1/2 to 4 1/2. Volume 1. Report of the Diet and Nutrition Survey. London: HMSO, 1995.
33 Gregory J, Lowe S. National Diet and Nutrition Survey: Young People Aged 4 – 18 years. Volume 1: Report of the Diet and Nutrition Survey. London: The Stationery Office, 2000.
34 Williams C. Healthy eating: clarifying advice about fruit and vegetables.British Medical Journal1995;310: 1453 – 5. 35 Wrieden W, Connaghan JP, Morrison C, Tunstall-Pedoe H.
Secular and socio-economomic trends in compliance with dietary targets in the north Glasgow MONICA population surveys 1986 – 95: did social gradients widen?Public Health Nutrition2004;7: 835 – 42.
36 Kennedy LA. Community involvement at what cost? – local appraisal of a pan-European nutrition promotion pro-gramme in low income neighbourhoods.Health Promotion International2001;16: 35 – 45.
37 Wrieden WL, Stead M, Caraher M, Longbottom P, Valentine K, Anderson AS. The impact of a community-based practical food skills intervention (CookWell) on assisting dietary change: qualitative findings. Proceedings of the Nutrition Society2002;61: 157A.
38 Anderson AS. Diet. In: Sancho-Garnier H, Biedermaan A, Slama K, Anderson AS, Lynge E, eds.Evidence-based Cancer Prevention Strategies for NGOs. A Handbook for Europe. Geneva: UICC, 2004; 95 – 111.
39 Barton K, Wrieden WL, Anderson AS. Validity and reliability of a short questionnaire for assessing impact of cooking skills interventions. Proceedings of the Nutrition Society
2005;64: 101A.
40 Stead M, Hastings G, Eadie D. The challenge of evaluating complex interventions: a framework for evaluating media advocacy. Health Education Research 2002; 17: 351 – 64.