University of Warwick institutional repository: http://go.warwick.ac.uk/wrap
This paper is made available online in accordance with
publisher policies. Please scroll down to view the document
itself. Please refer to the repository record for this item and our
policy information available from the repository home page for
further information.
To see the final version of this paper please visit the publisher’s website.
Access to the published version may require a subscription.
Author(s): David I. Woodward and Ian M. Reaney
Article Title: Electron diffraction of tilted perovskites
Year of publication: 2005
Link to published article:
http://dx.doi.org/10.1107/S010876810501552
Acta Crystallographica Section B Structural
Science
ISSN 0108-7681
Editor:Carolyn P. Brock
Electron diffraction of tilted perovskites
David I. Woodward and Ian M. Reaney
Acta Cryst.
(2005). B
61
, 387–399
Copyright cInternational Union of Crystallography
Author(s) of this paper may load this reprint on their own web site or institutional repository provided that this cover page is retained. Republication of this article or its storage in electronic databases other than as specified above is not permitted without prior permission in writing from the IUCr.
For further information seehttp://journals.iucr.org/services/authorrights.html
Acta Crystallographica Section B: Structural Science publishes papers in structural chem-istry and solid-state physics in which structure is the primary focus of the work reported. The central themes are the acquisition of structural knowledge from novel experimental observations or from existing data, the correlation of structural knowledge with physico-chemical and other properties, and the application of this knowledge to solve problems in the structural domain. The journal covers metals and alloys, inorganics and minerals, metal-organics and purely organic compounds.
Acta Cryst.(2005). B61, 387–399 doi:10.1107/S0108768105015521
387
Acta Crystallographica Section BStructural Science
ISSN 0108-7681
Electron diffraction of tilted perovskites
David I. Woodward* and Ian M. Reaney
Ceramics and Composites Laboratory, Depart-ment of Engineering Materials, University of Sheffield, Sir Robert Hadfield Building, Mappin Street, Sheffield S1 3JD, England
Correspondence e-mail: [email protected]
#2005 International Union of Crystallography Printed in Great Britain – all rights reserved
Simulations of electron diffraction patterns for each of the known perovskite tilt systems have been performed. The conditions for the appearance of superlattice reflections arising from rotations of the octahedra are modified to take into account the effects of different tilt systems for kinematical diffraction. The use of selected-area electron diffraction as a tool for perovskite structure determination is reviewed and examples are included.
Received 29 March 2005 Accepted 16 May 2005
1. Introduction
Perovskites have been of major technological importance since Wul & Goldman (1945) published research showing the extremely high relative permittivity of the perovskite BaTiO3.
Most structural studies of perovskites are concerned with the mechanisms by which perovskites distort from their cubic prototype symmetry. One of these mechanisms is the rotating or ‘tilting’ of the corner-shared oxygen octahedra that form the structure. When an octahedron is tilted about one of the cubich001idirections, the four adjacent octahedra in the plane normal to the tilt axis are constrained to tilt in opposite senses. However, the octahedra directly above and below are not so constrained and can tilt in one of two ways. If they tilt in the same sense as the central octahedron, the tilt is described as being ‘in-phase’. If they tilt in the opposite sense as the central octahedron, the tilt is described as being ‘antiphase’.
Reaneyet al.(1994) demonstrated the dependence of tilting on the tolerance factor,t, a quantity suggested by Goldschmidt (1926) to determine the stability of perovskite phases
t¼ ðRAþROÞ=½21=2ðR
BþROÞ; ð1Þ
A notation for describing and classifying tilting was proposed by Glazer (1972) and is widely used today. All tilts are described as combinations of component tilts about the three tetrad axes. The lettersa,bandcare used to denote the magnitudes of tilt about the [100], [010] and [001] pseudocubic axes sequentially. Where the octahedra are tilted equally about two axes, this is denoted by repeating the appropriate letter;e.g. ‘aaa’ refers to equal tilts about all three axes and ‘abc’ refers to unequal tilts about each axis. In-phase tilting is denoted in Glazer (1972) notation with a superscript ‘+’ after the appropriate letter. Antiphase tilting is denoted with a superscript ‘’ after the appropriate letter. Where no tilting takes place about an axis, a superscript ‘0’ is used. Hence, a0a0c refers to a perovskite with antiphase tilting about the pseudocubiccaxis only.
It was shown that 23 different tilt systems could be derived from this approach, but several of these result in the same space group and in fact only 15 distinct space groups were derived. Howard & Stokes (1998, 2002) used a group-theo-retical analysis to determine the possible tilt systems for perovskites, and also found 15 distinct space groups to describe the tilt systems. They further argued that there could only be 15 corresponding tilt systems, since if different tilt systems resulted in the same space group, then the system with the lowest symmetry must prevail. Howard & Stokes (1998, 2002) represented the 15 space groups diagrammatically in order to indicate the group–subgroup relationship between tilt systems (Fig. 1). This diagram indicates the hierarchy of tilt systems by linking those systems that are related by an infi-nitesimal change in the tilt components.
Woodward (1997a) considered the geometrical implications of different tilt systems. He argued that for two of the space groups (P42/nmcandCmcm), the octahedra may only remain
connected if they distort. Howard & Stokes (1998, 2002) later showed that distortion was not necessary for perovskites with the space groupCmcm. Most treatments of tilting, including
that of Glazer (1972), assume perfectly rigid octahedra, but in practice some distortion of the octahedra always takes place. One interesting consequence of this is that the resultant space group may depend on how the octahedra distort, as demon-strated by Woodward (1997a) for thea+a+a anda0b+b tilt systems.
A large amount of current research is concerned with identifying the structures and symmetries adopted by tilted perovskites. X-ray diffraction is limited by the fact that scat-tering by oxygen is considerably weaker than that from cations and so the information concerning the oxygen sublattice is easily masked. Neutron diffraction from the oxygen sublattice is much stronger, relative to X-rays, and this technique makes identifying distortions or rotations of the octahedra feasible. Nonetheless, small structural distortions which give rise to weak superlattice reflections may still be difficult to observe, particularly if they occur over relatively short coherence lengths. Electron diffraction has the advantage that single-crystal/domain diffraction data may be routinely obtained from relatively small regions of0.5mm. It is also sensitive to superlattice reflections which arise due to weak, short-range effects. Therefore, knowledge of how different perovskite tilt systems relate to the electron diffraction patterns can make the unambiguous determination of symmetry easier.
2. Methodology
[image:4.610.315.560.514.696.2]The work presented here is based on simulations of tilted perovskite structures using the appropriate space-group symmetry within the construction package of the computer programCaRIne Crystallography, Version 3.1.CaRIneis used to make basic structure-factor calculations and generate a reciprocal lattice with the appropriate kinematic intensities using the lattice parameters, space group symmetry and ionic positions. A slice of reciprocal space normal to low-order
Figure 1
The distinct tilt systems and the group–subgroup relationship between them. Reproduced with kind permission from Howard & Stokes (1998, 2002)
Figure 2
[image:4.610.47.295.519.702.2]pseudocubic directions is then considered to represent major zone-axis diffraction patterns (ZADPs) from the perovskite crystal. No attempt was made to perform dynamical calcula-tions. Consequently, intensities of reflections are only used qualitatively to aid interpretation of diffraction data. This approach is not unique and is a standard method of indexing electron diffraction data. However, care was taken to assess whether octahedra within a given structure were distorted or rotated without distortion.
The data set for the simulations was mainly generated from the ionic positions of structures previously determined by X-ray and neutron diffraction. Where no known structure or compound corresponded to a specific tilt system, a model was created manually within theCaRInesoftware using the space groups suggested by Glazer (1972) and subsequently corrected by Glazer (1975) and Leinenweber & Parise (1995). Small, sensible rotations of the octahedra were assumed, often using amplitudes of tilt and lattice parameters obtained from analogous compounds, and were used to generate non-zero superlattice intensities commensurate with the tilt system and space group. The computer program POTATO(Woodward, 1997b), which generates lattice parameters and ionic positions for tilted perovskites, was used to check these models.
The results of the simulations are intended to assist in using single-domain electron diffraction data to identify tilt systems and the associated symmetry. There is no attempt to model superlattice intensities for the different tilt systems using dynamical calculations. The authors feel that this is an unne-cessary complication at this stage.
As the natures of in-phase and antiphase tilts are rather different, we will first consider solely antiphase tilt systems, followed by in-phase tilts and finally mixtures of the two. All crystallographic directions and planes refer to the simple pseudocubic unit cell.
3. Antiphase tilt systems
The problem with considering tilting as a combination of individual tilts about three Cartesian axes is, as stated by Glazer (1972), that the final structure depends on the order in which the tilts are imposed. The perovskite structure
predic-tion programs POTATO (Woodward, 1997b) and SPuDS
(Lufaso & Woodward, 2001) deal with this problem by applying extremely small tilts incrementally to each of the three axes in turn. We, like Zhaoet al.(1993), believe that the
alternative is to consider antiphase tilting as a single operation about a chosen axis and that the tilt systemsa0a0c, a0bb andaaaare special cases that involve tilting about the axes [001], [011] and [111], respectively, which pass through the centre of each octahedron.
Glazer (1975) gives simple formulae for determining the indices of the superstructure reflections that arise due to antiphase tilting, in addition to a formula for deriving the intensity of these reflections. These formulae indicate that antiphase tilting results in 1
2{ooo} reflections (where ‘o’
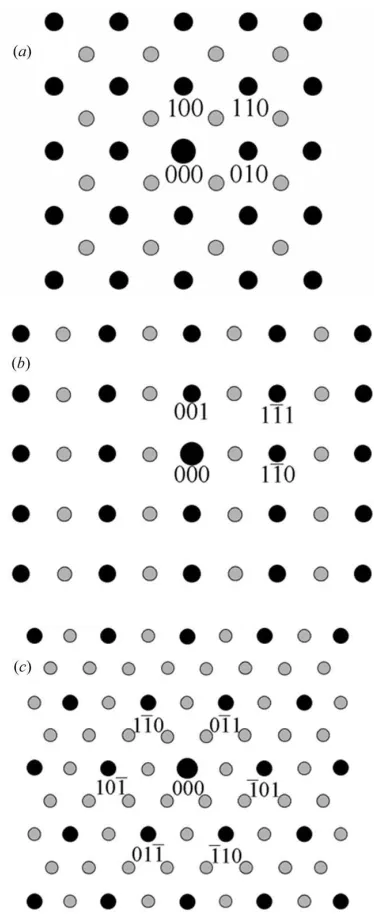
indi-cates an index with an odd number). Reaney et al. (1994) applied these rules to electron diffraction and showed that these reflections appear inh110iZADPs (Fig. 2).
The original diffraction rules proposed by Glazer (1975) for reflections produced as a result of antiphase tilting are reproduced here for convenience
a produces reflections of type 1
2ðoooÞwith k6¼l: ð2Þ
bproduces reflections of type 1
2ðoooÞwithh6¼l: ð3Þ
c produces reflections of type 1
2ðoooÞwith h6¼k: ð4Þ
Iða;b;cÞ / ½ðkillikÞ ðlihþhilÞ ðhikkihÞ2;
ð5Þ
whereh,kandlare the Miller indices of the1
2(hkl) reflection;
,and are the resolved tilt angles about [100], [010] and [001], respectively;i=ð1Þ1=2.
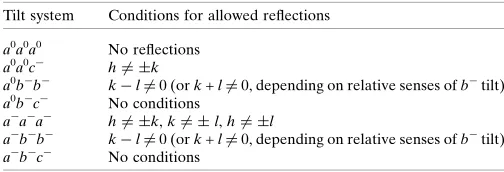
Implicit within the intensity formula is the fact that certain reflections may become absent when tilting of equal magni-tude occurs about different orthogonal axes. The conditions for allowed reflections have been detailed explicitly here in Table 1.
Electron diffraction does not, in general, result in perfectly kinematical scattering, since in only the thinnest sample will there be only one scattering event for an electron passing
[image:5.610.45.297.103.189.2]Acta Cryst.(2005). B61, 387–399 Woodward and Reaney Tilted perovskites
389
Table 1List of conditions for allowed 1
2(ooo) reflections for all antiphase tilt
systems.
Tilt system Conditions for allowed reflections
a0a0a0 No reflections a0a0c h6¼ k
a0bb kl6¼0 (ork+l6¼0, depending on relative senses ofbtilt) a0bc No conditions
aaa h6¼ k,k6¼ l,h6¼ l
[image:5.610.315.564.504.720.2]abb kl6¼0 (ork+l6¼0, depending on relative senses ofbtilt) abc No conditions
Figure 3
through the sample. Multiple scattering is inevitable in most samples and this has the effect of giving reflections in positions in a diffraction pattern that are absent kinematically;e.g. in a0a0ctilting, the 1
2(111) reflection is kinematically forbidden
from the [0111] ZADP, but may occur by the double diffraction route:1
2(311) + (1100). Thus, the systematic absences of reflec-
tions cannot be applied to images of diffraction patterns as a means of identifying tilt systems.
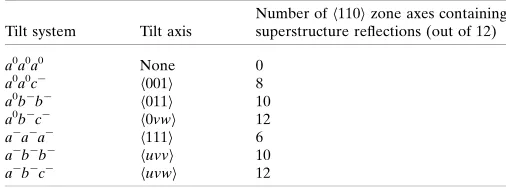
The main reason for considering antiphase tilting as occurring about a single axis is critically because the resultant superstructure reflections are absent from theh110izone axes found perpendicular to the tilt axis. This may be derived from the intensity formula published by Glazer (1975), but has not been explicitly mentioned until recently (Woodward et al., 2003). In the case of theaaatilt system, the tilt axis may be chosen as [111] and therefore 6 of the 12h110ivariants contain
superstructure reflections and the other six do not. In electron diffraction, this allows for either a statistical or an orienta-tional method of deducing tilt systems. Table 2 lists the anti-phase tilt systems, the corresponding tilt axes and the proportion of h110i ZADPs that contain 1
2{ooo} reflections.
These data can be used to progressively eliminate tilt systems simply by observingh110iZADPs,e.g.the presence of ZADPs both with and without superstructure reflections eliminates the tilt systemsa0a0a0,a0bcandabc.
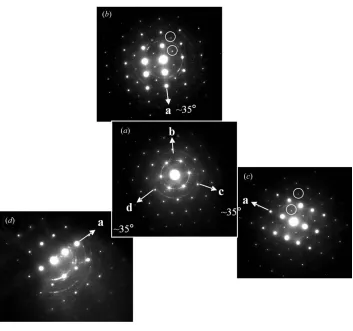
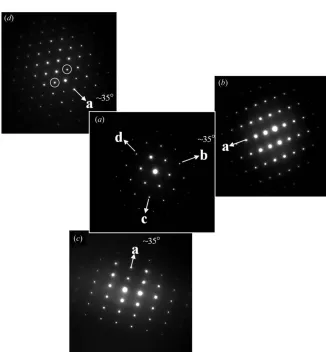
The orientational method available for distinguishing between these systems has been previously demonstrated for BiFeO3(Woodwardet al., 2003). If a thin specimen is placed
into a double tilt holder in a transmission electron microscope and ah111iaxis can be aligned parallel with the electron beam without significant tilting of the stage, then three zone axes of type h110i may be obtained by tilting the stage through35 (Fig. 3). The presence or absence of superstructure reflec-tions may then be used to infer the tilt system, using the information in Table 3. However, from Tables 2 and 3 it can be seen that this technique alone is insufficient to distinguish a0bb
from abb and neither can it distinguisha0bcfromabc.
The latter two tilt systems are extremely uncommon in perovskites (Lufaso & Woodward, 2001) and, in addition to abb, may be consid-ered as intermediate systems that are expected to occur only in narrow phase fields of solid solutions between
more common, competing tilt
systems,e.g.La-doped PZT (Knudsen et al., 2003). If tilting is viewed as an operation about a single axis, it is simple to envisage a continuous movement of the axis between two vectors. This is analogous to polar-ization, which, at the morphotropic phase boundary of PbZrxTi1xO3, is
[image:6.610.44.297.104.198.2]considered to rotate between [001]
Table 2
The relationship between tilt axis and the occurrence of superstructure reflections inh110iZADPs for all different antiphase tilt systems.
Tilt system Tilt axis
Number ofh110izone axes containing superstructure reflections (out of 12)
a0a0a0 None 0
a0a0c h001i 8
a0bb h011i 10
a0bc h0vwi 12
aaa h111i 6
abb huvvi 10
abc huvwi 12
Table 3
The distribution ofh110iZADPs containing superstructure reflections for antiphase tilt systems.
No. ofh110iZADPs containing superstructure reflections at35 from theh111izone axes
Tilt system Tilt axis (example) [111] [1111] [1111] [1111]
a0a0a0 None 0 0 0 0
a0a0c [001] 2 2 2 2 a0bb [011] 3 3 2 2
a0bc [0vw] 3 3 3 3
aaa [111] 3 1 1 1
abb [uvv] 3 3 2 2
[image:6.610.312.569.104.219.2]abc [uvw] 3 3 3 3
Figure 4
Kinematical diffraction patterns simulated for perovskites with in-phase tilting about [001]. (a) The
[image:6.610.49.395.440.695.2](tetragonal) and [111] (rhombohedral) via an intermediate monoclinic phase in which the polarization vector lies within the common (1110) plane (Noheda et al., 2000).
Movement of the tilt axis from [100] toward [111] within the (0111) plane results in abb tilting about an axis of type [uvv], as would movement of the axis between [011] and [111]. Similarly, movement of an axis between [011] and [001] within the plane (100) would result in ana0bctilt system, whereas
abctilting cannot result from any such simple movement of the axis between these principal directions.
The tilt systems abb, a0bc and abc may be distinguished from all other antiphase tilt systems by the presence of superstructure reflections of varying intensity. In
all other antiphase tilt systems, the superstructure reflections are constrained to be of equal intensity due to the zone axes all being inclined at equal angles to the tilt axis. In the case of abb anda0bc systems, the reflections may be qualita-tively categorized as either weak or strong, relative to the fundamental reflections. The ability to separate reflections into weak and strong provides additional structural informa-tion, especially if the statistical or geometric distribution of the different zone axis types can be determined. A note of caution should be sounded here, since the intensity of reflections may be affected by physical factors, in particular the thickness of the sample, and great care should be taken not to place too much emphasis on slight differences in intensity. The cases we will consider here will be those where the superstructure reflections are either strong, extremely weak or completely absent.
3.1. Theabbtilt system
This tilt system may be found as an intermediate when the tilt axis moves in one of two ways within the (0111) plane:
(i) [011]$[111] (35.3); (ii) [100] $[111] (54.7).
(A tilt axis moving between [100] and [011] must pass through [111] and is therefore incorporated into the two cases above). Three extreme cases of this tilt system can be derived:a’b, where the tilt axis approaches [111]; a ’0, where the axis approaches [011]; b ’ 0, where the axis approaches [100]. Tables 4 and 5 show how the distributions of superstructure reflections change between the limiting cases.
The data in Tables 4 and 5 show thatabbtilt systems in the limiting casesa’bandb’0 can be distinguished from
[image:7.610.310.567.104.176.2]Acta Cryst.(2005). B61, 387–399 Woodward and Reaney Tilted perovskites
391
Table 4The occurrence of superstructure reflections in h110i ZADPs for all limiting cases of tilt systemabb.
Number ofh110izone axes containing superstructure reflections of specific intensity (out of 12)
Limiting case Strong Weak Absent
a’b 6 4 2
a’0 10† 0 2
b’0 8 2 2
[image:7.610.75.262.253.713.2]† Intensities are all strong, but not constrained to be equal.
Table 5
The distribution ofh110iZADPs containing superstructure reflections for the three limiting cases of theabbtilt system.
No. ofh110iZADPs containing superstructure reflections at35from
h111izone axes in the order strong/weak/absent
Limiting case Tilt pseudo-axis [111] [1111] [1111] [1111]
a’b [111] 3/0/0 1/2/0 1/1/1 1/1/1 a’0 [011] 3/0/0 3/0/0 2/0/1 2/0/1 b’0 [100] 2/1/0 2/1/0 2/0/1 2/0/1
Figure 5
[image:7.610.315.565.267.355.2]each other, but distinguishing the limiting casea’0 from the tilt systema0bbby electron diffraction is made impossible due to the absence of weak superstructure reflections.
3.2. Thea0bctilt system
This tilt system is found as an intermediate when the tilt axis moves between [011] and [010] or [001] in the (100) plane through an angle of 45. In this case there are two distinct limiting cases; b’candb(orc)’0.
The data in Tables 6 and 7 may assist in identifying thea0bc tilt system. However, in all but the limiting cases described above, this may easily be confused with the abc system, which similarly produces superstructure reflections in allh110iZADPs, but without any constraints on the intensity of these reflections. An extensive search by Woodward (1997c) reveals only one perovskite with anabctilt, so it is not common. Selected-area electron diffraction of a single sample is therefore not an adequate way to determine unambiguously the presence of this tilt system.
4. In-phase tilt systems
In-phase tilt systems differ subtly from antiphase tilt systems. The principle of considering a single tilt axis, as performed for antiphase tilting, does not apply to in-phase tilt systems, but as there are only four, this is not much of a problem. The a0a0c+ system is simple and easily derived. A treatment of a+a+a+anda0b+b+systems has been performed by O’Keeffe & Hyde (1977).
[image:8.610.313.568.104.184.2]Glazer (1975) developed rules for superstructure reflections arising from in-phase tilting. Again, these are reproduced here for convenience
Figure 6
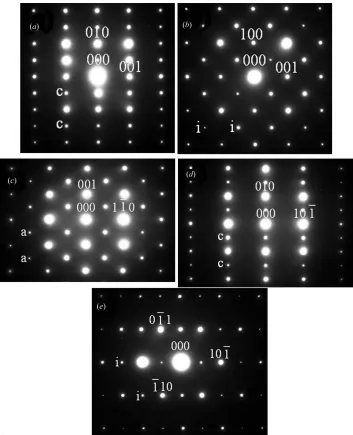
Electron diffraction patterns obtained from a sample of CaTiO3. These are arbitrarily indexed with zone
[image:8.610.44.298.104.167.2]axes (a) [100], (b) [010], (c) [110], (d) [101] and (e) [111]. Superstructure reflections are indicated with: ‘a’ = antiphase tilt reflection, ‘i’ = in-phase tilt reflection, ‘c’ = concert reflection/antiparallel cation displacement.
Table 6
The occurrence of superstructure reflections inh110iZADPs for both limiting cases of tilt systema0bc.
Number ofh110izone axes containing superstructure reflections of specific intensity (out of 12)
Limiting case Strong Weak Absent
b’c 10 2 0
b’0 8 4 0
Table 7
The distribution ofh110iZADPs containing superstructure reflections for both limiting cases of thea0bctilt system.
No. ofh110iZADPs containing superstructure reflections at35from
h111izone axes in the order strong/weak/absent
Limiting case Tilt pseudo-axis [111] [1111] [1111] [1111]
[image:8.610.49.402.270.705.2]aþproduces reflections of type 1
2ðeooÞwithk6¼l ð6Þ
bþ produces reflections of type 1
2ðoeoÞwithh6¼l ð7Þ
cþproduces reflections of type 1
2ðooeÞwith h6¼k: ð8Þ
Adaptation by Reaneyet al.(1994) of these rules for elec-tron diffraction showed that these reflections appear inh100i andh111izone axes and are absent from theh110izone axes for the tilt systems studied.
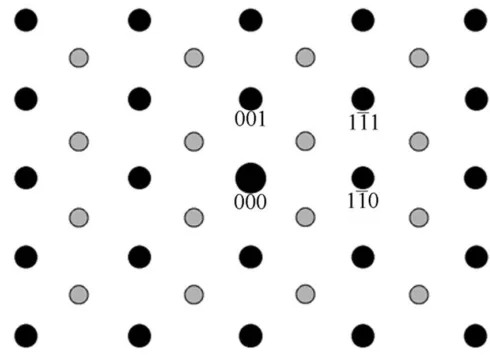
Simulations of in-phase tilted perovskites have shown that the above conditions are only true in the case where a single axis is in-phase tilted. The a0a0c+ tilt system exhibits super-structure reflections in only theh001iZADP obtained parallel to the tilt axis and also in allh111iZADPs, consistent with the conditions listed by Glazer (1975). Fig. 4 shows schematics of the appropriate diffraction images. The arrangement of superstructure reflections in the h111i ZADPs destroys the sixfold symmetry of the diffraction pattern, giving rise to only twofold symmetry and a uniqueh110idirection. This direction
is perpendicular to the in-phase tilt axis; e.g.in Fig. 4(b) the unique axis is [1110] or [ 1110], perpendicular to the in-phase tilt axis [001].
However, when more than one axis is tilted in-phase, these rules change. Reflections of the type1
2{ooe} are still generated,
but without any of the constraints listed above. As a result,
1
2{ooe} [i.e. 1 2(ooe),
1
2(oeo) and 1
2(eoo)] superstructure reflections
are found to be present in allh100i,h110iandh111iZADPs in all positions. Fig. 5 shows the schematics of these zone axes.
Selected-area electron diffraction cannot distinguish between two axes tilted phase and three axes tilted in-phase. The tilt systemsa+a+a+,a0b+b+anda+b+c+all produce the same number, type and distribution of superstructure reflections. This is immediately obvious to the reader when it is considered that the space groups for these tilt systems areIm33, I4/mmmandImmm, respectively. The symmetry operators in each space group produce the same reflection conditions, dominated by the body-centred operation.
5. Mixed tilt systems
Four distinct tilt systems exist that exhibit a combination of in-phase and antiphase tilting; a0bc+, aac+, abc+ anda+a+c. All of
these exhibit the reflections
expected from the antiphase and in-phase tilt systems separately, but additional reflections (hereafter referred to as ‘concert’ reflections) caused by the combination of in-phase and antiin-phase tilting are also observed at 1
2{oee} positions
in some h100i and h110i ZADPs for all four systems. Reflections are also generated with the general
form 1
2{ooe} in some of these
systems, while the a0bc+ system
exhibits additional 1
2(ooo)
reflec-tions.
Concert reflections have been
noted in neutron diffraction
patterns of tilted perovskites (e.g. Howardet al., 2000). Reaneyet al. (1994) associate reflections in the
1
2{eeo} positions with antiparallel
shifts of the A-site species in a particular direction, but the inten-sity of these reflections also includes a contribution from the oxygen displacements. We include a kine-matical treatment of these tilt systems, followed by a qualitative treatment assuming multiple scat-tering.
[image:9.610.49.397.314.708.2]Acta Cryst.(2005). B61, 387–399 Woodward and Reaney Tilted perovskites
393
Figure 7Electron diffraction patterns obtained from a sample of BiFeO3. These are arbitrarily indexed with zone
aþproduces 1
2ðoeeÞreflections with 1
2ðh00Þreflections
absent: ð9Þ
bþproduces 1
2ðeoeÞreflections with 1
2ð0k0Þreflections
absent: ð10Þ
cþ produces 1
2ðeeoÞreflections with 12ð00lÞreflections
absent: ð11Þ
Two axes tilted in-phase produce 1 2ðoeeÞ;
1 2ðeoeÞ
and 1
2ðeeoÞreflections with 1 2ðh00Þ;
1
2ð0k0Þand 1 2ð00lÞ
reflections absent;respectively: ð12Þ
In addition to these conditions, the reflections are also absent from the ZADP obtained parallel to the antiphase tilt axis. More precisely
a0bcþ:k6¼0: ð13Þ
abcþ:no additional conditions: ð14Þ
aacþ:hk6¼0ðor hþk6¼0; depending on the sense
of antiphase tiltÞ: ð15Þ
aþaþc:h6¼ k: ð16Þ
Reflections of the general type1
2{ooe} are produced as follows
aþ produces 1
2ðeooÞreflections: ð17Þ
bþ produces 1
2ðoeoÞreflections: ð18Þ
cþproduces 1
2ðooeÞreflections: ð19Þ
Two axes tilted in-phase produces 1 2ðooeÞ;
1
2ðoeoÞand 1
2ðeooÞreflections: ð20Þ
These are indistinguishable from those generated solely by in-phase tilting, although in some mixed-tilt systems there are differences in the conditions for absences. These are listed below
a0bcþ:1
2ðhhh0Þand 1
2ðhh0Þabsent: ð21Þ
abcþ:No additional conditions: ð22Þ
aacþ:h6¼ k: ð23Þ
aþaþc: No additional conditions: ð24Þ
Finally, in the a0bc+ system, 1
2{ooo} reflections are
gener-ated with no absences and as such will appear in everyh110i ZADP.
The application of multiple scattering to the kinematical simulation results in a distribution of the superstructure reflections around the various ZADPs. Table 8 lists the reflections that are allowed for the mixed tilt systems and the ZADPs in which they are allowed to appear.
The1
2{oee} reflections do not appear in
solely in-phase or antiphase tilt systems and are therefore a useful indicator of mixed tilting. However, a note of caution should be sounded, as these reflections may also be created by antiparallel cation displacements leading to doubling along
h100i directions and so one should be careful if relying solely on these as proof of mixed tilting. However, the data in Table 8 simplify distinguishing between the systemsab+aanda0bc+(space groups
Pnma and Cmcm, respectively) – a
problem for many researchers, particularly in the (Ca,Sr)TiO3solid solution (e.g.Ball
et al., 1998; Ranjanet al., 1999).
6. Various notes of caution:
[image:10.610.47.373.355.707.2]In addition to tilting, there are two other sources of superstructure reflections; the antiparallel displacement of cations and the ordering of chemical species, such as dissimilarA- orB-site cations and oxygen vacancies (Reaney, 1996). The super-structure reflections generated by anti-parallel cation displacements (e.g. in antiferroelectric compounds) depend on the polarization axes and the repeat distances and as such are considered far too extensive to include here. Ordering of
Figure 8
Results of tilt experiment for BiFeO3. (a) The centralh111iZADP, (b) and (c)h110iZADPs
chemical species generally takes place on close-packed {111} planes and will generate reflections at1
y{hkl} positions in those ZADPs obtained parallel to the close-packed planes, wherey is an integer describing the number of close-packed planes in
the repeat distance, subject to the condi-tion 1
y(h + k + l) =n for ordering on the (111) planes. For example, BaZn1/3Ta2/3O3
exhibits 2:1 ordering, resulting in y = 3 (Jacobson et al., 1976), although the reflections generated by ordering cannot be confused with reflections arising from tilting. However, problems may arise where 1:1 ordering exists. In this case,
1
2{ooo} reflections will appear in all h110i
ZADPs and mask any information
concerning the presence or nature of antiphase tilting. In these cases, it is down to the individual concerned to decide whether the species present are likely to order in this manner or whether the tolerance factor is of an appropriate value for antiphase tilting to occur (Reaneyet al., 1994). In addition, as Lufaso & Woodward (2001) point out, certain tilt systems such as a+a+a+ have multiple A-site geometries and are stabilized by having multiple, ordered, A-site cations. Thus, ordering may be implicit in certain tilt systems and ordering reflections inextricably linked with the reflections asso-ciated with the tilt system, although in Ca3CuTi4O12 (a
+
a+a+), the body-centred ordering of Ca and Cu in Ca3CuTi4O12 produces exactly the
same reflections as the tilt system (Propach, 1977).
Another important point is that the details published here show what reflections are allowed, but do not mean that the intensity of a superstructure reflection will be sufficient for it to be resolved from
the background. Some concert
reflections are expected to be
particularly weak and great care should be taken to confirm their presence or absence. Similarly, the intensity of tilting reflections is directly related to the amplitude of tilt, and if this is extremely small, the spots may not be clearly visible.
All of the conditions listed depend on the electron diffraction patterns being obtained from single domains. In many cases, the electron diffraction patterns described above may be derived by the superposition of diffraction patterns from several adjacent domains. It is a necessity of using the data published here that diffraction is obtained from single domains. In some samples, the
[image:11.610.46.373.94.206.2]Acta Cryst.(2005). B61, 387–399 Woodward and Reaney Tilted perovskites
395
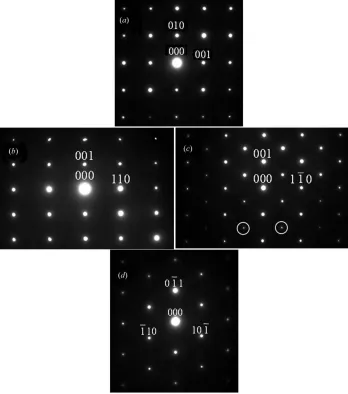
Figure 9Diffraction patterns obtained from PbZrO3sample with zone axes chosen as (a) [001], (b) [100], (c)
[image:11.610.48.400.310.708.2][101], (d) [110], (e) [1111] and (f) [111]. The superstructure spots relating to antiphase tilting are ringed. All other superstructure reflections, associated with other distortive mechanisms, are arrowed.
Table 8
List of superstructure reflections present in ZADPs for mixed tilt systems.
Zone axis a0bc+ abc+ aac+ a+a+c
[100] 1 2(eeo)
1 2(eeo)
1 2(eeo)
1 2(eeo) +
1 2(eoe) +
1 2(eoo)
[010] – 1
2(eeo)
1 2(eeo)
1 2(eeo) +
1 2(oee) +
1 2(oeo)
[001] 1 2(ooe)
1 2(ooe)
1 2(ooe)
1 2(ooe)
[110] 1 2(ooo) +
1 2(ooe) +
1 2(eeo)
1 2(ooo) +
1 2(ooe) +
1 2(eeo)
1 2(ooo)
1 2(ooe)
[1110] 1
2(ooo) +12(ooe) +12(eeo) 12(ooo) +12(ooe) +12(eeo) 12(eeo) 12(ooe)
[101] 1 2(ooo)
1 2(ooo)
1 2(ooo)
1 2(ooo) +
1 2(oeo) +
1 2(eoe)
[1101] 1 2(ooo)
1 2(ooo)
1 2(ooo)
1 2(ooo) +
1 2(oeo) +
1 2(eoe)
[011] 1 2(ooo)
1 2(ooo)
1 2(ooo)
1 2(ooo) +
1 2(eoo) +
1 2(oee)
[0111] 1 2(ooo)
1 2(ooo)
1 2(ooo)
1 2(ooo) +
1 2(eoo) +
1 2(oee)
h111i 1 2(ooe)
1 2(ooe)
1 2(ooe)
existence of fine-scale twinning may make this difficult or impossible. In such cases, it may be possible to employ convergent beam or micro-diffraction techniques to obtain diffraction patterns from the individual domains of the twin-ning region.
7. Examples
7.1. CaTiO3
Diffraction patterns obtained from a TEM sample of CaTiO3 are shown in Fig. 6 (for details of fabrication, see
Bagshawet al., 2003). These represent all the possible variants of the h100i, h110i andh111i ZADPs found in CaTiO3. The
superstructure reflections in Figs. 6(b) and (e) are indicative of in-phase tilting about a single axis, chosen arbitrarily as [010]. This limits the tilt system to one of four possibilities:a0b+a0, a0b+c, ab+c or ab+a. The superstructure reflections in Fig. 6(c) indicate antiphase tilting, eliminating a0b+a0. The diffraction pattern in Fig. 6(d) is not observed with either a0b+corab+ctilt systems. This leavesab+aas the only possible tilt system. This corresponds to the space groupPnma
(Glazer, 1972), which is the recognized space group for this compound.
7.2. BiFeO3
Diffraction patterns obtained from a TEM sample of BiFeO3are shown in Fig. 7 and represent all variants of the
h100i,h110iandh111iZADPs that may be obtained from this material (for fabrication details, see Woodward et al., 2003). The absence of superstructure reflections from theh100iand
h111iZADPs (Figs. 7aandc) indicates that in-phase tilting is not present. The presence of1
2{ooo} superstructure reflections
in some h110i ZADPs demonstrates that antiphase tilting is present, but the absence of these reflections from someh110i ZADPs eliminatesa0bcandabctilt systems (see Table 2). The data in Table 3 are now used to relate the occurrence of superstructure reflections around ah111izone with the tilt system. Fig. 8 shows the result of one such experiment conducted on a single domain in the BiFeO3sample. Two of
the threeh110i ZADPs do not exhibit superstructure reflec-tions, but one does. Table 3 shows that this arrangement corresponds only to theaaatilt system. The space group associated with this system is R33c(Glazer, 1972). The recog-nized space group for this material isR3c, a subgroup ofR33cobtained through the loss of the centre of symmetry which occurs due to ferroelectric cation displacements.
7.3. PbZrO3
PbZrO3was made by a standard
mixed-oxide processing route.
Powders were milled and then reacted for 4 h at 1023 K followed by sintering for 3 h at 1525 K. Further details of the fabrication may be found elsewhere (Knudsen, 2002).
Identification of the tilt system present in PbZrO3 is complicated
[image:12.610.50.403.365.696.2]by the presence of many additional superstructure reflections which arise as a result of a particular arrangement of antiparallel ionic displacements (see Figs. 9a,b,eand f). Some of these reflections are clearly visible, but some that appear in simulations of the diffraction patterns are so weak in practice that they do not appear in the diffraction patterns included here. In addition, some of these appear in positions that could be associated with types of tilting. However, with careful treatment, it is still possible to use the methods presented here to exclude the majority of tilt systems.
Figure 10
Results of the first tilt experiment for PbZrO3. (a) The centralh111iZADP, (b) and (c)h110iZADPs
The superimposed polycrystalline ring patterns arise from surface damage of the PbZrO3during milling. This has been
previously observed and is not considered to affect the crys-tallographic data from the perovskite phase (Reaney et al., 1997).
Some 1
2{ooe} reflections are observed in some h100i and
h111iZADPs (Figs. 9aandf) that might be associated with in-phase tilting. However, the rules of in-in-phase tilting demand that allh111iZADPs contain1
2{ooe} reflections. As this is not
the case (Fig. 9e), in-phase tilting is not present. The h110i ZADPs exist both with and without 1
2{ooo} superstructure
reflections, demonstrating, as with BiFeO3, that antiphase
tilting is present, but that tilt systemsa0bcandabcare excluded. The tilt experiment presented for BiFeO3 in the
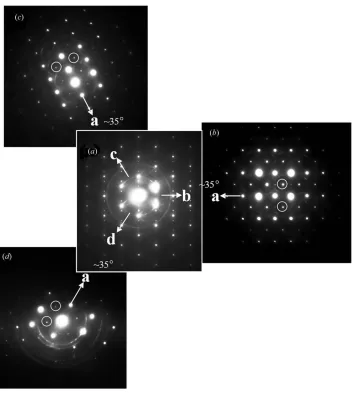
previous section is performed around the firsth111ivariant of PbZrO3 (Fig. 10) and reveals that two out of three h110i
ZADPs (Figs. 10b and c) contain 1
2{ooo} superstructure
reflections, thus eliminating theaaatilt system and leaving a0a0c,a0bbandabbas the only possibilities. A second tilt experiment (Fig. 11) performed around the second h111i
variant reveals that all three h110i ZADPs contain 1 2{ooo}
reflections, eliminating thea0a0ctilt system.
Distinguishing between a0bb and abb tilt systems relies on observing differences in intensity of the super-structure reflections found in different zones. As these inten-sities are affected by more than just the tilt angle or axis, electron diffraction is not the most reliable way to determine the tilt system and in this case the tilt system is left with two possible choices. However, the tilt system is known from structural refinements against X-ray diffraction patterns to be a0bb(Glazeret al., 1993).
7.4. Na1/2Bi1/2TiO3(NBT;in situhot-stage study)
NBT ceramics were made by a standard oxide/carbonate processing route. Stoichiometrically mixed powders were calcined for 2 h at 1023 K and sintered for 2 h at 1448 K. Neutron diffraction experiments conducted by Jones & Thomas (2000, 2002) have shown that NBT has the tilt system a0a0c+between 673 and 773 K.
Diffraction patterns were
obtained from a thinned ceramic sample of NBT heated to 713 K. The variants of theh100i,h110iand
h111i ZADPs obtained from this sample are shown in Fig. 12. The
1
2(ooe) reflections seen in Fig. 12(d)
show the presence of in-phase tilting about a single axis, confirmed by the superstructure reflections seen in some, but not all h100i
ZADPs (Figs. 12a and b) and
consistent with the a0a0c+ tilt system. Unexpectedly though, all recorded h110i ZADPs exhibit extremely weak 1
2(ooo) reflections
which do not immediately appear to be consistent with the proposed tilt
system. However, the extreme
weakness of these reflections, rela-tive to the in-phase tilt reflections, gives reasonable grounds to ques-tion whether these really relate to macroscopic antiphase tilting. It is known that for NBT, two different structures – one with in-phase tilting and one with antiphase tilting – may coexist over certain tmperature ranges, and although this is not expected at the temperature used, only a small volume fraction of this structure would be required to produce the 12(ooo) spots seen. Alternatively, these reflections may relate to very weak, localized ordering of theA-site cations. This may be more likely as the different
[image:13.610.50.402.329.723.2]Acta Cryst.(2005). B61, 387–399 Woodward and Reaney Tilted perovskites
397
Figure 11Results of the second tilt experiment for PbZrO3. (a) The centralh111iZADP, (b), (c) and (d)h110i
valences of Na+and Bi3+provide an appropriate driving force for ordering, but no other reports of ordering are known for NBT. Ultimately, however, these data indicate that the macroscopic tilt system is a0a0c+, although small deviations from this tilt system cannot be completely ruled out.
8. Conclusions
All distinct tilt systems for perovskites listed by Howard & Stokes (1998, 2002) have been simulated and the effects on the resulting allowed reflections and electron diffraction patterns listed with the intention of simplifying the allocation of tilt systems and ultimately space groups to perovskites. Particular attention has been paid to the use of selected-area electron diffraction as a key laboratory-based tool for solving tilt systems. The inclusion of tables indicating the structural
significance of the appearance and arrangements of super-structure reflections will enable future researchers to make the fullest use of selected-area electron diffraction as a technique for investigating tilting of perovskites. The use of this tech-nique has been adequately demonstrated for several tilt systems for known compounds and structures.
Thanks to Pat Woodward (Ohio State University, USA) and Mike Lufaso (University of South Carolina, USA) for the use of their computer programs and their enthusiasm. For ceramic processing, the authors wish to thank Rachel Wallace and Heath Bagshaw. We appreciate the help of Peter Korgul and Peter Kenway at the Sorby Centre for Electron Microscopy, University of Sheffield, and the Manchester Materials Science Centre, University of Manchester, respectively, for their patience and tutoring of electron microscopy. This work was partly funded as part of the Engineering and Physical Science Research Council (EPSRC) portfolio award, GR/S60037/01 within the
Ceramics and Composites Laboratory,
Engineering Materials, University of Shef-field.
References
Bagshaw, H., Iddles, D., Quimby, R. & Reaney, I. M. (2003).J. Eur. Ceram. Soc.23, 2435–2441. Ball, C. J., Begg, B. D., Cookson, D. J., Thorogood,
G. J. & Vance, E. R. (1998).J. Solid State Chem.
139, 238–247.
Glazer, A. M. (1972).Acta Cryst.B28, 3384–3392. Glazer, A. M. (1975).Acta Cryst.A31, 756–762. Glazer, A. M., Roleder, K. & Dec, J. (1993).Acta
Cryst.B49, 846–852.
Goldschmidt, V. M. (1926).Geochemische vertei-lungsgesetze der elemente, I Mater. Naturvid. Kl. no 2. Oslo: Skrifter Norske Videskaps–Akad. Howard, C. J., Knight, K. S., Kennedy, B. J. & Kisi,
E. H. (2000). J. Phys. Condens. Matter, 12, L677–L683.
Howard, C. J. & Stokes, H. T. (1998).Acta Cryst. B54, 782–789.
Howard, C. J. & Stokes, H. T. (2002).Acta Cryst. B58, 565.
Jacobson, A. J., Collins, B. M. & Fender, B. E. F. (1976).Acta Cryst.B32, 1083–1087.
Jones, G. O. & Thomas, P. A. (2000).Acta Cryst. B56, 426–430.
Jones, G. O. & Thomas, P. A. (2002).Acta Cryst. B58, 168–178.
Knudsen, J. (2002). Thesis. University of Sheffield. Knudsen, J., Woodward, D. I. & Reaney, I. M.
(2003).J. Mater. Res.18, 262–271.
Leinenweber, K. & Parise, J. (1995).J. Solid State Chem.114, 277–281.
Lufaso, M. W. & Woodward, P. M. (2001). Acta Cryst.B57, 725–738.
O’Keeffe, M. & Hyde, B. G. (1977).Acta Cryst. B33, 3802–3813.
[image:14.610.64.345.286.700.2]Noheda, B., Gonzalo, J. A., Cross, L. E., Guo, R., Park, S.-E., Cox, D. E. & Shirane, G. (2000). Phys. Rev. B,61, 8687–8695.
Figure 12
Propach, V. (1977).Z. Anorg. Allg. Chem.435, 161–171.
Ranjan, R., Pandey, D., Siruguri, V., Krishna, P. S. R. & Paranjpe, S. K. (1999).J. Phys. Condens. Matter,11, 2233–2246.
Reaney, I. M. (1996). Proc. Electroceramics V, Portugal, pp. 441– 446.
Reaney, I. M., Colla, E. L. & Setter, N. (1994).Jpn. J. Appl. Phys.33, 3984–3990.
Reaney, I. M., Glazounov, A., Chu, F., Bell, A. & Setter, N. (1997). Brit. Ceram. Trans.96, 217–224.
Woodward, P. M. (1997a).Acta Cryst.B53, 32–43. Woodward, P. M. (1997b).J. Appl. Cryst.30, 206–207. Woodward, P. M. (1997c).Acta Cryst.B53, 44–66.
Woodward, D. I., Reaney, I. M., Eitel, R. E. & Randall, C. A. (2003). J. Appl. Phys.94, 3313–3318.
Wul, B. M. & Goldman, I. M. (1945).Comput. R. Acad. Sci. USSR,46, 139–142.
Zhao, Y., Weidner, D. J., Parise, J. B. & Cox, D. E. (1993).Phys. Earth Planet. Inter.76, 17–34.
![Figure 9Diffraction patterns obtained from PbZrO3 sample with zone axes chosen as (a) [001], (b) [100], (c)[101], (d) [110], (e) [111] and (�f) [111]](https://thumb-us.123doks.com/thumbv2/123dok_us/9779650.479047/11.610.46.373.94.206/figure-diffraction-patterns-obtained-pbzro-sample-zone-chosen.webp)