Towards an effective layout design and improved inbound
logistics via Direct Line Feed
- Public version -
Document
Type
Master thesisTitle
Towards an effective layout design and improvedinbound logistics via Direct Line Feed
Keywords
Direct Line Feed, inbound logistics, layout redesign, logistic cost evaluation, process improvementDate colloquium
22-12-2016Author
A.J. (Alexander) de Graaffs1016644
a.j.degraaff@student.utwente.nl sander.degraaff@heineken.com degraaff.aj@gmail.com
Educational
Institution
University of TwenteThe Netherlands
Faculty
School of Behavioural, Management and Socialsciences
Program
Industrial Engineering & ManagementSpecialization: Production & Logistics Management
Committee
University of Twente
Dr. P.C. (Peter) SchuurUniversity of Twente, Ravelijn 3422 P.C.Schuur@utwente.nl
Dr. ir. S. (Sipke) Hoekstra
University of Twente, Horstring W264 S.Hoekstra@utwente.nl
HEINEKEN
J.P. (Johan) van de Bor MScSenior Project Leader CS&L
Management Summary
The research was conducted at the headquarters of HEINEKEN Netherlands established in Zoeterwoude, which is also the largest brewery of HEINEKEN worldwide. The research consists of two consecutive researches (i.e., phases), both concerning the inbound supply to the packaging lines. Research phase I – Logistical organization and layout redesign of th e Foleyplein
Problem description and research objective
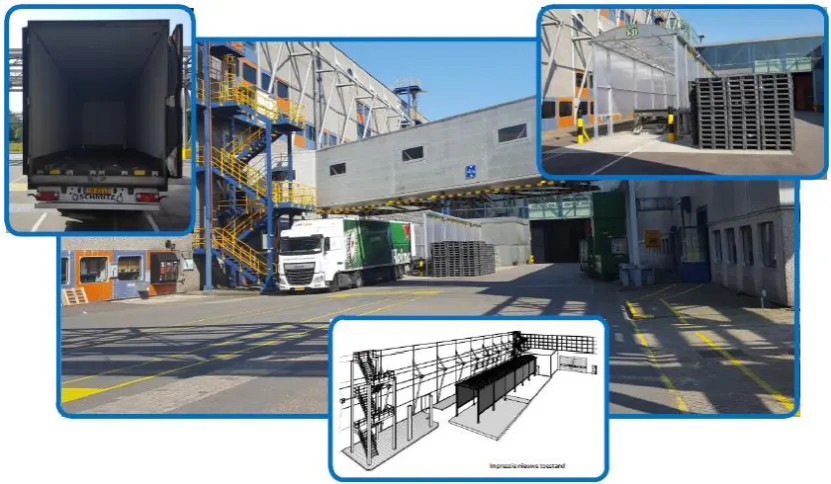
HEINEKEN has decided to build a new packaging line (line 52) that will serve the export markets. This means that it will produce one-way bottles (i.e., non-returnable bottles), which need to be supplied from several bottle plants to the brewery. The empty bottle supply to line 52 will occur via the Foleyplein, which is the square that is also used for the supply to the existing packaging lines 51 (bottles supplied via DLF) and 6 (cans supplied via conventional). The specific supply method for line 52 however is yet unknown. Meanwhile the amount of space on this square is limited. Therefore there is reasonable doubt whether, with the introduction of line 52, it is still possible to supply line 6 on the Foleyplein as is carried out in the current situation.
Central research question A
The research objective of phase I is to determine the most cost effective way to supply the packaging lines 52 (bottles) and 6 (cans) on the Foleyplein, while solving the limitation problem on the Foleyplein. The supply method for packaging line 51 will remain unchanged. The research question is defined as follows:
“What is the most cost effective layout design and logistical way to organize the supply of bottles and cans for the packaging lines 52 and 6?”
Results and conclusions
Several feasible alternatives are developed for the supply to line 52 (3 options) and line 6 (4 options). Bottle line 52:
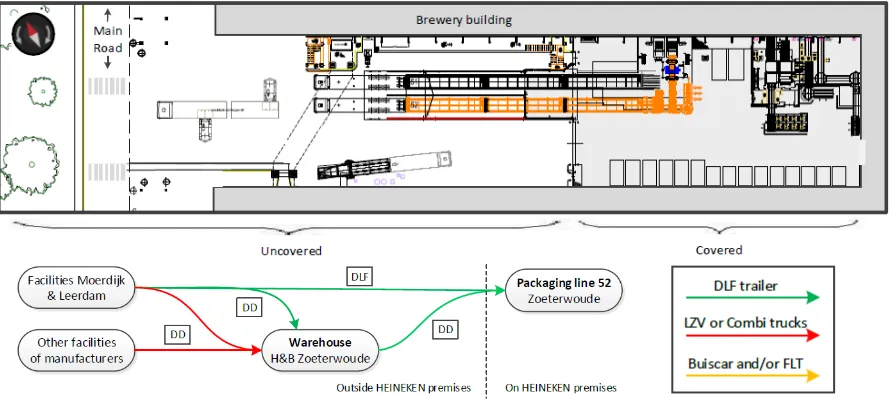
Direct Line Feed (DLF) and Direct Docking (DD): The bottles are supplied by smaller trucks (26 pallets) and unloaded directly on the buffer conveyor of the packaging line. In this way no handling and storage on the brewery is needed. A part of the supply is carried out via the warehouse of the logistics service (i.e., Direct Docking), which is also the location where the safety stock is held. Conventional: The bottles are supplied by large trucks (42 or 30 pallets) and then unloaded and
stored on a storage square, till a buiscar (internal transport mode) transports them to the packaging line. The conventional method is divided in two different options (A and B), which are the same till the moment they are transported internally (from the storage location to the Foleyplein) by buiscars. In option A the pallets are transferred from the buiscar to the packaging line by forklift trucks (FLT). In option B the buiscar is docked against the packing line and unloaded directly. Can line 6:
Direct Docking (DD): Similar method as for line 52, but completely supplied via the warehouse. Conventional: The cans are supplied by large trucks (42 or 30 pallets) and then unloaded and stored
After the development of the alternatives, we evaluated the alternatives based on several quantitative (OPEX and CAPEX) and qualitative (e.g., safety) criteria to determine the preferred layout design and logistical organization.
We have concluded that, for the supply of packaging line 52 (bottles), the ‘DLF’ alternative is preferred. The ‘DLF’ alternative scored (much) better on the non-financial criteria. Considering the financial criteria, the difference in CAPEX is earned back within a reasonable time period (less than two years) as the OPEX are (much) lower.
For packaging line 6 (cans) we concluded that the ‘conventional B’ option is the preferred alternative. It is chosen over ‘conventional A’, since ‘conventional B’ scores better on the non-financial criteria, while the financials are equal. While both the ‘DLF’ and ‘conventional C’ alternative are (slightly) preferred on the non-financial criteria, they require a significant (i.e., too high) investment.
Recommendations
The main recommendations of phase I are (1) to supply line 52 via the DLF method and line 6 via the ‘conventional B’ method and (2) to design the Foleyplein as prescribed by these alternatives, with the required constructions and taking into account the required safety measures on the Foleyplein. Research phase II – Improving the supply process via the Direct Line Feed method
Problem description and research objective
With the introduction of packaging line 52 (supplied via DLF) the total amount of packaging lines supplied via DLF will become 5 (lines 51, 52, 7, 81 and 82) in 2017. During phase I of this research some inefficiencies in the current DLF process have been encountered, which has given rise to phase II.
Central research questions B
The research objective of phase II is to develop an improvement plan for a more efficient process regarding the supply of empty bottles to the packaging lines via the DLF method, which reduces the cost associated with the process. The research question is defined as follows:
“How is the current DLF process organized and in what ways could the process be improved to organize the inbound supply of empty bottles via the DLF method more efficiently?”
Results and conclusions
We have developed an understanding of the DLF process, revealed several improvement opportunities that would reduce the costs associated with the process, estimated their benefit-effort ratio and selected only the most promising improvements (see RACI on next page).
Most of the improvement opportunities aim to improve the DLF performance and reduce the associated warehousing costs. The DLF performance is the percentage of the supply volume that has been supplied directly and hence did not need to use the intermediate warehouse. Savings related to the DLF performance could be obtained by:
Improving the match between the production volume of DLF lines and the supply volume from the DLF location (opportunities 1, 3a and 3b (and 10b). Data suggests that this mismatch causes more than €X additional warehousing costs per year.
Improving the match between the DLF supply and the DLF needs of the packaging lines during the week, by reducing the occurrences in which planned DLF trailers are forced to deviate to the warehouse (opportunities 8b, 9 and 10b). Data suggests that this mismatch causes more than €X additional warehousing costs per year.
These costs would probably increase even more with the additional DLF supply volume of line 52.
The other improvements are related to the DLF process, but do not add to the DLF performance. They would improve the process and/or reduce the costs associated with the process by developing enhanced procedures, using the trailers more efficiently and increasing the focus on the DLF performance (opportunities 5, 8a, 8b and 10b).
Recommendations
The recommendations of phase II are summarized in a RACI, which shows the selected improvement opportunities and the associated responsibilities for further development and implementation.
While all improvement opportunities could be carried out at the same time and while they need to be carried out by several stakeholders, we have provided a suggestion for the implementation priority.
Prioritization for implementation: 1 2 3 4 5 6 7 8
Preface
Dear reader,
This document is the result of the graduation research that I have conducted at HEINEKEN Netherlands for the completion of my Master Industrial Engineering and Management (IE&M) at the University of Twente. Within IE&M I followed the specialization of Production and Logistics Management, which has provided a solid foundation of knowledge related to Supply Chain Management and logistics. To get acquainted with the real world of Supply Chain, I was eager to perform my graduation research in a large FMCG organization. I am very thankful for the opportunity and experience provided by HEINEKEN.
During this research I was part of the project leaders’ team of the Customer Service and Logistics department, who enabled me to conduct the two consecutive researches. I would like to thank my supervisor Johan van de Bor, team manager Pieter van Kooten and team member Merel van Engelshoven for the opportunity, the experience, the guidance and support throughout the research. Additionally, I would like to thank all the stakeholders and other staff members that supported me during the research and freed up time to provide me with the required help and information. I really enjoyed working with all the (many) stakeholders that were involved in the research.
Lastly, I would like to thank Peter Schuur and Sipke Hoekstra for their advice and support, but also for the flexibility that enabled me to conduct my graduation research the way I have done.
I wish you much pleasure in reading my master’s thesis. If there are any further questions, please feel free to contact me.
Concept explanations
Direct Line Feed (DLF) methodology: In the DLF methodology the empty bottles are supplied by
smaller trucks (26 pallets), which are automatically loaded at the manufacturer and unloaded directly on the buffer conveyor of a packaging line. In this technique the trailer as well as the buffer conveyors of a packaging line (and at the manufacturer) consist of roller conveyors, which facilitates that the trailer can be loaded and unloaded without any handling. When the truck driver docks his trailer directly against the buffer conveyor and turns on the switch, the pallets will roll out automatically.
DLF locations: Bottle manufacturing facilities that support the DLF method. Which means that they are
in relative close range of HEINEKEN and possess a loading conveyor. Moerdijk is the only DLF location in the original situation, but Leerdam has been added in week 20 of 2016.
DLF percentage: The percentage of supply volume that have been supplied via the DLF method, i.e.,
which has been transported directly and did not need to use the intermediate warehouse, relative to the total supply of empty bottles to that packaging line.
DLF volume: The bottle volume that could be supplied via DLF. In other words the joined production
volume of the DLF locations that is processes on all (or a particular) DLF line(s).
Direct Docking (DD): When the transportation of empty bottles is not carried out directly from the
supplier to the packaging lines (i.e., via DLF), but via the intermediate warehouse of Hartog & Bikker in Zoeterwoude, this transportation at HEINEKEN is called Direct Docking (DD). In this case the empty bottles are initially transported by combi’s or LZV’s (30 - 42 pallets) to the intermediate warehouse, where these larger trucks are unloaded by FLT’s and the pallets are stored in the warehouse. When the bottles are needed at the packaging lines the FLT’s place these pallets on the loading conveyor, next one of the ‘shuttle trailers’ is automatically loaded and subsequently the trailer will transport the bottles to the packaging line where it will dock against the buffer conveyor as is done in the DLF methodology.
Logistic services (i.e., 3PL): We use this concept for the organizations that are responsible for the
transport and intermediate storage of the empty bottles and cans, which is mainly Hartog & Bikker.
Manufacturers or suppliers: We use the concepts of manufacturers and suppliers interchangeably for
the organizations that produce the empty bottles and cans.
One-way bottles: One-way bottles are those bottles that do not contain a deposit and are meant to
be thrown away after the usage by the customer.
One-way botte lines: One-way bottles lines are those lines that produce one-way bottles, mainly for
the export markets. The difference with the returnable bottle lines lies in the fact that the returnable bottles lines are supplied by crates filled with returnable bottles, while one-way bottle lines need to be supplied by new empty bottles continuously.
Returnable bottles: Returnable bottles are those bottles that HEINEKEN would like to receive back
Abbreviations
3PL - Third-Party Logistics
AS - Advanced Scheduling (software program) BPO - Business Process Optimization
CAPEX - Capital Expenditures
CM - LS - Contract Manager Logistic Services CM - PM - Contract Manager Packaging Materials CSE - Customer Service Export (department) CSD - Customer Service Domestic (department) DB - Den Bosch (brewery location)
DD - Direct Docking
DLF - Direct Line Feed
FLT - Forklift Truck
FTE - Full Time Equivalent
H&B - Hartog & Bikker (Logistics services / 3PL organization)) HGP - Heineken Global Procurement
HNL - Heineken Nederland
HNS - Heineken Nederland Supply KPI - Key Performance Indicator
LD - Leerdam (DLF-location)
LS - Logistic Support (department) LZV - Longer and Heavier Vehicles MES - Manufacturing Execution System MD - Moerdijk (DLF-location)
MTO - Make To Order
MTS - Make To Stock
OPEX - Operating Expenses
OPI - Operational Performance Indicator OS - Operations Scheduling (department)
PO - Purchase Order
PLUTO - Database of SAP
SAP - Systems, Applications and Products (ERP system of HEINEKEN) SIPOC - Supplier-Input-Process-Output-Customer (model/method) SSCP - Strategic Supply Chain Planning (department)
TPM - Total Productive Management
TSCP - Tactical Supply Chain Planning (department) WMS - Warehouse Management System
List of figures
Figure 1-1: Layout of the packaging lines at the brewery in Zoeterwoude ... 3
Figure 1-2: Overview of the Foleyplein (version I) ... 4
Figure 1-3: Integral logistic concept (Visser & van Goor, 2011) [modified] ... 8
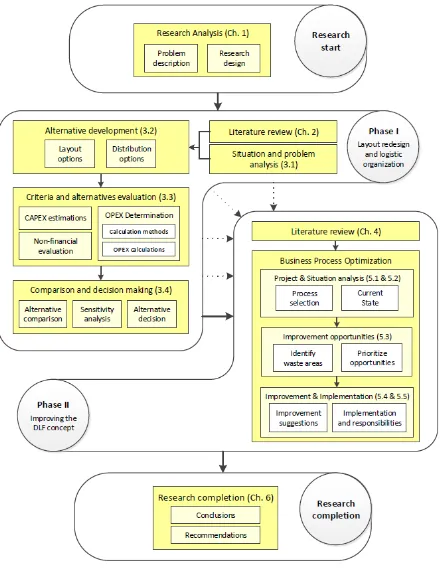
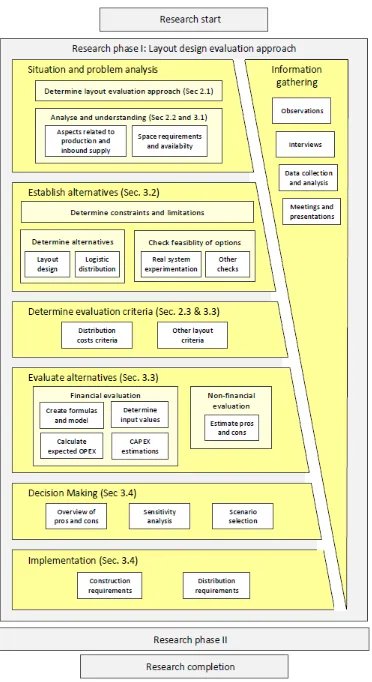
Figure 1-4: Complete research overview ... 9
Figure 2-1: General problem-solving model (Hicks, 2004) [modified] ... 13
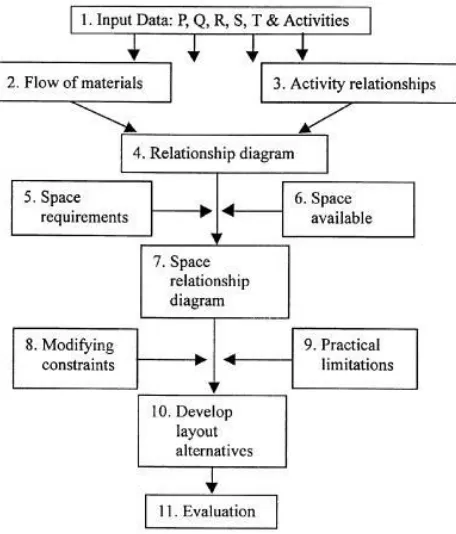
Figure 2-2: Systematic Layout Planning approach [from R. Muther, figure from Yang et al. (2000)]... 14
Figure 2-3: Ways in which a system can be studied (Law, 2007) [modified] ... 15
Figure 2-4: Layout design and distribution costs evaluation approach of phase I ... 18
Figure 3-1: Brewery overview of HEINEKEN Zoeterwoude ... 25
Figure 3-2: Origin of production volume of the new one-way bottle line 52 ... 26
Figure 3-3: Logistic network of inbound supply via conventional ... 27
Figure 3-4: DLF method for line 51 on Foleyplein ... 28
Figure 3-5: Logistic network of inbound supply via DLF and DD ... 29
Figure 3-6: Overview of the Foleyplein (version II) ... 30
Figure 3-7: Layout design and logistic network in the option that line 52 is supplied via DLF ... 34
Figure 3-8: Layout designs options and the logistic network when line 52 is supplied conventionally 35 Figure 3-9: Layout design and logistic network in the option that line 6 is supplied via DD ... 36
Figure 3-10: Layout designs and the logistic network when line 6 is supplied conventionally ... 37
Figure 3-11: Experimental situations on the Foleyplein [A]: line 52 via DLF and line 6 via conventional with original position [B] line 52 via DLF alternative and line 6 conventional B alternative ... 39
Figure 3-12: Overview of the variables, parameters and indices employed in the calculation model . 41 Figure 3-13: Formulas for the expected transportation costs of all alternatives for line 52 ... 43
Figure 3-14: Formula for the FTE costs for both line 52 and line 6 in case of supply via conventional 44 Figure 3-15: Formula for the expected H&B costs of line 52 in case of supply alternative via DLF ... 44
Figure 3-16: Formula for the additional transportation costs... 45
Figure 3-17: Sensitivity analysis on the DLF performance ... 52
Figure 4-1: Business Process Optimization approach of HEINEKEN ... 57
Figure 4-2: SIPOC tool (Symbol, 2014b) [Modified] ... 57
Figure 4-3: Areas of improvement opportunities (HEINEKEN, 2014; Symbol, 2014b; Visser & van Goor, 2011) [modified] ... 59
Figure 5-1: Overview of supply flows for all one-way packaging lines in the new situation ... 61
Figure 5-2: SIPOC concerning the supply of empty bottle to the DLF lines ... 63
Figure 5-3: Current State concerning the supply of empty bottles to the DLF lines ... 65
Figure 5-4: Improvement opportunities identification meeting. ... 69
Figure 5-5: Meeting concerning the prioritization of the improvement opportunities. ... 71
Figure 5-6: Benefit versus effort matrix concerning the improvement opportunities ... 71
Figure 5-7: Procedure of obtaining the material plan ... 73
Figure 5-8: RACI for the improvement of the DLF concept ... 78
Figure 6-1: Overview of the preferred layout design of the Foleyplein and logistic organization of the supply to line 52 and 6 ... 87
List of tables
Table 2-1: Overview of quantitative and qualitative criteria taken into account in this research ... 23
Table 3-1: Developed alternatives for the supply of line 52 and line 6 ... 34
Table 3-2: Estimation of the different aspect relevant to the loading capacity at the DLF locations ... 39
Table 3-3: Initial investments for the different alternatives ... 40
Table 3-4: [A] Estimation of the bottle division for line 52 and [B] the restrictions that follows for the DLF performance ... 43
Table 3-5: Shuttle price per bottle pallet for transport from warehouse to the packaging lines ... 44
Table 3-6: Shuttle price per can pallet for transport from warehouse to packaging line 6 ... 46
Table 3-7: Overview of the logistic costs for the different alternatives for the supply of line 52 ... 46
Table 3-8: Calculations of the additional transportation costs for line 6 in case of DD supply ... 47
Table 3-9: Calculations of the FTE costs for line 6 in case of conventional supply ... 47
Table 3-10: Non-financial evaluation scores ... 47
Table 3-11: Scores of the alternatives on the criteria safe and comfortable working environment .... 48
Table 3-12: Scores of the alternatives on the criteria efficient layout utilization ... 48
Table 3-13: Scores of the alternatives on the criteria supply chain complexity and flexibility ... 48
Table 3-14: Logistic costs evaluation overview for line 52 ... 49
Table 3-15: Logistic costs evaluation overview for line 6 ... 50
Table 3-16: Non-financial evaluation overview for the joined scenarios of line 52 and 6 ... 50
Table 3-17: Data checks for assumptions [A]: OPI performance [B] Material handling inefficiency .... 51
Table 3-18: Trailer capacity estimation for DLF supply to all DLF lines of Zoeterwoude ... 53
Table 5-1: DLF performance overview (week 1-20 and 21-27 in 2016) ... 62
Table 5-2: Production data of packaging lines Zoeterwoude of 2015 ... 76
Table 5-3: Bottle division between the breweries in 2015) ... 76
Table 5-4: DLF performance overviews ... 77
Table 5-5: Prioritization for implementation ... 80
Table 5-6: Production and allocation data of 2015 and 2016 supporting the addition of the DLF locations ... 82
Table 6-1: Summary of the evaluation results for the alternatives of line 52 and 6 ... 86
Table 6-2: Overview of the current DLF performance and associated costs ... 88
Contents
Management Summary ... iv
Preface ... vii
Concept explanations ... viii
Abbreviations ... ix
List of figures ... x
List of tables ... xi
1. Research introduction ... 2
1.1 Company information ... 2
1.2 Problem description ... 3
1.3 Research scope ... 5
1.4. Research objectives and deliverables ... 5
1.5 Research questions... 6
1.6 Methodology ... 7
1.7 Project structure ... 8
2. Literature study of phase I ... 12
2.1 Layout design problem and approach ... 12
2.1.1 Introduction ... 12
2.1.2 General problem-solving model ... 12
2.1.3 Systematic Layout Planning ... 13
2.1.4 Experimenting with the system ... 15
2.1.5 Layout design and distribution costs evaluation approach ... 17
2.2 Distribution logistics ... 19
2.2.1 Introduction ... 19
2.2.2 Distribution strategies ... 19
2.2.3 Third-Party Logistics (3PL) ... 19
2.2.4 Direct Line Feed (DLF)... 19
2.3 Quantitative and qualitative evaluation criteria ... 20
3. Research of phase I... 25
3.1 Situation and problem analysis ... 25
3.1.1 Motivation for the introduction of packaging line 52 ... 26
3.1.2 Inbound supply methods currently employed at Heineken ... 26
3.1.3 Space limitation problem on the Foleyplein ... 29
3.2 Development of alternatives ... 32
3.2.2 Layout redesign and logistic network alternatives... 33
3.2.3 Feasibility checks of developed alternatives ... 37
3.3 Evaluation of the alternatives ... 40
3.3.1 CAPEX estimations for line 52 and line 6 ... 40
3.3.2 OPEX calculations for the different alternatives of line 52 ... 40
3.3.3 OPEX calculations for the different alternatives of line 6 ... 45
3.3.4 OPEX results for alternatives of line 52 and 6 ... 46
3.3.5 Qualitative Layout design criteria evaluation... 47
3.4 Alternative comparison and decision making ... 49
3.4.1 Alternative overview and selection ... 49
3.4.2 Sensitivity analysis ... 51
3.4.3 Implementation requirements ... 53
4. Literature study of phase II ... 56
4.1 Improvement theories ... 56
4.2 Business Process Optimisation approach ... 57
5. Research of phase II... 61
5.1 Process selection ... 61
5.2 Current process of DLF concept ... 64
5.3 Improvement opportunities ... 69
5.3.1 Identify the improvement opportunities ... 69
5.3.2 Prioritizing the improvement opportunities ... 70
5.4 Process improvements and implementation ... 72
5.4.1 Process improvements and responsibilities ... 72
5.4.2 Data review supporting the improvement suggestions ... 75
5.4.3 Implementation overview ... 78
5.5 Additional improvement and further research suggestions ... 81
6. Conclusion and Recommendations ... 86
6.1 Conclusions and recommendations of phase I... 86
6.2 Conclusions and recommendations of phase II ... 87
6.3 Discussion and suggestions for further research ... 90
Bibliography ... 92
Appendix A: Background information related to the situation at HEINEKEN and the brewery of Zoeterwoude ... 96
Appendix B: Background information related to the literature study ... 105
Research Introduction
1.
Research introduction
In the framework of completing my Masters Industrial Engineering & Management at the University of Twente, I conducted my graduation research at HEINEKEN Netherlands. During this research I was part of the project leaders’ team, where my research, separated in two different phases, focused on the inbound supply of empty bottle and cans to the packaging lines of Zoeterwoude. Direct Line Feed (DLF) is one of the supply methods and is a central concept in our research. The first phase focusses on the most preferred layout design and logistical organization of the Foleyplein to supply packaging lines 51, 52 (bottles) and 6 (cans). The second phase focusses on the bottle packaging lines that are supplied via Direct Line Feed (DLF), where we assess if the DLF process is carried out efficiently and which improvement opportunities could be identified to improve this process.
This first chapter contains the introduction to the project in which we discuss the motivation and structure. It starts with some required information about HEINEKEN in section 1.1. Thereafter in section 1.2 and 1.3 we explain the problem and discuss the problem statement and the scope of the research. In section 1.4 and 1.5 we discuss the objectives, deliverables and the research questions. In section 1.6 and 1.7 we elaborate on the methodology that has been applied and present an overview of the project and thesis structure.
1.1 Company information
In this first section a brief description of the company is given. More detailed background information is provided in appendix A.1.
HEINEKEN
HEINEKEN is established in 1864 and has expanded and acquired multiple companies over the years to become the international brewer it currently is, with brands like Heineken, Amstel, Desperados and Wieckse (HEINEKEN, 2016a). With a portfolio of 250 beers and ciders sold in 178 countries, HEINEKEN is the number one brewer in Europe and the second brewer by volume in the world (HEINEKEN, 2016c). HEINEKEN Netherlands (HNL) consists of three breweries in Zoeterwoude, ‘s Hertogenbosch and Wijlre and a soft drink company Vrumona in Bunnik. Heineken Netherlands Supply (HNS) is part of HNL where about 1300 employees are responsible for the production and distribution of the beers and ciders that are brewed in the Netherlands for the domestic and export markets. Approximately 17.5 million hectolitre is produced by HNS in three breweries on more than 30 production lines, which is approximately 14% of the total production of Heineken worldwide. About 30% from this is designated for the Dutch market, approximately one third is exported to the United States and the rest is exported to more than 150 countries worldwide.
Brewery in Zoeterwoude
This research is conducted at the brewery in Zoeterwoude, which contains 14 packaging lines for 5 different types of products based on their primary packaging (e.g., bottles or cans), see Figure 1-1. Lines 11, 12, 21, 22, 3, 51, 81 and 82 produce bottles, line 6 produces cans, lines 41, 42 produce draught kegs, line 43 produces air kegs and line 9 produces returnable kegs.
to serve the different markets with one-way bottles or returnable bottles is mainly a result of the difference in distance of domestic versus export markets.
Figure 1-1: Layout of the packaging lines at the brewery in Zoeterwoude (van Kooten, 2016) [modified]
1.2 Problem description
The brewery in Zoeterwoude will need to increase the one-way bottle capacity (see appendix A.2 for the underlying reasons). This will be resolved by an additional packaging line named ‘line 52’, which will be build alongside the existing packaging line 51 throughout the entire brewery. Packaging line 52 will mainly absorb some of the production volume of the other one-way bottles lines, as explained in section 3.1.1 in further detail, which means that the overall production volume of Zoeterwoude will not increase too much initially.
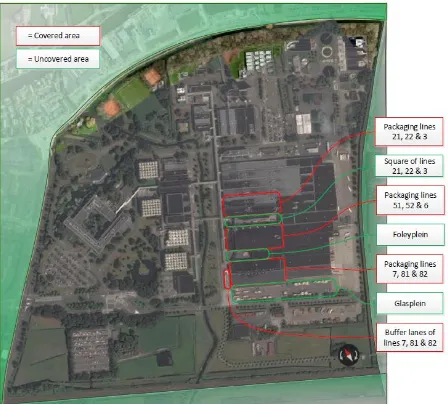
The supply of empty bottles to line 52 will occur via the Foleyplein, which is the square via which also existing packaging lines 51 (bottles supplied via DLF) and 6 (cans supplied via conventional) are supplied. In this section a brief description of the current situation and the current layout design is given, see Figure 1-2. Section 3.1 shows the brewery overview and elaborates in further detail. The methods that HEINEKEN uses in the current situation to supply the bottles and cans to the existing one-way bottle and can lines can roughly be divided in two ways:
Conventional: In this method the empty bottles and cans are supplied in large trucks (30 to 42 pallets) and stored on the premises of the brewery till a forklift truck (FLT) will bring them to the required packaging lines.
Direct Line Feed (DLF): In this method the empty bottles and cans are supplied by smaller trucks (20 or 26 pallets), which are automatically loaded at the manufacturer and unloaded directly on the buffer conveyor of a packaging line. In this technique the trailer as well as the buffer conveyors consist of roller conveyors, which facilitates that the trailer can be loaded and unloaded without any handling. When the truck driver docks his trailer directly against the buffer conveyor and turns on the switch, the pallets will roll out automatically.
there is no other storage location needed. The supply to the can packing line 6 works in the conventional way. Hereby the truck is parked as shown in Figure 1-2, where it is unloaded by a FLT.
Figure 1-2: Overview of the Foleyplein (version I)
This FLT temporarily stores the pallets with empty cans on the assigned storage location, as also indicated in Figure 1-2, until packaging line 6 requires them. At that moment the FLT lifts the pallets with empty cans from the storage location and places them on one of the loading conveyors of line 6. We consider two problem situations in this research, which we aim resolve in two consecutive phases.
Problem situation of Part I
Packaging line 52 will be supplied via the Foleyplein. However, the specific supply method from the manufacturers to the packaging line is yet unknown, because it is unclear what the most preferred supply method would be. Besides that, the amount of space for the supply of bottles (line 51 and 52) and cans (line 6) via the Foleyplein is limited, as can be seen in Figure 1-2. Due to this space limitation the expectation is that the implementation of line 52, including the physical construction of a new conveyor, will have a direct impact on the supply method of line 6. The problem statement is defined as follows:
“A space limitation problem on the Foleyplein as a result of the introduction of packaging line 52 and a lack of clarity related to the preferred supply methods”
The primarily need for the research of phase I is to indicate what the possibilities are for the supply of bottles and cans via the Foleyplein to lines 52 and 6 to resolve the limitations problem. Additionally it needs to determine the pros and cons associated with these supply possibilities to facilitate a well-founded decision. The supply method for packaging lines 51 will remain unchanged.
Problem situation of Part II
One of the conclusion of phase I, is that the DLF method is the most preferred supply method for packaging line 52. In phase II the scope of the research shifts from the packaging lines on the Foleyplein (lines 51, 52 and 6) towards all packaging lines in Zoeterwoude that will be supplied via the DLF method (lines 51, 52, 7, 81, 82). During phase I of our research we have encountered some inefficiencies in this DLF process, which has given rise for the research of phase II. The problem statement is defined as:
This research of phase II needs to indicate how the current DLF process is organized and which improvement opportunities can be identified to resolve the challenges associated with the DLF method and organize the DLF process more efficiently.
1.3 Research scope
The scope of this research includes the required analyses to obtain the results and conclusions for the Central Research Questions (CRQ A and B).
Phase I includes the aspects required in the decision making process concerning the layout design of the Foleyplein and the inbound supply to the packaging lines 52 (bottles) and 6 (cans). Phase II focuses on the inbound supply of bottles via the DLF method to the one-way bottle lines
(line 51, 52, 7, 81 and 82). The assessed DLF process stretches from the production agreements with the manufacturers in the preceding year till the moment of unloading the pallets on the buffer lanes of the packaging lines.
The returnable bottle lines (11 and 12) and the keg lines (41, 42, 43 and 9) are completely left out of the research. In consultation with HEINEKEN some parts are specifically excluded from the research:
Spatial and logistical scenarios:
- Building an internal storage location for cans or bottles.
- Examine the supply techniques or methods of existing lines other than:
o In phase I: line 52 and 6
o In phase II: line 51, 52, 7, 81 and 82
Transportation:
- Employment of transportation companies other than Hartog & Bikker. - Consideration of other transportation vehicles than the usual.
- Negotiation with Hartog & Bikker about agreements and prices.
1.4. Research objectives and deliverables
This section discusses the research objectives and the deliverables of the research.
1.4.1 Research objectives
According to Visser & van Goor (2011) the common formulation of a general logistical objective consists of the improvement of the customer-service level, while decreasing the integrated costs. The authors suggest however that the objective should be focusing on either the improvement of the customer service level while maintaining the current integrated costs or decreasing the integrated costs while maintaining the current customer service level. This project is conducted in accordance with the second option. Both parts of our research focus on an efficient approach to maintain the current performance and decrease the costs.
Phase I
Determine the most cost effective way to solve the limitation problem on the Foleyplein and to supply the packaging lines on the Foleyplein in a cost effective manner.
Phase II
1.4.2 Deliverables
In this section we describe the deliverables that need to be delivered to solve the earlier mentioned problem statements (section 1.2) and reach the objectives (section 1.4.1).
Phase I
An overview of the different feasible alternatives to supply packaging lines 52 and 6 via de Foleyplein.
An overview of the pros and cons associated with the alternatives. A well-founded choice for particular alternatives.
Phase II
A written and graphical process description of the current process.
An overview of the improvement opportunities and their estimated priority. An overview of the plan consisting of the improvement possibilities and the related
stakeholders responsible for the further development and/or the implementation.
1.5 Research questions
Since our research consists of two phases, we split our research by a bifocal research question, consisting of part A and B.
A. “What is the most cost effective layout design and logistical way to organize the supply of
bottles and cans for the packaging lines 52 and 6?
CRQ A focuses on the development of the most desired layout design and logistical organization on the Foleyplein for the supply of packaging lines 52 and 6. With most ‘cost effective way’ we mean the alternative that obtains the preference after the considerations of the relevant financial and non-financial criteria’s.
B. “How is the current DLF process organized and in what ways could the process be improved to
organize the inbound supply of empty bottles via the DLF method more efficiently?
CRQ B focuses on the development of a more efficient process for the supply of bottles to the packaging lines supplied via the DLF method. First we need to determine how the current process is organized and next which improvements opportunities can be identified to organize the process more efficiently. By ‘more efficiently’ we mean, the organization of the process in a more transparent and more effective way, while reducing the associated costs.
Sub questions supporting CRQ A
The following sub questions are composed to support the CRQ A: 1) What is the ‘current’ situation at HEINEKEN concerning:
a. The production characteristics of packaging line 52? b. The inbound supply methods currently employed? c. The space limitation problem on the Foleyplein?
2) What are the feasible alternatives for (a) the layout design and (b) the logistical organization of (1) the bottle packaging line 52 and (2) the can packaging line 6?
3) Which quantitative and qualitative criteria should be evaluated and how well do the alternatives perform on these criteria?
Sub questions supporting CRQ B
The following sub questions are composed to support the CRQ B:
1) How is the current DLF process organized and which stakeholders are involved?
2) Which improvement opportunities can be identified in the current process and which should be included in the research based on their priority?
3) How should the process be improved and who should be made responsible for the further development and implementation of the improvement opportunities?
1.6 Methodology
In this section we describe the methodology that is used in this research, which consists of multiple elements throughout the project.
Observations, consultations and presentations
According to Hicks & Matthews (2010) a key barrier to successful process improvement is the resistance to change. Senior managers appear to be committed to improvement programs, while middle and junior management are less dedicated. If the members of the shop floor, who are to be the hands-on users of such process, do not understand the benefits to themselves or in general, the implementation is bound to falter (Hicks & Matthews, 2010). The authors conclude that most of the barriers arise from either a lack of understanding, an inability to communicate understanding or an inability to generate the necessary understanding.
With these statements in mind, the stakeholders of the relevant departments are involved as much as conveniently possible by asking their opinions, estimations and concerns. The aim is to create a shared understanding and enable the stakeholders to express their beliefs via interviews and several meetings. We had interviews and meetings with all significant stakeholders during the research to get a good understanding of the (problem) situation at HEINEKEN, to ensure that we gathered all significant information and to enlighten and inform the different stakeholders of the progress of the project. At the end of each research phase a plenary presentation is held at HEINEKEN to presenting the findings and recommendation.
Literature studies
The literature has been consulted throughout the project, with the focus on the project as a whole and subsequently on part I and II separately to gain insight in the methods and approaches to resolve both problem situations. The literature studies for phase I and II are explained in chapter 2 and 4.
Integral Logistic Concept
Figure 1-3: Integral logistic concept (Visser & van Goor, 2011) [modified]
In this research the integral logistical concept is used to structure the project, since it gives us a general understanding of our problem situations and provides a basis for the project as a whole. Besides that it is able to support both our research questions.
In the first chapter the research objectives and associated deliverables are discussed.
In phase I the main objective is to determine the most preferred physical construction and operating procedure. To achieve this several feasible alternatives are developed for the supply to line 52 (3 alternatives) and line 6 (4 alternatives). After that these alternatives are evaluated based on several quantitative (OPEX and CAPEX) and qualitative (e.g., safety) criteria to determine the most desired layout design and logistical organization.
In phase II the research continuous by focussing on the improvement of the process, related to the operating procedure, information systems and personnel structure. In phase II the aim is to understand how the current DLF process is organized, reveal the improvement opportunities in the process, prioritize the most important ones and develop an improvement plan for a more efficient process.
1.7 Project structure
Research Phase I
2.
Literature study of phase I
In this chapter we explain the literature that supports phase I of our research. In section 2.1 we pay attention to the layout design problem and the related tools and approaches for the development and evaluation of alternatives. In section 2.2 we briefly elaborate on the distribution logistics and relevant strategies. Finally in section 2.3 we discuss the quantitative and qualitative evaluation criteria relevant for our research. The theories supporting phase II are explained in chapter 4.
2.1 Layout design problem and approach
This section pays attention to the layout design problem and the related tools and approaches that have supported the development of the evaluation approach that we use in this research.
2.1.1 Introduction
According to Wiyaratn & Watanapa (2010) industrial factories need to increase their potential in production to compete against their market rivals, with an production process that has the ability to produce with low cost and high effectives. One way to facilitate this is an efficient plant layout, which reduces cost of manufacturing and increase the productivity. Furthermore it increases good workflow in production route (Wiyaratn & Watanapa, 2010).
Layout design problems focus on finding the most efficient arrangement of the facilities and equipment within the available floor area. According to Yang, Su, & Hsu (2000) the existing literature about layout design problems often fall into two categories: algorithmic and procedural approaches.
Algorithmic approaches usually simplify the design constraints and objective in order to reach an objective function from which a solution can be obtained. These approaches generally incorporate quantitative input data. Their solutions are easier to evaluate by comparing the objective values, however the outputs often need further modifications to satisfy detailed design requirements.
Procedural approaches on the other hand can combine qualitative and quantitative data in the design process. These approaches have divided the design process in several steps, which are solved subsequently till the objective has been reached (Yang et al., 2000).
We use a procedural approach as graphically shown in Figure 2-4.
2.1.2 General problem-solving model
No matter which approach is adopted in problem solving and decision making, the process generally runs through a number of the same steps (Hicks, 2004). While many variations in the required steps are suggested by the literature, the mains steps, shown in Figure 2-1, can be identified according to Hicks (2004) as follows:
It starts with the ‘the mess’, which should really be seen as a process step to prevents rushing in to conclusions. This step consists of the realization of the problem situation, creating order in the chaos and structure the project.
The second step is the ‘data gathering’ step, in which it is necessary to gather information as objective data (the who, what, where, when, why and how of the problem situation), subjective data (opinions, attitudes, feelings and beliefs), details of the constraints relevant for the situation and other information that seems relevant.
The problem-solving model continuous with the ‘problem identification’ step, which involves formulating the problem situation at the beginning and redefining it during the project. Then the ideation step, which consist of generating ideas about (alternative) solutions. The
The next step in the model is the ‘problem resolution’ step, in which the most promising ideas should gently be evaluated and developed. Rarely does it happen that an idea is completely suitable and are the merits obvious from the beginning. Most of the time the ideas need further development till we have several possible solutions. When we have determined the alternatives, the process continuous with evaluating them against appropriate criteria in order to select the best one(s) to implement.
The final step in the process is the implementation step, which is often a problem on its own. Often it is required to ‘sell’ the merits of the solution, gain acceptance and elicit the commitment necessary to implement it. The brilliance of a solution is rarely sufficient to guarantee its implementation.
Figure 2-1: General problem-solving model (Hicks, 2004) [modified]
Hicks (2004) suggests that it is useful to understand the main steps in general problem-solving, but in the meanwhile he points out that it is possible that some steps are skipped or run through in different order, that some steps need repetition or that some steps overlap each other. Furthermore he points out that organizational problem solving is often a group process and most of the time other groups have a stake in the solution. A decision is often not made by the problem-solving team (alone) and may be constrained by wider interactions and political considerations. Politics and the organizational culture will influence the problem solving process continuously, adds (new) constraints to the process and the solution and will have impact on the final decision making, which can result in a complex decision making process.
2.1.3 Systematic Layout Planning
Systematic Layout planning (SLP) approach, developed by Richard Muther, is suggested to be the most popular procedural layout design approach in practice. It is relatively straightforward, however it is a proven tool in providing layout design guidelines in practice (Yang et al., 2000) and is very useful when a new layout need to be designed or adjustment in the layout need to be made in a new or already existing area (Visser & van Goor, 2011). The SLP method is a step-by-step approach of plant design from input data and activities to the evaluation of the plant layout (Wiyaratn & Watanapa, 2010). The complete design process can be distinguished in 4 phases (Visser & van Goor, 2011):
Phase 1: Determining the location of the facility
Phase 4: Installing and arranging the selected layout
Figure 2-2 gives a graphical representation of the SLP procedure, which concerns the following steps (Visser & van Goor, 2011; Yang et al., 2000):
Step 1: The SLP procedure starts with the PQRST analysis for the overall production activities. It concerns the data collection and examining the following elements: (1) Product: which products need to be processed? (2) Quantity: in which quantity? (3) Routing: In what process and in which sequence of operations and handlings? (4) Supporting: with which supporting services and activities? (5) Time: with which timing and over which time horizon?
Step 2 - 4: In the ‘flow of materials analysis’ all movements and material flows that are involved in the process need to be analysed and visualized in a comprehensive way. In the ‘activity relationship’ step a qualitative analysis is performed to determine the closeness of relationship between the concerning departments. The ‘relationship diagram’ is then a graphic overview of the interaction and closeness of these relationships.
Step 5 - 7: In the ‘space requirements’ and ‘space available’ steps is the space needed, the space available and the amount of floor space to be allocated to each department determined. Subsequently the space relationship diagram adds the departmental size information to the relationship diagram from step 4.
Step 8 - 9: In the ‘modify constraints’ and ‘practical limitations’ step the situations that give reason for change and the additional design constraints and practical limitations are determined.
Step 10: In de ‘develop layout alternatives’ the design candidates are created. According to Yang et al. (2000) the success of a procedural approach implementation depends to a great extent on the generation of quality design alternatives that are often from the outputs of an experienced designer. The inputs from area experts during the design process are thus considered to be a must toward an effective layout design.
[image:28.595.183.411.470.737.2]Step 11: In the evolution phase the different design candidates are evaluated and the final design is chosen. The evaluation of layout alternatives is difficult, since it includes multiple quantitative and
qualitative objectives and many of those objectives are subjective in nature. Careful consideration of the objectives and criteria is required. A detailed layout of the facilities and the equipment follows from this final step.
The Systematic Layout Planning (SLP) approach is a very popular and straightforward tool for a layout design problem. For our research project the SLP approach is useful to generate our own layout design approach, explained in section 2.1.5. However we do not apply every step. According to Visser & van Goor (2011) there are 4 types of production flows: divergent flows, parallel flows, series flows and convergent flows. The flow of material within the narrow scope of our research can be identified by a parallel material flow, which means that the flows run parallel without any relationships between the different material streams. In these flows the operations that are carried out are most of the time the same, but on different kind of products. The only existing relations between these flows are related to the employees and the resources (Visser & van Goor, 2011). This is also the case in our research. The equipment and flows that need to be build and organized in our project do not interact with each other. The only relationships that can be found are related to the employees and the handling equipment. Consequently not every detail of step 2 till 7 is completely relevant for our research and therefore not every detail of this approach is used in our own approach (see section 2.1.5).
2.1.4 Experimenting with the system
A system can be defined as a collection of entities (e.g., people and machines) that act and interact together toward the accomplishment of some logical end. During the existence of these system there is often the need to study them to gain some insight into the relationships among various components or to predict the performance under some new conditions (Law, 2007). According to Law (2007) there are several ways in which a system might by studied, which are graphically shown in Figure 2-3. Studying the system in this context is not about just figuring out, exploring and understanding the system by interviews, data and observations, it is about experimenting with the system to gain the insights mentioned above. The ways of studying the system that we use in this research project are marked in yellow and explained below.
Figure 2-3: Ways in which a system can be studied (Law, 2007) [modified]
operate under the new circumstances if this is possible and cost-effective, because in that case there is no question about whether the study is valid. At the same time the author points out that it is rarely feasible to do this, because such an experiment would be too costly or too disruptive to the system. For that reason it is usually necessary to create a model. Using a model as representation of the system to study the actual system on the other hand, does always raise the question whether it accurately reflects the system for the purpose of the decisions made (Law, 2007). In our case we want to ‘study the system’, as meant by Law (2007) and explained previously, in both ways.
Experimenting with actual system
At some point of time in our research we want to know, which alternative scenarios can be obtained. For the distribution options this is done by examine the materials flows and the production capabilities at the different facilities (i.e., not done by experimenting with the system). For the layout options on the other hand this needs to be done by examining the spatial and material flow requirements and possibilities at the brewery and especially at the Foleyplein. The most important study related to the Foleyplein concerns the ways we can build and organize the equipment and materials flows on the Foleyplein, while maintaining the required safety levels. Since it is quite difficult to estimate if a particular option should be considered as a safe and pleasant working environment, it would be very helpful to study the possibilities in real life, i.e., with the actual system.
Experimenting with model of the system
As we can see in Figure 2-3, Law (2007) suggests that using a model to experiment with the system can be divided in using a physical model (e.g., pilot training) or a mathematical model. Physical models are usually not the type of models that are of interest in operations research, but mathematical models are. Mathematical models can be defined as models that represent a system in terms of logical and quantitative relationships that are manipulated and changed to see how the model reacts and thus how the system would react. These mathematical models are further divided in models that obtain an analytical and exact solution and models that use simulation. If the model is simple enough, it could be possible to work with the relationships and quantities to get an exact and analytical solution. Otherwise Law (2007) proposes the use of simulation, i.e., numerically exercising the model for the inputs in question to see how they affect the output measures of performance.
During the evaluation of our alternatives we want to study the distribution system to understand the relationships between the different cost elements and to easily compare the total distribution costs of the different scenarios. As stated by Lin & Sharp (1999b) it is often the case that data is only available after the operations start and that very detailed data is required from which no record has been kept. As is explained in section 3.1 in further detail, both situation are relevant in our research, since we want to obtain the distribution costs of a production line that does not exist yet and it is unclear which products will be produced in which quantity. Additionally the production is market driven, which means that the production plan will differ every week and every year depending on the market demand. This results in the fact that we need to work with the previous data that is available and use these data as basis for our forecast and distribution cost calculations. According to Hopp & Spearman (2008) there are three laws in forecasting: (1) forecasts are always wrong, (2) detailed forecasts are worse than aggregate forecasts and (3) the further in the future, the less reliable the forecast will be. Based on this, the use of a model that involves an exact solution does not seem really relevant in our research. However, what does seem relevant is the use a model to understand the relationships between cost elements, examine the impact of the input variables and assess the total distribution costs per scenario.
generating one or more solutions for the problem by the use of the representation formalism (3), a language that allows the representation of relevant aspects of the system and their relations (Keppens & Shen, 2001). The problem is explained in chapter 1 and section 3.1. The procedure and the representative model is explained in respectively section 2.1.5, section 3.3.2 and appendix C. According to Angerhofer & Angelides (2000) the process of business modelling comprises four phases. The first phase comprises the project definition and objective determination. The second phase involves the model conceptualisation in which we need to aggregate the information and relationships about the material flows and distribution in a coherent model. In the third phase the model is actually created and validated and in the last phase the scenario and sensitivity analysis are carried out and the knowledge is spread and used.
2.1.5 Layout design and distribution costs evaluation approach
Besides the most popular layout design approach, systematic layout planning, more plant layout and logistics costs evaluation approaches are suggested by the literature (L. C. Lin & Sharp, 1999a, 1999b; Voordijk, 2010; Zeng & Rossetti, 2003), which all have their differences in comparison to each other. The authors put emphasize on different aspects and use slightly different evolution criteria. However, in general we can distinguish a more generic approach from the literature that contains the most important steps for our decision making process.
2.2 Distribution logistics
In this section we briefly elaborate on the distribution logistics and strategies, which are helpful for understanding the current situation at HEINEKEN Zoeterwoude.
2.2.1 Introduction
Distribution logistics can be defined as that part of the supply chain process that plans, implements and controls the effective and efficient flow of goods, services and related information from the point of origin to the point of consumption in order to meet customer requirements (B. Lin, Collins, & Su, 2001; Shujuan & Xin, 2008). A typical logistic process in a manufacturing company consist of demand forecasting and planning, procurement, material handling, inventory management, warehousing, order processing and transportation (Shujuan & Xin, 2008). The goal in distribution logistics is to fulfil the requirements of the market and to build lasting relationships with the customer, while maintaining low costs and capital usage (Visser & van Goor, 2011).
2.2.2 Distribution strategies
When items are produced and ready to leave the manufacturer the next challenge is to distribute these items efficiently to the customer. According to Simchi-Levi, Kaminsky & Simchi-Levi (2008) there are two main options in distribution strategies. Items can either be shipped directly from the manufacturer to the customer or an organization can use one or more intermediate storage locations. When employing the direct shipment strategy, the supplier delivers goods directly from the production facilities of the manufacturer to the customer. In a traditional warehousing strategy the items are hold in stock in intermediate warehouses and provided to downstream customers when they needed. The most important incentives of using direct shipment according to Simchi-Levi et al. (2008) are that the downstream customer avoids the expenses of operating a storage centre and that the lead times can be reduced. On the other hand a downside is that the distribution of items often needs to be done with more and smaller trucks to more locations. For these reasons direct shipment is a common method when a downstream customer requires a full truckload of materials (Voordijk, 2010).
2.2.3 Third-Party Logistics (3PL)
To remain competitive companies have increasingly had to find efficiencies in all operations, to focus on core competencies and to outsource the functions that can be performed more efficiently by third-parties (Zacharia, Sanders, & Nix, 2011). According to these authors logistics has been identified as the function where significant cost savings and improved responsiveness can be obtained, which makes it attractive for outsourcing and results in the fact that 3PL organizations are nowadays engaged in (strategic) coordination of their customers supply chain activities. Initially is was about offering transportation services, while 3PL nowadays offer a broad and integrated set of services including warehousing, inventory management, packaging, cross docking and technology management (Zacharia et al., 2011). The most important benefits of outsourcing are the ability to focus on the core business, the shift from fixed to variable costs and lower operational risks (Visser & van Goor, 2011). A downside it the loss of control, which is inherent to outsourcing a particular function (Simchi-Levi et al., 2008). Appendix A.2 elaborates on the evaluation and (dis) advantages of 3PL in more detail.
2.2.4 Direct Line Feed (DLF)
line without the use of an intermediate storage. This is however not always the case. For multiple reasons the DLF approach needs a back-up storage location close to the premises (see section 3.1). Direct Line Feed is not a widespread subject in the literature. A common subject in the literature is cross docking, which is a logistic technique that seeks to reduce the inventory holding, order picking and transportation costs and the delivery time (Larbi, Alpan, Baptiste, & Penz, 2011). Supply chains using cross-docking are different from the supply chains using warehouses, since cross-docks offer no storage (Zeng & Rossetti, 2003). This seems similar to the DLF-technique that is used at HEINEKEN, however the cross docking process covers way more than just the logistic supply technique of DLF. Direct Line Feed is known for being the process of making sure that you get the supplies you need, when you need them. Suppliers effectively ‘feed’ the supplies to the production line in such a way that there is a constant supply of all components that are required. The process of Direct Line Feed is usually outsourced, which means that also the responsibility for the supply rest with the supplier. In these instances the supplier actually takes responsibility for the inventory control, electronically assessing how many items have been used by the use of an electronic data systems, which keeps the supplier constantly updated with regard to the number of items that need to be replenished. (Valuestreamguru, 2016). There are quite some benefits of using DLF for the inbound supply. Most importantly it can reduce the overall logistic costs. Supplies no longer have to be stored in great storages, since they are supplied almost constantly and the technique reduces staff time in handling the incoming supplies. Some other benefits that are mentioned are increased productivity, reduction of WIP, reduction of paperwork, clear responsibilities, simplified shop floor practice and removal of non-value added activities (Stag Group, 2016; Valuestreamguru, 2016). A few drawbacks that are mentioned is that the supply method can cause some reluctance of the staff and the fact that it takes a great deal of trust on the material providers and procurement teams to ensure that the right levels of materials are available at the right time.
2.3 Quantitative and qualitative evaluation criteria
In this section we elaborate on the criteria that are proposed by the literature and that we use in our research to evaluate the different alternative scenarios and to support decision making.
2.3.1 Introduction
While there exist many publications presenting successful implementations, Hicks & Matthews (2010) suggest that there are many initiatives that fail to meet the expectations and sometimes fail to deliver improvement at all. Furthermore they state that of those projects that do deliver many are short term. These projects not only require a high investment, but also incur an indirect cost which can be representing a magnitude of the cost and lost opportunity which far exceeds the cost of the original investment (Hicks & Matthews, 2010). As suggested in section 2.1 we are dealing with multiple quantitative and qualitative objectives, which are difficult to evaluate. Careful consideration of all the objectives and criteria is required to support decision making. Section 2.3.2 pays attention to the distribution logistic costs criteria that are relevant for our evaluation approach and section 2.3.3 focuses on the qualitative layout design criteria.
2.3.2 Quantitative logistic costs criteria
what principal activities are performed, what factors determine how long an activity takes and which costs are associated with these activities. Once this information is obtained, one can start mapping the operational expenses (Stapleton, Pati, Beach, & Julmanichoti, 2004).
Derived from all activities in an organization there are many criteria that need to be determined and evaluated to assess the layout alternatives to support a well-founded decision. Many suggestions for evaluation criteria are done by the literature (Kivinen & Lukka, 2004; B. Lin et al., 2001; L. C. Lin & Sharp, 1999a; L. C. Lin & Sharp, 1999b; Visser & van Goor, 2011; Voordijk, 2010; Zeng, 2002; Zeng & Rossetti, 2003). In the remainder of this section we present and explain the costs criteria that are suggested by these authors and are relevant for our research.
Initial investment costs
The first criterion is about the initial investment costs, which we can relate to the term Capital Expenses (CAPEX), which is the expression used at HEINEKEN. The initial investment costs can be defined as all upfront investments needed to enable a functioning production system (Wagner & Silveira-Camargos, 2011) and consist of all investment costs related to the land, buildings, production machinery and equipment and material handling equipment (Lin & Sharp, 1999b). Here, material handling equipment accounts for a great deal of the physical distribution costs in terms of capital expenses (Voordijk, 2010). According to Wagner & Silveira-Camargos (2011) the extent of the required investments varies according to the logistic complexity, the characteristics of the production site and even further to the capabilities of the supplier or the involved logistics service provider.
Transportation costs
Transportation costs are related to external movement of materials and products in the supply chain between manufacturers and their downstream customers, which generally operates both ways (Visser & van Goor, 2011). As discussed in section 2.2.2 and as suggested by Simchi-Levi et al. (2008) and Voordijk (2010) we can distinguish three main routes in transportation. In the direct shipment strategy the supplier delivers the goods directly from the production facilities of the manufacturer to the downstream customer. In the traditional warehousing strategy, where materials or products are hold in intermediate warehouses, we can distinguish two routes. Initially, when the products need to leave the manufacturers premises, the transportation from the manufacturer to an intermediate warehouse is carried out. Later on, when the customer needs the products, the materials or products are transported from the intermediate warehouse to the downstream customer.
The transportation costs depend primarily on the type and amount of goods carried from location to location, the distance between these locations, the mode of transport and the vehicle and shipment size (Voordijk, 2010). According to van Amstel & van Goor (2006) the share of transportation costs in comparison to the total distribution logistic costs is growing, because of the increased amount of traffic jams and the trend that transportation to downstream customers is increasingly done in smaller shipment sizes
Material handling cost s
![Figure 1-1: Layout of the packaging lines at the brewery in Zoeterwoude (van Kooten, 2016) [modified]](https://thumb-us.123doks.com/thumbv2/123dok_us/9776886.478730/17.595.91.500.109.334/figure-layout-packaging-lines-brewery-zoeterwoude-kooten-modified.webp)

![Figure 3-3: Logistic network of inbound supply via conventional [A: Bottle lines 21, 22 and 3; B: Can line 6]](https://thumb-us.123doks.com/thumbv2/123dok_us/9776886.478730/41.595.44.540.240.518/figure-logistic-network-inbound-supply-conventional-bottle-lines.webp)