OPTIMIZING PROCESSES AT THE SPARE
PARTS WAREHOUSE OF PORT ELIZABETH
Bachelor ThesisAPM Terminals B.V.
Turfmarkt 107 2511 DP, Den Haag
Frouzan Soltani
S0183962
Universiteit Twente
André Langendoen
Company Supervisor
Senior Program Manager Procurement
Peter Schuur
I
Management summary
The goal of this research was to increase the control over the inventory of spare parts at APM Terminals’ Port Elizabeth in New Jersey, U.S.A. This research is conducted by order of APM Terminals Head Quarters.
Absolute inventory inaccuracy at the terminal of Port Elizabeth in 2014, was 56%. Also a depreciation of $1 million was detected and less than 60% of purchased goods where issued through correctly followed steps. Inventory was stored on different location around the terminal, managed by various departments of Maintenance & Repair.
We started off with a performance check to get an understanding what aspects required most attention. This Warehouse Excellence Scan (WEX) assessed all the main areas for warehousing spare parts; People, Process and Product, through scoring the categories; safety, health, security & environment, people, process, inventory management, workplace organization, CMMS/WMS, performance management and continuous improvement.
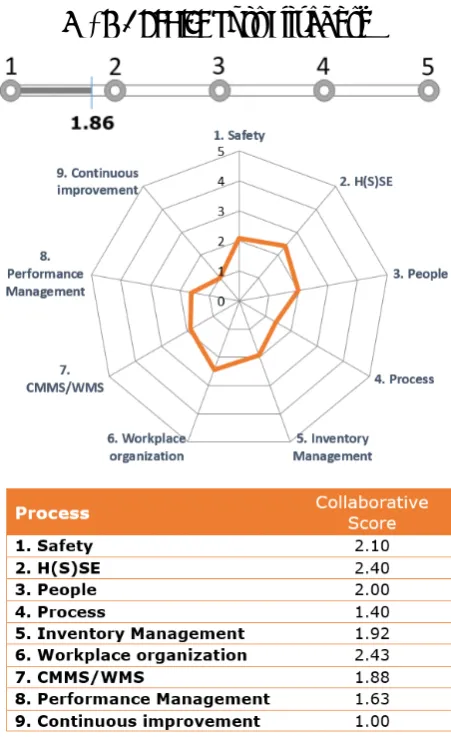
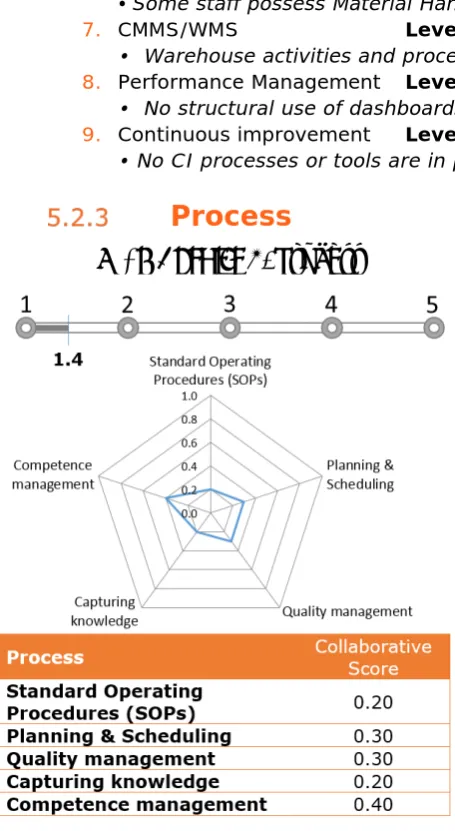
The overall warehousing results of Port Elizabeth were low in maturity, 1.86 points of the 5, and required changes mostly in process standardization. Processes scored a mean of level 1, which indicated that there were no warehouse processes defined.
The WEX advised us to increase inventory control by process standardization through implementing Standard Operating Procedures (SOPs). Installing SOPs was, as
implementing any change, a phased project with writing the SOPs through specifying, documenting an reviewing. Thereafter we trained staff so they could execute the
procedures. Where after we advised the terminal to maintain the SOPs on a yearly basis.
The extent of the SOP implementation can affect the control of the inventory at Port Elizabeth through various ways. Firstly the SOPs steer towards usage of IFS, which increases insight in the movement of parts. Next to that SOPs avoids variations,
regardless of the operator and time of operation. Also SOPs help facilitate the transfer of knowledge and skill, so this will not get lost when there is a change of staffing. But SOPs are not all roses, when written poorly the procedures can affect the company negatively.
As result of our efforts in SOPs among other things, the estimation in August 2016 was that a value of $3,8 million, 75% of the purchases for Maintenance and Repair, went through the STRONGER solution J-cat. This indicated the magnitude of controlled
purchasing. The value of inventory that was issued through Work Orders summed up to around $3 million, which is 80% of all issued material being obtained through the SOP’ set way of working.
Acknowledgements
This research was conducted between September 2015 and February 2016 at both Port Elizabeth, New Jersey and APM Terminals’ Head Quarters, The Hague in partial fulfilment of my Bachelor Technical Business Administration. I want to use this opportunity to thank a number of people who contributed to this research.
Firstly I would like to thank André Langendoen of APM Terminals. He gave me the
opportunity to make this incredible journey to the United States. He guided me with such care and knowledge. He backed me up in bold choices and gave me space to develop. A real sparring partner that also kept me on track and reminded me of my scoop. Our almost familial band is real dear to me and gives me the power to push trough.
Also I would like to thank Peter Schuur of the University of Twente. His witty enthusiasm made the subject even more interesting. The flexible way of working he uses made this thesis a joyful project. The motivation and devotion of Peter Schuur was pleasant for me to collaborate with. Thank you Peter, for all your time.
Special thanks to my love and partner Chiel Poortman. His endless patience and support gave me the capability to finish what I have started. Also thanking Kathy and Maarten for their hospitality, sharing their home and table with me to finish my studies. Thanking Ilse, Sofie and Frederique for their encouraging words and advice to make this thesis structured. Furthermore I would like to thank my family, who I love so dearly, for investing and believing in me.
Finally I would like to thank all the colleagues that provided me with data, insight and knowledge.
Frouzan Soltani
III
Table of contents
Management summary ... I Acknowledgements ... II List of abbreviations ... VI List of figures ... VI List of tables ... VI
1 Introduction ... 1
2 APM Terminals & Port Elizabeth background ... 3
2.1 General overview APM Terminals ... 3
2.2 Port Elizabeth ... 3
2.3 Product ... 4
2.4 Internal organization of APM Terminals and Port Elizabeth ... 5
Maintenance and Repair ... 5
2.5 Goals and Strategy Port Elizabeth ... 5
2.6 Culture Port Elizabeth ... 6
2.7 Markets ... 6
APM Terminals ... 6
North America ... 6
2.8 Industry overview ... 7
3 Research plan ... 9
3.1 Problem formulation ... 9
3.2 Approach ... 9
Stakeholders ... 10
Resources and guidance ... 10
Limitations and constraints ... 11
3.3 Problem cluster ... 11
3.4 Research questions ... 13
Untrained staff ... 13
Unclear processes ... 13
Many storage locations ... 13
Disconnection ... 13
Research Question 1 ... 14
Research Question 2 ... 14
3.5 Research methodology ... 14
Literature ... 14
Current situation ... 15
Designing and implementing improvement ... 15
Trial population ... 15
Results and analytics ... 15
Deliverables ... 16
Activity planning ... 16
4 Literature review ... 19
4.1 Warehousing in general ... 19
People, Process, Product ... 19
P1: People ... 19
P2: Process ... 20
P3: Product ... 21
4.2 Warehouse for spare parts essentials ... 22
4.3 Standard Operating Procedures ... 23
Reasons for SOPs usage in the warehouse ... 23
Content of warehouse SOPs ... 23
Usages of SOPs in the warehouse ... 26
Effect of SOPs on the warehouse ... 26
4.4 Conclusion ... 27
5 Warehouse performance ... 29
5.1 Warehouse Excellence Scan (WEX) ... 29
5.2 Results ... 30
Overall score ... 31
Categories ... 31
Process ... 32
5.3 Financial figures... 32
Total ... 33
Power ... 35
Crane ... 36
RTG ... 36
Overall analysis ... 37
Revised figures ... 37
5.4 Conclusion ... 38
6 Process optimization ... 39
6.1 Standard Operating Procedures (SOP) ... 39
SOP specification ... 39
SOP review ... 40
SOP training ... 40
6.2 Effect ... 40
V
Real impact ... 41
6.3 Conclusions ... 41
7 Conclusion and recommendations ... 42
7.1 Conclusions ... 42
7.2 Recommendations ... 42
More SOPs ... 43
Share and access SOPs with other terminals ... 43
List of abbreviations
APMT A.P. Møller Terminals
BIS Business Information Systems
COO Chief Operating Officer, the biggest terminals within APMT HQ Head Quarters of APM Terminals
HR Human Recourses
HSSE Health, Safety, Security and Environment department
ILA International Longshoremen’s Association (Blue collar Union) IT Information Technology
M&R Maintenance and Repair
MD Managing Director of the Terminal
MLW Mean Low Water, water depth at an average low tide RTG Rubber-Tyred Gantry Crane
TAM Department Technical Asset Management
TEU 20 Foot Equity Unit (indication of a 20ft container) VAL Value Adding Location
WEX Warehouse Excellence –Tool to measure performance of warehouse for spare parts
List of figures
Figure 1 - Map of Newark & New York Port Area ... 3
Figure 2 – Transshipment container port ... 4
Figure 3 – Simplified Organizational Structure APM Terminals ... 4
Figure 4 – APMT Port facilities North America ... 6
Figure 5 – NAFTA Region Container Traffic 2015 ... 7
Figure 6 – Problem Cluster ... 12
Figure 7 - Activity planning Warehouse optimization Port Elizabeth ... 17
Figure 8 – People Process Product ... 19
Figure 9 – Warehouse Processes ... 20
Figure 10 – Processes and flows in a distribution center ... 24
Figure 11 – Overall Results WEX Port Elizabeth ... 31
Figure 12 – Scoring Category 4. Process of Port Elizabeth ... 32
Figure 13 – Financial analysis of total inventory value at Port Elizabeth ... 33
Figure 14 – Financial overview Power Department ... 35
Figure 15 – Financial overview Crane Department ... 36
Figure 16 – Financial overview RTG Department ... 37
List of tables
Table 1 – Category ‘Process’, Sub-category ‘SOPs’ from WEX (2016)……… 28Table 2 – Inventory value Port Elizabeth between January 2014 and November 2015… 31 Table 3 – Counting difference Port Elizabeth……… 33
1
1
Introduction
“
Only if you really want to go to New York
” said André Langendoen (2015), after
offering the short term assignment.
That is why, in the framework of completing my bachelor thesis at the University of Twente, I conclude my research optimizing processes at the spare parts warehouse of APM Terminals’ Port Elizabeth, New Jersey. APM Terminals is one of the biggest
international port operating companies in the world, with Port Elizabeth as one of their most important terminals. This research focusses APM Terminals’ Port Elizabeth (Port Elizabeth) only, where the names APM Terminals and Port Elizabeth are being used interchangeably.
Project STRONGER, a procurement optimization program initiated by the company’s Head Quarters and supervised by André Langendoen, was send to Port Elizabeth to improve purchasing beginning 2015. Port Elizabeth, New Jersey, was a competitive area looking for optimization and cost reduction. Deployment of STRONGER was done both in North America and Europe, but obtained insufficient results at Port Elizabeth. In
combination with big financial depreciations in the warehouses, involvement of
warehousing specialism in any kind was welcome. Therefor this thesis was a part of a bigger assignment, zooming in on the weakest link within warehousing spares at the terminal.
This thesis consists of multiple chapters, each focusing on a different aspect of the research conducted. Chapter 2 provides background on APM Terminals’ and specifically Port Elizabeth’s area of business. The internal organization, product, market and industry are explained briefly discussed in this chapter. Chapter 3 focusses on the research itself; it sets out the problem formulation and questions, research approach and questions, followed by design and planning. Chapter 4 summarizes the literature review conducted to build a theoretical framework on warehousing of spare parts. Chapter 5 consist of the result of APMT’s Warehouse Excellence scan (WEX), that measured the performance of Port Elizabeth state of warehousing at the time. Chapter 6 adresses the improvement of he weakest point of the WEX, processes. Concluding all prior writing, chapter 7 joins the highlights and recommendations.
Knowledge is power, also in the dynamic world of commercial business. This thesis is a way of passing on the experience of optimizing warehouses for spare parts within APM Terminals. This has not been done before under supervision of its Head Quarters. Documenting the course of events with a theoratical backbone provides a strong tool when reproducing warehouse optimization.
The base is put, now the serious business can follow. Enjoy.
“Read to weight and consider”,
advises Francis Bacon (1625).
3
2
APM Terminals & Port
Elizabeth background
This second chapter provides background for the business APM Terminals and specifically Port Elizabeth operate in. First a general overview of APM Terminals is set out in section 2.1, followed by a more specific description of the Port Elizabeth area in section 2.2. Container freight and the terminal’s operations are discussed in section 2.3. The internal organization of Port Elizabeth and the structures within its Maintenance and Repair department are addressed in section 2.4. Port Elizabeth’s goals and five year strategy are described in section 2.5. In the last section (2.6) the focus is on culture, the market and the industry.
2.1
General overview APM Terminals
According to Drewry Maritime Research (2015) APM Terminals represented 5.5% of the global container handling market in 2014. APM Terminals is a recognized industry leader in providing terminal services for container ships and port infrastructure. The company operates a Global Terminal Network of operating ports, terminal facilities and Inland Services in 58 countries spread over the world, as well as providing independent Crane Engineering Services to the global port industry (APMT, company-information, 2015).
The company has its headquarters (HQ) in The Hague, The Netherlands and operates among shipping lines, importers, exporters, governments, business leaders and the entire global supply chain. With 20.600 professionals the company provides port management and operations over 60 liner shipping costumers (APMT, company-information, 2015).
As part of HQ, the Procurement department is responsible for the logistic stream within and around the terminals themselves. This
extensive view has been adopted recently and comprehends Category Management for Operational Expenditures, Category
Management for Capital Expenditures, warehousing, support for business implementations, acquisitions and transactional procurement support.
2.2
Port Elizabeth
Back in 1910 the basis of Port Newark in Newark, New Jersey, United Stated was constructed (To Make Newark Bay a Big Port; The Jersey Meadow's Being Transformed Into a Busy Spot, with Docks and Reclaimed Land, 1915). To reach the port, ships had to travel through The Narrows and the Kill Van Kull towards the Newark Bay. This route is shown in figure 1 with a black arrow. In those waters the first containership, the Ideal X, set sail for Port Houston on the 26th of April
1956 (Port History, n.d.). What led to the build of the first containerized port in the world, Elizabeth-Port Authority Marine Terminal. Now known as APMT’s Port Elizabeth.
In 1985 Port Elizabeth was the world’s busiest container port. In 2004 it was the largest port on North America’s eastside (Lipton, 2004). Currently Port Elizabeth is APM
Terminals’ largest terminal on the east coast of the United States (Port Elizabeth, 2016). With a terminal area of 142 hectares the port is filled with an 1829 meter berth, yard, hubs, gates, offices, workshops, warehouses and other supporting facilities. The depth at dock is between 13.7-15.2 meter MLW and holds 15 container cranes, 10 of them
operated regularly. The neighboring port operators are Maher terminals and Port Newark Container Terminal PNCT. With Maher, comparable to APM Terminals in size, there is a collaboration in terms of the rail (the orange block between the ports shown in figure 1).
2.3
Product
Port Elizabeth’s main product, so to speak, is the service of transshipping containerized freight. The terminal operates as an intermediate
destination for the containers. At the terminal the mode of transportation for the shipments change. The process of transferring a shipment from one mode of transportation to another is called ‘transloading’.
At Port Elizabeth transloading takes place in several ways;
• between sea vessels and inland water vessels;
• between sea vessels and rail or road; and • between multiple sea vessels.
In the last case multiple smaller shipments are consolidated into a larger one or the other way around by dividing a big load.
For transloading to take place, containers are temporarily stacked at the terminal where different extra services can be performed. The stacking period is a service by itself but also cleaning, repairing and weighing the containers is done at the terminal.
As a company APM Terminals also provides the infrastructure for further transportation. Roads, railways and waterage are conceived,
constructed and maintained by APM Terminals. Mostly in collaboration with other terminals, the port authority, local authorities and the country itself. The need of this service depends per terminal. Port Elizabeth has to deal with a strictly regulated port authority which has all
infrastructure in their hands.
FIGURE 2–TRANSSHIPMENT CONTAINER PORT SOURCE:(RUTTER,2009)
5
2.4
Internal organization of APM Terminals
and Port Elizabeth
APM Terminals consist of a group terminals around the world. Most of them are wholly owned by APM Terminals, others are joint ventures (APMT, Compliance Manual, 2014).
Port Elizabeth is wholly owned by APM Terminals and therefore reports into HQ. The managing director (MD) Brian Clark, in charge of the entire terminal, communicates into the Chief Operating Officer (COO). The COO portfolio consists of the 65 biggest terminals that are in operation at APM Terminals.
All terminals are self-sufficient with their own departments like Operations, Commercial, HSSE, Finance, IT and HR. This research mainly engaged with both Maintenance & Repair as well as Procurement.
Maintenance and Repair
Led by Maintenance Director Justin Weir, the terminal gets maintained by six departments spread over the terminal. Container maintenance, RTG maintenance (Rubber-Tyred Gantry Crane), Reefer Maintenance, Crane Maintenance, Power
Maintenance and Facility Maintenance. All departments have a manager, sometimes an assistant manager and a team of blue collar labor force that do operational work. The organization charts for M&R (Maintenance and Repair), Crane, Power and Facility are to be found in Appendix A in the attached bundle. The current structure within the
departments vary because of historic heritage.
Important to know is that the blue collar labor force is united within the International Longshoremen’s Association (ILA), which is the union of maritime workers in North America. The labor force of multiple terminals and terminal-related companies are united in this association. Changing structures, job quantities and functions are debated every 3 to 10 years, depending on the contract between terminal and union. This structure prohibits for example management and HQ to touch materials or hire or lay off workforce.
2.5
Goals and Strategy Port Elizabeth
Every five years APM Terminals Head Quarters launches a new strategy plan. This plan is to be conducted at the terminals and therefor affects operations in Port Elizabeth. The current timeframe which runs from 2015 to 2020 is called ‘Reach 2020’. Its main pillars are understanding trends, employing the best people, deploying technology, become recognized leaders in the port industry and grow business on best practice foundations. In order to achieve the objectives set in ‘Reach 2020’ APM Terminals has created four central themes:
• Reach new markets and customers • Reach safe, industry-leading operations
• Reach results through capabilities and collaboration • Reach our bold ambition (APMT, reach2020, 2015)
Elizabeth’s strategy focusses mainly on results through capabilities and collaboration. The Fatal Five, an APM Terminals safety program, is to be implemented and optimization through modernization is needed for the results.
2.6
Culture Port Elizabeth
APM Terminals is an operation driven company that values their customer’s needs to stay within the market. Having low flexibility and external orientation, creates market culture according to Robert Quinn (2015). This culture is result orientated and focusses on competition, achievements and finishing the job. This is the true work ethic on the terminal. Next to that, there is the separation between management and labor. Union and APM Terminals so to speak. This is not always an homogeneous alliance, with
strikes, stops and walk outs. Combine that with a bit of the ‘New Jersey spunk’ and there is a devil to play. But in times of big storms, snow and accidents the terminal is one and united.
2.7
Markets
APM Terminals
APM Terminals has its reach over almost the entire world. Drewry’s Annual Report (2015) shows that APM Terminals has the most geographically balanced portfolio in the industry in terms of throughput. Next to 18% of the volume handled in the Far East, APM Terminals is concentrated around the coasts of Europe, West-Africa and along North- and South America. In Appendix B of the
Appendix bundle, the maps with terminals and inland services gives a visual of the current situation. The majority of the investments in 2015 are done and planned in emerging markets like Mexico, Costa Rico, Nigeria and Ghana (portfinanceinternational.com, 2015).
North America
APM Terminals is the leading terminal operating company in North America, with weighted throughput of 4.42 million TEUs (twenty-foot equivalent unit) in 2014 (Drewry, 2015), and a market share of 9.2%. The company has interests in seven US ports, including the Pier 400 terminal at the Port of Los Angeles, which with an area of nearly 500 acres, and an annual throughput of 2 million TEUs in 2014, is the largest single proprietary terminal in the world. The 40-acre on-dock rail facility,
pioneered by APM Terminals, can accommodate four double stack trains simultaneously with five miles of working track. Overall container traffic at US and Canadian ports was 53.2 million TEUs in 2014, representing 8.2% of global container throughput for that year (Drewry, August 2015).
7
Port Elizabeth was ranked first in the United States in the JOC productivity study for the first half of 2014 with 82 MPH with a vessel alongside. The facility handled 1.18 million TEUs in 2013. APM Terminals Houston ranked 3rd among US terminals with 68 MPH with a vessel alongside. APM Terminals was named “Port Operator of the Year” for 2014 at the Lloyd’s List North American Maritime Awards in Houston, in February 2015.
But in 2016 these numbers came to a fall and the all-time low is reached in container freight according to Drewry’s forecast (Consultants, 2016). Because the figures of the first two quarters are not public yet, the details are still concealed. This goes for North America as well as for the rest of the world.
2.8
Industry overview
Drewry’s Annual Report (2015) ranked APM Terminals third place among Global Terminal Operating Companies for 2014 in terms of market share. Following PSA International and Hutchison Port Holdings, APM Terminals has a Drewry-calculated equity-share
throughput of 37 million TEUs. While other companies are busy expanding, activity drivers for APM Terminals and DP World (forth in ranking) are acquisitions, selling non-core investments and greenfield developments.
In Appendix C of the bundle the complete NAFTA (North American Free Trade Agreement) Port Rating of 2015 is placed. Here the entire overview of the North American industry is displayed. Figure 5 shows the top three of the 50 terminals, in ranking Los Angeles, Long Beach and New Jersey. This overview also shows the amount of TEUs (Twenty-Foot Equivalent Unit, which is a container the size of 20ft) the ports carried in 2014 and 2015.
FIGURE 5–NAFTAREGION CONTAINER TRAFFIC 2015
9
3
Research plan
This chapter describes the outlines of the research. Setting a solid base in the first section by formulating the problems and producing the problem statement, optimizing the warehousing of spare parts. Section 3.2 defines the research approach with its stakeholders, resources, guidance and limitations. Whereas section 3.3 distributes Heerkens’ (1998) problem cluster, with the main issue being no control over the inventory. In section 3.4 the derived research questions are presented, accompanied with the methodology to answer them in section 3.5. Last, but not least, the construction of the research is explained in section 3.6.
3.1
Problem formulation
During yearly financial review of the terminals, Port Elizabeth fell under the attention of its Portfolio Manager Wim Lagaay. The write-off for 2014 of the M&R department
appeared to be 1 million dollar. The current value of these departments inventory was no more than 6 million dollar, which means that the warehouse lost roughly 16% in
depreciation.
Project STRONGER, a procurement optimization program initiated by the company’s Head Quarters, was send to Port Elizabeth to improve purchasing beginning 2015. STRONGER, already implemented in other North American terminals, experienced difficulties with conveying their methodology and encountered resistance in change. The conclusion was that only changing the procurement department would not adjust the earlier detected depreciation.
Port Elizabeth is a terminal with a rich historical background. Its heritage consists of all the knowledge that is gained through the years, but also of organizational structures that do not fit the current terminal operations. Those formations are visible in the fragmentation of the warehousing of spare parts for maintenance. All six Maintenance and Repair departments (Container, RTG, Reefer, Crane, Power and Facility
Maintenance) operate separately. Each department has its separate location(s) on the terminal, at separate workshops, with separate warehouses, with a fixed group of specialized staff. They use the same computer program, IFS, but have their own codes and descriptions for products (nomenclature). Also the vendors they buy from vary, even if items are similar.
Combining and collaboration between departments is made difficult by the Union agreements made in the past. Also tension between departments exist because
departments feel treated unequally compared to others. Next to that the feeling towards the Procurement department is hostile and is mostly worked around to avoid
collaboration. On top of that, the culture is not open for change.
The problem statement is formulated as:
Optimize the warehousing of spare parts for Maintenance and Repair at Port Elizabeth in such a way that it can be executed in all the divisions of this department, thereby providing an optimized commensurate way of working both physically as digitally in the warehouses.
3.2
Approach
needs guides and has its own boundaries; all mentioning worthy and most relevant are disclosed.
Stakeholders
The effect of structured adjustments to minimize depreciation and regain control of inventory at Port Elizabeth affects many players.
First of all the person who took action; the portfolio manager at HQ; Wim Lagaay. In time of cost reductions every penny counts. With the goal of the COO portfolio to generate savings of 10 million in one year, this seemed a big fish.
Because of the reporting line into the portfolio manager, also Port Elizabeth’s Terminal MD, Brian Clark, is a stakeholder. He has to provide back-up for Justin Weir, Port Elizabeth’s M&R Director, so he can execute change. Also all the managers under Justin Weir’s supervision are influenced by these changes, they have to implement and sustain the change together with their staff. In short the entire M&R Department and the
terminal MD are considered to be stakeholders.
The optimization also serves the internal customer; Technical Asset Management (TAM). They are the mechanics that work in the M&R department. Every minute that they lose on equipment, the operation is delayed or in the worst case shut down.
Project STRONGER, has invested time and resources the Procurement department at an earlier stage and also needs results based on their efforts. They need success within the North American terminals. Achieving positive results in New Jersey counts as a big win and strengthen their approach.
Together with Project STRONGER, Group Procurement is on the path to change
purchasing within all of the APM Terminals. Having this wholly owned terminal organized properly is a must to display the benefits of this change. They will also have to provide help and guidance in the process of the warehouse restructuring.
Next to all the internal stakeholders, the suppliers of the warehouses are involved. This group will be addressed to help in optimizing the warehouse. From reopening contracts, to attracting new stakeholders and saying good bye to others. They are a key
stakeholder in making the structure work.
Resources and guidance
This research will be an add-on for Project STRONGER. The STRONGER team, existing of an HQ team and a Mumbai team. André Langendoen, Mahmoud Gamal and Jerry Jansen are the strategical and implementing team in The Hague. They were the first line of help in the new setup. The Mumbai team, which is more report and support, provided the needed information to analyze the situation. STRONGER also provided the possibility to visit the site in Newark, New Jersey when necessary. André Langendoen, project manager, also managed this report and used the findings in later STRONGER roll-outs.
11
implementation of the new structure, if well founded. Justin Weir helped shaping this report to a usable product that can be implemented at Port Elizabeth. Other terminals helped with through sharing their material. Several other terminals indicated to be interested in the results of the thesis, to implement at their own site.
Next to that Peter Schuur from the University of Twente guided this research content-wise as supervisor. He helped in terms of insights, reporting, writing and functioned as sparring partner.
Limitations and constraints
This research is limited by the basic variables of time and money. HQ wanted the project to be fulfilled in Q4 from 2015 (October, November, December). If, and only if, there were financial results booked in the first three months of the research, the timeframe would be extended to end Q1 2016 (March). Next to that the port is located in Newark, New Jersey and most of the work was done in The Hague. Travel from The Hague to Newark was sponsored by project STRONGER, thereby requiring consciously spending resources.
Optimizing the warehousing for spare parts is backed up by the management team of Port Elizabeth, but had to stay in line with the Union agreements. Staff functions and positions could not be altered. Also hiring and laying off personnel was not an option within the labor force. All extra work was done in overtime, this created extra costs and were to be suppressed as much as possible. Another limitation was the prohibition on touching, moving or counting of materials by management or HQ. Only the blue collar labor force was allowed to do this. Also the departments were to keep their individual warehouse, consolidating was not an option. Also implementing technology that takes over manual labor was not allowed.
All the structural changes that are planned must be approved by terminal management and the Union. If management agrees on points that the Union does not, bargaining can be done. This is something this research wanted to stay away from.
3.3
Problem cluster
Structural change has to tackle certain problems. To get to the core of these problems visualization can help. According to Heerkens, (1998) a problem cluster is a professional way to determine if the problem given by the client – in this case APM Terminals – is the real problem. The cluster is a scheme in which the causality of various problems is mapped and isolates the underlying action problems within the reality of the client.
Through interviews with stakeholders, inspecting the different warehouse locations and gaining insight in financial records, various problems surfaced. With the problem cluster in figure 6, the main items are covered. The core problem is displayed in the middle big blue block and is surrounded by the four causes. These causes are also problems and are overarching the arrow pointing towards the smaller blocks.
13
3.4
Research questions
The problem cluster is the foundation on which the research questions were formulated. The relations that are shown in the cluster are covered thematically and in bottom-up order. Most problems are discussed and derived into research questions.
Untrained staff
One of the main reasons the current inventory was not under control, was because of the people that carry out the task of keeping the warehouse. The blue collar staff is not trained properly in IFS, the used ERP on the terminal. This ERP was not completely warehouse orientated, lacks analytic functionality and was not intuitive, but was capable of keeping track of inventory. Because staff was not trained in warehousing, processes were improvised which led to illogical and unsustainable procedures. In the last two years six people have retired at the M&R departments and had just several weeks to pass on their knowledge to new staff. Also the lack of a critical eye on the inventory in combination with software that does not support those functions at the moment.
Unclear processes
Next to the lack of professionalized processes, there was no standard. Every department and every employee did matters in their own way. The absence of documented ways of executing work, caused misses in delivery, communication, picking, issuing and parts creation. Also responsibility of steps within the process shifted from one to another, when new staff came in. Old members leaving could transfer information by telling them, but so much impressions can last and new staff was not reminded.
Many storage locations
Port Elizabeth reaches over 142 hectares, the size of 282 soccer fields. The operation takes up most of the space. Scattered around the area the workshops of the M&R departments are allocated. A clear visualization is provided in Appendix D in the bundle. Every workshop had a warehouse next to it, but because most buildings are not build for what they were used for, materials could not be stored in one location. So again the storage of parts was done around these workshops in different rooms, containers and outside. The crane and RTG department even had other locations where they store big slow moving articles. Facility maintenance had a small workshop, but the rest was spread over the entire terminal with at least 12 locations. Reviewing, controlling and securing was troublesome because of this spread.
Disconnection
Research Question 1
What aspects are essential for warehousing of spare parts for Maintenance and
Repair at APM Terminals’ Port Elizabeth?
Getting a grip on inventory can be done through different channels. Exploring which possibilities can be optimized, gives way to construct improvement. With this research question all the facets of warehousing spare parts are broadly viewed. Also an overview of Port Elizabeth’s methods is necessary to get understanding of their operation.
A. What, according to literature, are the aspects that a warehouse for spare parts consist of?
B. How is the warehousing for spare parts at Port Elizabeth performing in the aspects given by literature?
C. What aspect, according to APM Terminals Warehouse Excellence Scan, requires most attention?
Research Question 2
How to approach the optimization of the aspect that requires most attention at
Port Elizabeth’s warehouse for spare parts?
After getting an understanding of warehousing spare parts and the situation at Port Elizabeth, the second question selects a topic to improve.
A. What does literature say about approaching the aspect that requires most attention?
B. What, according to APM Terminals Warehouse Excellence Scan, should be the next step in optimizing the aspect that requires most attention?
C. To what extent will the optimization of the aspect that requires most attention increase the control of the inventory at Port Elizabeth?
3.5
Research methodology
In this section we describe the methods used in this research.
Literature
Starting off with a literature review by looking at warehousing for spare parts. The keyword (or combinations): warehouse, spare parts, essentials, aspects, setting up. Selected articles or books on generality, referred to more than 20 times, by reading the abstracts and read thoroughly when matching our scope. Also searched for cross
references, to build knowledge of the research field. After understanding the current situation literature study was done again. Now the scope was warehouse processes and optimization. Keywords: warehouse, processes, optimization, implementation,
standardization. All with the same requirements as before.
Together those two researches led to the answering of two sub-questions and partially sub-question 2C. The literature is described in chapter 4.
Question 1A What, according to literature, are the aspects that a warehouse for spare parts consist of?
15
Question 2C To what extent will the optimization of the aspect that requires most attention increase the control of the inventory at Port Elizabeth?
Current situation
To get an understanding of the processes, resources and organization a workshop was held at Port Elizabeth. Visitations, interviews with stakeholders: M&R manager,
department managers, warehouse supervisor, storekeepers, administrative employees, foremen, auditor, TAM representatives and STONGER management. Combining these interviews with personal observations was not enough to measure the performance of the warehouses. The Warehouse Excellence Scan was conducted to compute the overall state of warehousing at Port Elizabeth. All aspects, including finance, where assessed and scored.
The sub-questions 1B and 1C were answered fully. Question 2B was supplemented by a Kaizen meeting with several warehouse people checking and revising the drafted
outcome. This is mainly described in chapter 5.
Question 1B How is the warehousing for spare parts at Port Elizabeth performing in the aspects given by literature?
Question 1C What aspect, according to APM Terminals Warehouse Excellence Scan, requires most attention?
Question 2B What, according to APM Terminals Warehouse Excellence Scan, should be the next step in optimizing the aspect that requires most attention?
Designing and implementing improvement
After concluding in sub-question 2B to design and implement Standard Operating Processes (SOPs), literature review was done again as said in section 3.5.1. Gathering material from other terminals, searching for standards within the company and creating SOPs with lean manufacturing in mind and the 5+2 S methodology. Predicting theimpact by looking at both financial figures as well as how well procedures are followed in the system. The development, results and forecast are described in chapter 6 and
answered sub-question 2C.
Question 2C To what extend will the optimization of the aspect that requires most attention increase the control of the inventory at Port Elizabeth?
3.6
Research design
This section elaborated about how the research is constructed.
Trial population
After financial analysis, the Power Department had most value and highest inventory inaccuracies. Therefor they functioned as trial department to show HQ what an impact this change can make. The department’s manager was willing to implement change. Trivial is also that the foreman is able to see optimization as an improvement, not only as a threat.
Results and analytics
Deliverables
The deliverable of this report consist of two parts. Firstly a report on the current performance of Port Elizabeth’s warehousing of spare parts. This report describes
financial and none financial achievement of all warehouse locations. The second part is a tangible product that optimizes warehousing for M&R, both physically and digitally. The product should be applicable for all departments, creating structure and standardization.
Activity planning
To implement a new strategy without disrupting the organization Robert Kaplan and David Norton (2006) state that preparation in the most important part of the change. Aligning goals, theme’s and restrictions with management is the first step (STRONGER). Followed by understanding the current situation, its tops and flaws (REVIEW). Third the executive team identifies the strategic initiatives (typically those that span business-unit boundaries) that support each theme and authorizes the resources—money and people— required to implement each initiative (DESIGN). Where after the implementation is done and the new strategy must be sustained (IMPLEMENT).
Because this report is a grip out of the overall optimization of Port Elizabeth’s
warehousing, the activity planning was adjusted. All subjects that are used in this report are notably marked in the activity planning shown in figure 7 on the next page. All taken actions are bold and in color. Steps that are taken outside of this report, are grayed.
17
19
4
Literature review
This research has its foundations in literature. Insight was gained in warehousing, spare parts and standard operating procedures. This chapter answers sub-questions 1a and 2a, whom search for aspects that a warehouse for spare parts consist of (section 4.2) and how to approach SOPs (section 4.3). Next to that research, section 4.3 also the extent of SOPs was reviewed. But to start off with some basics, section 4.1 describes the
warehouse in general and essential warehousing aspects.
4.1
Warehousing in general
Let us first look at warehousing in general before zooming into spare parts. A warehouse, according to Jeroen van den Berg (2013), should be viewed as a temporary place to store inventory and as a buffer in supply chain. He states that the warehouse serves as a static unit matching product availability to consumer demand and as such has a primary aim which is to facilitate the movement of goods from suppliers to customers. The warehouse should therefore also meet demand in a timely and cost-effective manner. Bluntly said: a transshipment point where products come in, get stored and go out, with suppliers, the warehouse and customers as actors.
People, Process, Product
To isolate the warehouse in overseeable compartments, an adjusted
version of Chihiro Nakao’s “New Production Preparation” (NPP) is used (Hamilton, 2012). The 3P methodology is interpreted in different ways. In this thesis the P’s stand for People, Process and Product (Soelen, 2014). Together these P’s bundle all the activities within the warehouse.
P1: People
Karen Hupe (2014) states that the amount of people you need to run a warehouse, depends on its type.For some fulfillment centers, automated systems, robots, and industrial engineering have taken the human element out of warehousing. For others, it is still a very labor-driven place.
The Material Handlers, the Order Pickers, Packers, Receivers, Stockers, Assemblers are a group of employees that do only one job, are cross-trained for multiple jobs, or do something completely different. But these ‘worker bees’ in the fulfillment warehouse are the ones that make the operation run efficiently. The inventory clerk is responsible for a variety of clerical duties relevant to warehousing, receiving and shipping materials. In most cases, this person handles relationships with vendors and/or suppliers, and is responsible for monitoring inventory performance and assists in creating purchase orders to replenishment stock before it runs out. They’re also heavily involved in keeping
inventory counts in check. Next to them the Warehouse Supervisor supervises, organizes and monitors the receiving, storage, and distribution of inventory. He or she oversees the ‘worker bees’ to ensure that they are on task at all times, performing to the metrics required of them, and often times trains new employees in the process. Managing the entire crew is the Warehouse Manager, who monitors all warehouse activities. His responsibilities involve scheduling tasks to personnel, helping the vice president of operations or COO negotiate rates with carriers, creating daily work logs, collecting
FIGURE 8– PEOPLE PROCESS PRODUCT
actionable data related to labor, shrinkage, fill rate, etc. to plan more efficient operations, and of course supervise and train warehouse employees and their
supervisors. Next to all these employees, it is commonly seen that warehouses employ safety managers. This person’s responsibilities include fostering a safety-minded culture in the warehouse through OSHA training and education, investigating onsite accidents to determine the cause and recommend preventative measures, managing the employee health and safety guidelines set forth by both the company and local/state/federal laws, and implementing and creating programs that promote safety and security of warehouse employees.
The Ministry of Labor of Ontario (2014) states that warehouses can be hazardous places to work. Workers can be seriously injured or even die as a result of warehouse hazards. Health and safety is a big issue and workers are exposed to dangers like slips, trips and falls.
P2: Process
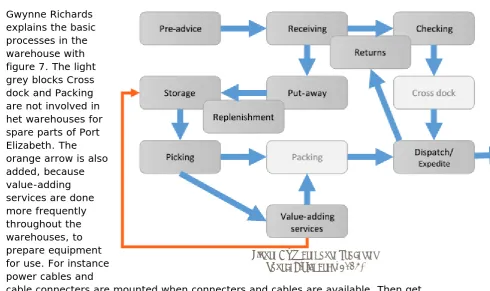
Gwynne Richards [image:28.595.66.557.283.574.2]explains the basic processes in the warehouse with figure 7. The light grey blocks Cross dock and Packing are not involved in het warehouses for spare parts of Port Elizabeth. The orange arrow is also added, because value-adding services are done more frequently throughout the warehouses, to prepare equipment for use. For instance power cables and
cable connecters are mounted when connecters and cables are available. Then get stored again.
The flow of materials in a warehouse is described by Jeroen van den Berg in his article about Models for Warehouse Management (1999). He states that goods are delivered by trucks, which are unloaded at the receiving docks. There the quantities are verified and quality checks are performed on the delivered loads by random sampling. Subsequently, the loads are prepared for transportation to the storage area by attaching a label, e.g., a bar code or a magnetic label.
Subsequently receiving the loads are transported to a location within the storage area. Whenever a product is requested, it must be retrieved from storage. This process is called order picking. An order lists the products and quantities requested by a customer or by a production/assembly workstation, in the case of a distribution center or a production warehouse, respectively. When an order contains multiple SKUs, these must
FIGURE 9–WAREHOUSE PROCESSES
21
be accumulated and sorted before being transported to the shipping area or to the production floor. Accumulation and sorting may either be performed during or after the order-picking process. Hence, we may subdivide the activities in a warehouse into four categories: receiving, storage, order-picking and shipping. A study in the United
Kingdom [2] revealed that order-picking is the most costly among these activities. More than 60% of all operating costs in a typical warehouse can be attributed to order-picking (Fig. 1).
According to Jeroen van den Berg (2014) warehouse management systems are software systems that controls the activities (read; processes) within the distribution center. The system knows which goods are to be received and shipped. It determines which tasks need to be performed to process the goods and sends commands to human operators and automated material handling systems to execute these tasks. Furthermore, the system captures relevant data on orders, shipment, inventory, warehouse layout, staff, vehicles, customers, suppliers and activities.
Another process important within the warehouse is performance management says Gwynne Richards (2014). To ensure customer satisfaction and a culture of continuous improvement within the operation. Performance needs to be measured to discover potential issues before they become major problems. That goes for warehouse processes as well as for staff. With measuring their performance they can be assisted in personal development areas and be rewarded where appropriate.
P3: Product
The third P stands for product, in this case represents the warehouse itself. According Bertorello (2008) the base of today’s warehouse is an balance between high customer service level, low cost and lower inventory. Setting up a warehouse the understanding of what kind of scenario most closely resembles the operation must be known. Bertorello presents four basic cases that sketch the warehouse activities:
• Low Activity / Low Storage Requirements
The simple smaller warehouse operation. Rarely automated, Floor storage, stacked pallets, simple pallet racks and/or conventional shelving are utilized within the facility along with manual handling
• Low Activity / High Storage Requirements
High bay, multi-level, high-density storage and random location strategy. Order picking manual or semi-manual
• High Activity / Low Storage Requirements
Condensed forward picking area supported by simple overstock storage. Automated order picking system and automated material handling
• High Activity / High Storage Requirements
Large distribution center with high picking and storage requirements. Heavily automated material handling and sortation systems
To gain the understanding detailed analysis of SKU order line item history and prognoses for the future should be done says Bertorello (2008).
The warehouse as a product is also its layout and organization. Gwynne Richards (2014) discussed in his book ‘Warehouse Management: A Complete Guide To Improving
packing, dispatching, cross-docking, empties, MHE charging, warehouse offices and staff facilities.
Next to facilitating the surroundings, inventory must also be managed. Richards (2014) said that inventory management is the set of activities that are employed in maintaining the optimum number or amount of each inventory items. Inventory management has the objective to provide uninterrupted productions, sales, customer-service levels, all for minimum cost.
4.2
Warehouse for spare parts essentials
This section zooms in on warehousing spare parts specific.
Gwynne Richards (2014) says that manufacturers store spare parts just in case the production line operation gets interrupted because of a defect. Even though this can be a costly operation, the trade-off is between the cost of the part together with its holding cost, and the potential breakdown of the production line and the consequences that brings with it. These items should be reviewed regularly and decisions taken as to whether to stock them or not. Taking into account are supplier lead time and machine failure rate.
Practice makes perfect, but there is no room for error in this economy where “measuring twice, cutting once” is the only way to survive. Therefore a pragmatic framework for stocking spare parts is developed by René Botter (1998). René Botter (1998) describes the 8 different kind of parts that the warehouse contains. Understanding these, gives more understanding of the product itself. Port Elizabeth deals with all these variations.
1. Low price, short response time, high usage
These fast moving parts have to be stocked in large quantities in local warehouses, i.e. close to the market
2. Low price, short response time, low usage
Also these cheap slow moving parts have to be stocked close to the market, but in lower quantities
3. Low price, long response time, high usage
For these parts inventory costs and transport costs should be investigated, in order to determine whether or not local stocking is better than central stocking. Local stocking of fast moving parts could decrease transport costs, as larger quantities can be shipped by cheaper means of transport
4. Low price, long response time, low usage
These parts are only to be stocked centrally, at the Supply Centre 5. High price, short response time, high usage
These parts require firm management, as stocking is expensive. Owing to the short response time, parts primarily have to be stocked in local warehouses. The quantities should be as low as possible, and depend on the desired customer service level
6. High price, short response time, low usage
Again firm management is needed. It may be worthwhile to consider fast means of transport , even if they are expensive (e.g. taxi). In this case stocking centrally in the countries becomes possible, thus reducing inventory costs
7. High price, long response time, high usage
23
8. High price, long response time, low usage
Owing to the long response time these parts can be stocked centrally, at the Supply Centre, and shipped by regular means of transport when needed
The concluding framework of Botter says that for spare parts management, consumption expressed in pieces is more important than consumption expressed in money.
Also that choosing parts to stock depends on the criticality of the part. It is important to look at the consequences if a part is needed and not available. This leads to the
distinction between Vital, Essential and Desirable parts. Criticality is primarily based on service response time and functionality. Service response time is not a suitable criterion for classifying parts as vital, essential or desirable, because an item can be part of different systems each with its own contracted response time. Botter (1998) advises sorting large amounts of SKUs to limit the number of classes to two, namely functional parts and cosmetic parts. How many items to stock depends on the usage in pieces and the price. Service response time is important as well and has a huge impact on required investments in stock.
4.3
Standard Operating Procedures
This section tries to answer the question what literature says about approaching SOPs.
Reasons for SOPs usage in the warehouse
According to Jeroen van den Berg (2012) clear standard operating procedures are an essential element of highly competitive warehouse management. SOPs help the
management and staff understand the process. Process optimization should be discussed when participants do not share the same view. Secondly, the specifications help the manager to look at the processes as a whole. Focus on the bigger picture is more helpful than firefighting individual cases. Also, during documenting processes the differences between executers come to light. Adopting the best practice, makes all the operators more efficient. SOPs also create transparency within the procedures and make way for optimization. Chris Anderson (2016) also states that regulations may require SOPs as part of the compliance. Auditors prefer procedures because it protects both the worker, customer and product.
Content of warehouse SOPs
A written method of controlling a practice in accordance with predetermined
specifications to obtain a desired outcome. SOPs are step by step procedures on how to do something that is critical to quality, critical to safe operations, or critical to security (Anderson, 2016).
Receive
Incoming goods are delivered by truck
Unloading
• The ERP electronically sends the purchase order to the WMS.
• The truck driver arrives and hands the freight documents to the receipt operator. • The receipt operator registers the arrival of the truck in the WMS.
• The receipt operator assigns a receipt dock to the truck in the WMS.
• The truck driver drives the truck to the receipt dock or to a temporary parking space to wait until the dock becomes available.
• The truck driver uploads the pallets from the truck onto the receipt lane.
• The receipt operator verifies whether the number of handling units is correct and if there is any visible damage.
o The receipt operator marks any damages or missing handling units on
freight documents.
• The receipt operator signs off on the freight documents and hands a copy to the truck driver.
• The truck driver departs.
Goods are now at the receipt area in the warehouse. A superficial check on the delivery is done to prevent the truck driver from having to wait for the more detailed review. Agreement with the supplier must include a complaint period during which the distribution center can claim any missing or damaged items.
Receive from truck
• The receipt operator enters on the RF terminal which delivery he is going to receive. He refers to the delivery by the purchase order (PO) number on the freight document.
• When products arrive on mixed pallets or containers, the receipt operator first sorts the goods onto pallets or into containers each holding single products.
FIGURE 10–PROCESSES AND FLOWS IN A DISTRIBUTION CENTER
25
• The receipt operator attaches a license plate (LP) label to the pallet or container. The LP label is a unique barcode identification label.
• The receipt operator scans the LP label and registers the product number and quantity received on the RF terminal.
o For specific products, the operator also enters product attributes such as:
lot number, expiration date, quality status and country of origin.
• Once the receipt operator has received all products in the delivery, he closes the receipt of the delivery via the RF terminal.
• The WMS compares the received quantities with the quantities specified in the PO and the reports any overages or shortages.
o If the quantities do not match, the WMS asks the receipt operator to
re-count the goods to check if there really is a difference.
• The WMS electronically sends a purchase order confirmation (POC) to the ERP.
The goods are at the receipt area and they have been registered in the WMS.
Put away
The goods are now ready for put away.
• The WMS assigns a storage location to each handling unit.
• The WMS displays a put away task on the RF terminal of the forklift driver to pick up a handling unit from a specific receipt lane or a production line.
• The forklift driver travels to the receipt lane and scans the LP on the handling unit with the RF scanner.
• The RF terminal displays the destination location.
• The forklift driver takes the pallet from the receipt lane and travels to the destination location.
• The forklift driver scans the identification label on the location with the RF terminal.
• If the forklift driver carries multiple handling units simultaneously, then he travels to each location and scans the location as well as the LP on the respective
handling units.
• The WMS updates the inventory level in the location.
The goods have arrived at the storage location.
Pick
An order has come in to for the warehouse to pick.
Case pick
• The order-picker selects a pick task on the RF terminal. • The WMS displays the pallet type on the RF terminal • The order-picker takes a pallet.
• The WMS displays the subsequent pick locations on the RF terminal.
o The WMS sequences the picks so as to create an efficient tour.
• The order-picker scans the location and picks the products.
• When the pallet is complete, the order-picker travels to the label printer. • The label printer prints a dispatch label.
• The order-picker attaches the dispatch label to the pallet.
• The WMS displays the destination on the RF terminal: staging location or VAL (Value Adding Location) station via the RF terminal.
Usages of SOPs in the warehouse
Success factors according to Jeroen van den Berg (2012) for achieving good results are: • Operators understand and follow the specified procedures
• Inappropriate conduct is actively challenged
• Standard operating procedures are kept-up-to-date
First setting up and documenting the ideal process that keeps safety, ergonomics,
hygiene, efficiency and quality highly valuated. According to Jeroen van den Berg (2012) having SOPs is not enough. It is essential that the operators understand and follow the procedures, he says. Introduction of the processes and active promotion is a must.
Constantly reminding the executors through posters, mentioning and reviews. Good performance should be celebrated, neglected performance should be addressed. Also when new staff is trained, they should be informed and get copies of the procedures that functions as study material.
It is vital to keep the SOPs up-to-date, constantly streamlining the performance. Each change in the procedures, systems or product flow should be immediately incorporated in the SOPs. Also management has to inform the operators.
Effect of SOPs on the warehouse
When SOPs are well written and staff understand them, SOPs can have several positive effects. The U.S Environmental Protection Agency (EPA, p. 1) states that SOP avoids variations, regardless of the operator and time of operation; provides individuals with the information to perform a job properly; facilitates consistency in quality of an end-result; addresses safety concerns; and minimizes chances for miscommunication, even if there are temporary or permanent personnel changes.
Next to that, de Treville et al. (p.232) also described that SOP ensures that all workers are performing tasks in the same way, which is a necessary condition to obtain
consistent output; and asserted that if a workforce cannot operate the parlor
consistently, then the whole operation will fail. A modern-day SOP enables organizations to ensure uniformity and consistency in the process, across departments that affect their products and services. Treville et al (2005) also states that SOP is a component of total quality management that plays an integral role in improving the output of a given process consistently and efficiently. SOP ensures compliance, accountability, and efficiency among clinical investigators.
According to Biologic Technological Applications (EBTE) Consultants, SOP standardizes activities of a specific procedure; speeds up the integration of an individual into the organization during an initial phase of an employment; improves transparency within the organization; serves as a valuable structure for internal communication; shares best practices within the organization; and provides valuable background information for management policy development and change.
27
asserted that SOP has the ability to facilitate the transfer of knowledge that leads to variability reduction and organizational effectiveness.
Poorly designed SOPs are of little use for the employees. They can influence the ability to reach customer demand and impact company capacities. The overall quality can be decreased and employees can be brought into dangerous situations. The company’s reputation may even suffer because of this.
4.4
Conclusion
To provide a clear valve of this chapter this conclusion bundles the answers of three sub-questions.
Answer sub-question 1A; What, according to literature, are the aspects that a warehouse for spare parts consist of?
Every business, and therefore also warehousing for spare parts, can be split in three P’s; People, Process and Product. People stands for everyone that works in and around the warehouse. The aspects of safety and health are essential for a warehouse to be an appropriate work environment. Process includes all the warehouse activities from receiving to dispatching. Aspects that help processes in the warehouse are Warehouse Management Systems (WMS) and performance management. The last P represents the product, the physical warehouse. The main aspects that hold the warehouse together are the layout, warehouse organization and management of its inventory.
Answer sub-question 2A; What does literature say about approaching the aspect that requires most attention?
In chapter 5 we see that the aspect processes within component process need the most attention. The Warehouse Excellence Scan directed us towards Standard Operating Procedures. These SOPs are an essential element of warehouse management that provides clarity and efficiency. The approach, according to literature, consists of three steps; firstly a proper documented SOP should be written. Then staff should understand the procedure and be trained in the execution. Also staff should be constantly reminded of the good ways of carrying out the procedure. Next to this, the SOP should be kept up-to-date.
Partial answer sub-question 2C; To what extent will the optimization of the aspect that requires most attention increase the control of the inventory at Port Elizabeth? The control of inventory is lost in the current situation because of different reasons mentioned in chapter 3. One of the main problems was the execution of processed happening in different ways.
29
5
Warehouse performance
APM Terminals consists of a large group of terminals and inland services, which makes overview difficult and standardizing expensive. To get a visual and tangible outcome on how terminals are preforming conventionally it gets assessed on core business. Terminal strategies differ and ways of reporting are divergent. Next to financial reports and TEUs, APM Terminals’ head office decided to assess terminals performance with scans. This chapter describes the scan for warehousing in its first section. Results attained at Port Elizabeth will be discussed in section 5.2. Followed by financial reporting in section 5.3. Finishing this chapter with conclusions that (partially) answer sub-questions 1B, 1C and 2B.
5.1
Warehouse Excellence Scan (WEX)
In recent years multidiscipline teams of APM Terminals have developed the Functional Excellence (FEX) and Maintenance Excellence scan (MEX). The FEX focusses on
operational performance, the terminals is assessed at how well it functions as medium that transships containers between two means of transport. The MEX scales the
enforcement of upkeep of equipment used at the terminal like cranes, RTGs, straddle carriers and so one. Both scans have as goal to create insight in how a single terminal is coordinated but as greater vision to contain a global view of how APM Terminals is organized. Through benchmarking, sharing best practices and, peer reviewing, APM Terminals hopes to build standards.
Recently the Warehouse Excellence scan (WEX) was built by Frouzan Soltani
commissioned by APM Terminals. The scan was added to the performance measurement check list of the Continuous Improvement department of the company. The Warehouse Excellence encloses the storage of spare parts for maintenance and repair of the
terminal and its equipment. This scan was developed not only to get insight in
warehousing, but also give an entry for HQ to help terminals optimize and reduce costs.
The development and execution of the scan is explained in the ‘Creation of Warehouse Assessment’ report by Frouzan Soltani (2016). It states that the scan works as
following; An Excel file with different tabs representing different categories that combined give a good insight of a warehouse for spares. Every tab consists of sub-categories that can be scored with valid (V), partially valid (PV), not valid (NV) and not applicable (NA). The scoring is from 1 to 5; 1 is low in maturity and 5 is extremely high in maturity. After assessing all the sub-categories a maturity level will appear in the top right corner. Improvements can be derived from the scan, to work towards the
description of a level higher. Here below is a brief explanation of all the categories the scan assesses (Soltani, Creation of Warehouse Assessment, 2016).
1. Safety
Safety regarding people, process and machine in and around the warehouse 2. H(S)SE - Health, (Safety), Security and Environment
Health regarding people working in and around the warehouse. Security of the premises and the inventory. The handling of waste and energy belongs to environment
3. People