Determining Flight Time Limitations for NH-90 Pilots
Using Bio-Mathematical Models
Master thesis
Saskia Hartmann
30 October 2015
Department of Cognitive Psychology and Ergonomics (CPE), University of Twente
1s t supervisor: Prof. Dr. J. M. C. Schraagen
2n d supervisor: Dr. M. Schmettow
Department of Training, Simulation and Operator Performance, Netherlands
Aerospace Centre (NLR)
ABSTRACT
Since 2010, the Netherlands has had the NH-90, which is the substitute for the Lynx helicopter of
defence. Its technology is not only more up to date, but it also can fly longer than the previous
helicopter. The flight time increased from a maximum of three hours in the Super Lynx 300 to a
maximum of five hours in the NH-90. It is important that the two pilots are alert enough to operate
the helicopter. This study investigated how the increased flight time influences the fatigue level of the
pilots and how severe fatigue can be avoided through Flight Time Limitations (FTL). Using the
bio-mathematical models SAFTE-FAST and FRI, the effect on fatigue of a flight schedule with 39 flight hours
and one with 25 flight hours per week was tested according to the steps of the Fatigue Risk
Management System (FRMS). Both schedules were twelve weeks long. Hazards were identified and
their risks were assessed. Three mitigation strategies were formulated, which were evaluated during
a second study with the BAM and the SAFTE-FAST. The resulting advice is to restrict flight time to 4.5
hours. During the afternoon shift, a flight after 10 pm must not be longer than three hours. Besides, a
flight during a night shift must not be after 6 am. The SAFTE-FAST was evaluated as a good
bio-mathematical model for scheduling flights for the NH-90 by defence due to its accuracy and specific
design for aviation. When implementing the mitigation strategies, the BAM can be used for monitoring
SAMENVATTING
Sinds 2010 heeft Nederland de NH-90 die een vervanging is voor de Lynx helikopter van defensie. De
technologie is niet alleen meer up-to-date, maar hij kan ook langer vliegen. De vliegtijd is van maximaal
drie uur in de Super Lynx 300 naar maximaal vijf uur in de NH-90 gestegen. Het is belangrijk dat de
twee piloten alert genoeg zijn om de helikopter te besturen. Deze studie onderzocht de invloed van
vliegtijd op vermoeidheid bij piloten en hoe zware vermoeidheid door middel van Flight Time
Limitations (FTL) vermeden kan worden. Met de bio-mathematische modellen SAFTE-FAST en FRI
werd het effect op vermoeidheid van een vliegrooster met 39 vlieguren en een met 25 vlieguren per
week onderzocht. Beide roosters waren twaalf weken lang. Het Fatigue Risk Management System
(FRMS) werd als framework voor het onderzoek gebruikt. Gevaren werden geïdentificeerd en
geëvalueerd. Drie mitigatiestrategieën werden geformuleerd en getoetst tijdens een tweede studie
met de BAM en de SAFTE-FAST. Het advies is om vliegtijden tot 4,5 uren te beperken. Als tijdens een
middagploeg na 22 uur gevlogen wordt, mag de vlucht niet langer dan drie uren zijn. Daarnaast mag
tijdens een nachtploeg niet na 6 uur gevlogen worden. SAFTE-FAST wordt gezien als een geschikt
bio-mathematisch model voor het inroosteren van NH-90 vluchten bij defensie vanwege zijn
nauwkeurigheid en specifiek ontwerp voor de luchtvaart. Als de mitigatiestrategieën
geïmplementeerd worden, kan de BAM voor het monitoren van de vermoeidheid bij piloten gebruikt
TABLE OF CONTENTS
Table of Figures... 6
Abbreviations ... 8
Introduction ... 9
Fatigue in aviation 10
Fatigue 10
Consequences of sleep deprivation on cognitive skills 11
Fatigue Risk Management System (FRMS) 12
Bio-mathematical models 14
Flight Time Limitations for NH-90 Pilots 19
Flight Time Limitations (FTL) 19
Current FTL for NH-90 pilots 21
Research questions 21
Study 1: Identifying hazards ... 22
Methods 22
Bio-mathematical models 22
Scenarios 24
Procedure 25
Analysis 26
Results 27
First scenario 27
Second scenario 39
Conclusion 44
Schedule components resulting in severe fatigue 44
Assessing safety risks 45
Risk Mitigation 47
Study 2: Effectiveness of mitigations ... 47
Methods 47
Bio-mathematical model 47
Scenario 48
Procedure 48
Analysis 49
Results 49
Description of the scenario 49
SAFTE-FAST 50
Development of severe fatigue 51
Comparing the effectiveness scores of study 1 and 2 54
Conclusion 55
Discussion ... 55
Comparing the results to previous studies 55
Evaluation of the bio-mathematical models 56
SAFTE-FAST and FRI 57
Individual differences 57
BAM 59
Limitations 59
Recommendations 60
References ... 62
Appendix A
Literature Search Criteria ... 68
TABLE OF FIGURES
Figure 1. Framework for examining the relationship between fatigue and safety (Williamson et al.,
2011). ... 12
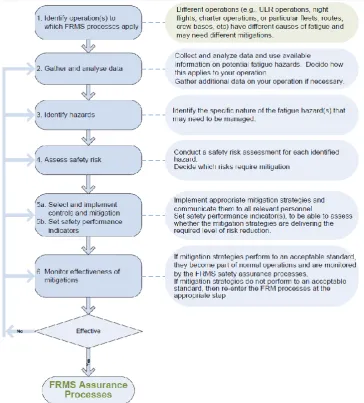
Figure 2. The steps of implementing an FRMS (IATA et al., 2011)... 13
Figure 3. Schematic representations of the one- and two-step models (Kandelaars et al., 2005) ... 15
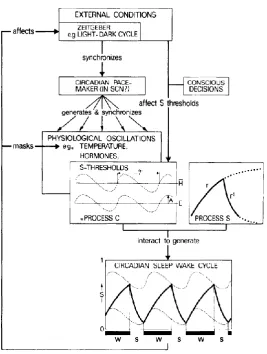
Figure 4. Scheme of the model by Daan et al. (1984) ... 16
Figure 5. Flight and sleep schedule of the first six weeks of the first scenario retrieved from SAFTE-FAST... 27
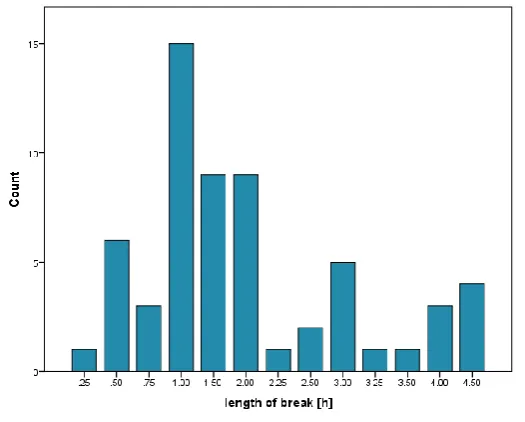
Figure 6. Frequency of the breaks between two flights in one shift. ... 28
Figure 7. Mean effectiveness of first and second flight of the shift as given by SAFTE-FAST... 29
Figure 8. Mean FI during the first and second flight of the three shifts of the first scenario ... 30
Figure 9. Percentage of the three colour categories per flight hour of SAFTE-FAST and FRI. ... 31
Figure 10. Percentage of the three colour categories per flight hour and shift of SAFTE-FAST and FRI. ... 31
Figure 11. Percentage of the three colour categories per flight hour of the first and second flight of all three shifts of a) SAFTE-FAST and b) FRI. ... 32
Figure 12. Percentage of the three colour categories per flight hour during the day and at night of all three shifts of a) SAFTE-FAST and b) FRI. ... 33
Figure 13. Percentage of the three colour categories per flight hour at night during the first and second flight of all three shifts of a) SAFTE-FAST and b) FRI. ... 34
Figure 14. Percentage of the three colour categories per flight hour of the first and second flight of all three shifts during the day of a) SAFTE-FAST and b) FRI. ... 35
Figure 15. Percentage of the three colour categories per weekday of SAFTE-FAST and FRI. ... 36
Figure 16. Percentage of the three colour categories per weekday and shift of SAFTE-FAST and FRI. 36 Figure 17. Percentage of the three colour categories per weekday and first and second flight of a shift of SAFTE-FAST and FRI. ... 37
Figure 18. Percentage of the three colour categories per weekday of flights during the day and night of SAFTE-FAST and FRI. ... 37
Figure 19. Percentage of the three colour categories per week of SAFTE-FAST and FRI. ... 38
Figure 20. Percentage of the three colour categories per break length in a shift and the flight thereafter of SAFTE-FAST and FRI. ... 38
Figure 22. Flight and sleep schedule of the first six weeks of the second scenario retrieved from
SAFTE-FAST... 39
Figure 23. Mean effectiveness of the SAFTE-FAST during the morning, afternoon and night shift of the second scenario ... 40
Figure 24. Fatigue Index (FI) during each flight time period of the second scenario ... 41
Figure 25. Mean value of the FI during the three shifts of the second scenario ... 41
Figure 26. Percentage of the three colour categories per flight hours of SAFTE-FAST and FRI. ... 42
Figure 27. Percentage of the three colour categories per flight hour and shift of SAFTE-FAST and FRI. ... 42
Figure 28. Percentage of the colour categories per flight hour and day or night flight of SAFTE-FAST and FRI. ... 43
Figure 29. Percentage of the three colour categories per weekday of SAFTE-FAST and FRI. ... 43
Figure 30. Percentage of each colour category per weekday and shift of SAFTE-FAST and FRI. ... 44
Figure 31. Percentage of each colour category per week of the second scenario of SAFTE-FAST and FRI. ... 44
Figure 32. Flight and sleep schedule from SAFTE-FAST of the second study. ... 50
Figure 33. Mean effectiveness score of the first and second flight of the three shifts of the second study ... 51
Figure 34. Percentage of the colour categories of the BAM and the SAFTE-FAST per flight hour of the second study. ... 51
Figure 35. Percentage of the three colour categories of the BAM and the SAFTE-FAST per flight hour and shift. ... 52
Figure 36. Percentage of the three colour categories per flight hour, flight of shift and shift of a) the BAM and b) the SAFTE-FAST. ... 53
Figure 37. Percentage of the three colour categories per weekday and shift of the BAM and the SAFTE-FAST... 54
Figure 38. Percentage of the three colour categories per week of the BAM and the SAFTE-FAST. ... 54
ABBREVIATIONS
Acronym Description
ASW Anti-Submarine Warfare
ASuW Anti-Surface Warfare
BAM Boeing Alterness Model
CSR Chronic Sleep Restriction
FDA Flight Data Analysis
FDP Flight Duty Period
FRI Fatigue/ Risk Index
FRMS Fatigue Risk Management System
FTL Flight Time Limitations
IATA International Air Transport Association
ICAO International Civil Aviation Organization
IFALPA International Federation of Airline Pilot’s Associations
ITS Index of Thermal Stress
KSS Karolinska Sleep Scale
NFH NATO Frigate Helicopter
NLR National Aerospace Centre
PVT Psychomotor Vigilance Task
SAFTE-FAST Sleep, Activity, Fatigue and Task Effectiveness model and
Fatigue-Avoidance Scheduling Tool
SAR Search And Rescue
SCN Suprachiasmatic nucleus
SMS Safety Management System
SP scale Samn-Perelli fatigue scale
TSD Total Sleep Deprivation
TST Total Sleep Time
TTH Tactical Troop Transport
INTRODUCTION
Most recently in 2015, the International Air Transport Association (IATA, 2015) presented fatigue as
an operation risk factor in aviation. It is a safety problem, “largely because of unpredictable work
hours, long duty periods, circadian disruptions, and insufficient sleep” (Samel, Wegmann & Vejvoda,
1995; Neville, Bisson, French, Boll & Storm, 1994; as cited in Caldwell, Mallis, Caldwell, Paul, Miller &
Neri, 2009, p. 29). Recent examples of the risk of fatigue are the incident of the Boeing 767 of Air
Canada on 14 January 2011 and the accident of the Boeing 737 in May 2010 (Ranter, 2012). In both
incidents, one pilot decided to sleep during the flight due to fatigue and was unable to handle a critical
situation in a proper way after waking up.
It is important to take fatigue into account when scheduling flights. Because of this, Fatigue
Risk Management Systems (FRMS) have been developed since the second half of the 20th century
(IATA, International Federation of Airline Pilots’ Associations (IFALPA) & International Civil Aviation
Organization (ICAO), 2011). Within an FRMS, operations are planned and employees are educated
about fatigue risks and how to avoid fatigue during worktime.
Since 2010, the Netherlands has the NH-90 helicopter, which is the substitute for the Lynx
helicopter of the Ministry of Defence. There are two versions of the medium-sized helicopter: the
Tactical Troop Transport (TTH) and the NATO Frigate Helicopter (NFH). The TTH version is primarily
used for transport and Search And Rescue (SAR). The primary roles of the NFH are Anti-Submarine
Warfare (ASW), Anti-Surface Warfare (ASuW) and SAR. It is a maritime weapon system (NHIndustries,
2006). Its technology is not only more up to date, but it also can fly longer than the previous helicopter.
The flight time increased from a maximum of three hours in the Super Lynx 300 (Agusta Westland,
2015) to a maximum of five hours in the NH-90 (NHIndustries, 2015). During operations, it is important
that the two pilots stay alert enough to operate the system. The resulting question is how the
increased flight time influences the fatigue level of the pilots and how high risk fatigue can be avoided
through Flight Time Limitations (FTL).
In this research, FTL for NH-90 pilots were investigated with the help of bio-mathematical
models. These models are designed for predicting fatigue based on given flight schedules. With this,
critical components of a schedule that result in severe fatigue can be identified. This research is
described in the following four sections: In section one, a literature review is given on fatigue in
aviation (see Appendix A for literature search criteria). The consequences of sleep deprivation on
cognitive skills are explained. For aviation, among other things, the FRMS has been designed for
dealing with fatigue of employees and ensuring their safety. The steps of how to implement a FRMS
are described in more detail. Its steps were used as a framework for this research. Besides, the
for testing flight schedules and their effects on fatigue. Next, the benefits of an FTL are highlighted
and an overview of the working hour act by the Royal Netherlands Air Force (2011) is given. Those
rules are currently used for scheduling flights and duties for the NH-90 pilots. Thereafter, the research
questions are given.
Two studies were performed: In section two, the first study is described. Two flight schedules
were tested with two bio-mathematical models and hazards were identified. It was analysed under
which circumstances a flight results in severe fatigue. With this knowledge, mitigation strategies for
avoiding severe fatigue were formulated.
In the next section, those mitigation strategies were evaluated in a second study using another
bio-mathematical model that can predict fatigue better for an individual. It was tested whether the
changes in the flight schedule result in less fatigue in two random pilots. The mitigations have also
been evaluated with a model from the previous study, because then the outcomes of both studies
could be compared better to each other.
In section four, the results of both studies are discussed. Recommendations are provided for
how to use the present results in scheduling flights in the future for NH-90 pilots. Besides, the
bio-mathematical models are compared to each other. Finally, some limitations of this research are listed.
FATIGUE IN AVIATION
FATIGUE
ICAO (2011; as cited in Gander et al., 2015, p. 110) defined crewmember fatigue as:
“a physiological state of reduced mental or physical performance capability resulting from
sleep loss or extended wakefulness, circadian phase, or workload (mental and/or physical
activity) that can impair a crew member’s alertness and ability to safely operate an aircraft or
perform safety-related duty”.
According to a pilot fatigue barometer by the members of the European Cockpit Association
(ECA, 2012), fatigue is a regular problem in the cockpit. The Vereniging van Nederlandse
Verkeersvliegers (VNV) asked 660 Dutch pilots to fill in a survey (ECA, 2012). The results showed that
72% of the pilots do not feel well rested after sleeping at night. During a flight, 65% of the pilots have
problems with heavy eyelids. Thirty percent have already experienced micro-sleep during duty time.
The pilots also reported, that they “have been involved or nearly avoided an incident or an accident
45 times in the past six months. In half of these events, fatigue was to blame” (ECA, 2012, p. 19). This
the next chapter, sleep deprivation is described in more detail since it is influencing fatigue
(Achermann, 2004). Besides, the effects of fatigue on pilots are explained.
CONSEQUENCES OF SLEEP DEPRIVATION ON COGNITIVE SKILLS
Caldwell, Caldwell, Brown and Smith (2004) tested in their experiment what the effect of 24 hours
wakefulness is on flight performance. Flight performance was measured on the basis of control errors
on precision instrument manoeuvres including airspeed, heading, vertical velocity, bank and
longitudinal bearing and glide slope. It was measured with Root Mean Squared Error (RMSE), with
which the observed value was compared to the commanded flight parameter. After a sleep loss of one
night, the number of errors on all measures together doubled and mood disturbances endangered
team work of the crew. Besides, information-processing capacity and reaction time decreased. After
24 hours of sleep deprivation, “levels of self-rated depression, confusion, and fatigue increased”
(Caldwell, 2012, p. 86). Also, Previc, Lopez, Ercoline, Daluz, Workman, Evans and Dillon (2009) found
in their experiment degraded flight performance when pilots were fatigued. Their performance
decreased by about 15%. Van Dongen, Caldwell and Caldwell (2006) investigated if the study by
Caldwell et al. (2004) showed individual differences. They concluded that people react differently to
sleep deprivation and score consequently differently on flight performance when they are fatigued.
They advised organizations to take that factor into account when scheduling flights.
Caldwell and Caldwell (2003; as cited in Caldwell, 2012) reported different cognitive
limitations of fatigued pilots. With increased fatigue, “accuracy and timing degrade, lower standards
of performance are accepted, the ability to integrate information from individual flight instruments
into a meaningful overall pattern declines, and attention narrows” (Caldwell & Caldwell, 2003; as cited
in Caldwell, 2012, p. 86). All in all, fatigue has a negative effect on the cognitive functioning of the
human. Especially in high-risk industries such as aviation it is important that the employee is as fit as
possible. Only then he or she can function properly and can handle critical situations well.
In Figure 1, a framework for explaining the relationship between fatigue and safety is shown
as reviewed by Williamson, Lombardi, Folkard, Stutts, Courtney and Connor (2011). Three factors can
influence fatigue: Time of day, Time/s awake and task-related factors. Through resting and/or
sleeping, fatigue is lowered and the safety increased. But when a person operates while he or she is
Figure 1. Framework for examining the relationship between fatigue and safety (Williamson et al., 2011).
FATIGUE RISK MANAGEMENT SYSTEM (FRMS)
The FRMS has been designed for high-safety operations for dealing with the risk of fatigue. It is a
data-driven system that is integrated in the Safety Management System (SMS). An FRMS has to make an
organization more resilient to fatigue (Cabon, Deharvengt, Berechet, Grau, Maille & Mollard, 2011).
On 29 January 2014, the airlines received a deadline for two years for implementing an FRMS
(Commission regulation (EU) No 83/2014, 2014). This has not happened everywhere until now,
especially not in the military. In an FRMS, operations are planned and employees are educated about
fatigue risks and how to avoid fatigue during worktime. The different processes for implementing an
FRMS are named slightly differently in the FRMSs, but contain all the same information (IATA et al.,
2011; Office of Rail Regulation, 2012; NHVR, 2014):
1) Identifying the operations covered,
2) Gathering data and information,
3) Hazard identification,
4) Risk assessment, and
5) Risk mitigation.
In Figure 2, a description of the steps of implementing an FRMS is shown. First, it should be clear
for which operations the FRMS is needed. The data of those operations are gathered and analysed by
the organization and the hazards are identified. Hazard identification contains predictive, proactive
and reactive processes. They all are about gathering information and data for monitoring levels of
fatigue risk in the covered operations. Predictive hazard identification processes focus on how to
schedule flights with as few factors as possible that contribute to fatigue and sleep. Using previous
experiences of the pilots, evidence-based scheduling practices and/or bio-mathematical models, the
monitored by “self-reporting of fatigue risks, crew fatigue surveys, relevant flight crew performance
data, available safety databases and scientific studies, and analysis of planned versus actual time
worked” (IATA et al., 2011, p. 12). Reactive hazard identification processes focus on how fatigue of
crewmembers contributed to specific events. For this, “fatigue reports, confidential reports, audit
reports, incidents, and Flight Data Analysis (FDA) events” (IATA et al., 2011, p.18) are analysed. Next,
a risk assessment is executed for every hazard found. After identifying hazards that need to be
mitigated, strategies are selected and implemented by the organization. The effect of the
implementations is evaluated afterwards. If they are not effective, the FRMS process needs to be
re-entered (IATA et al., 2011). The steps of the FRMS are used for evaluating new flight schedules or
[image:13.595.124.489.293.697.2]current flight schedules when they seem to result in fatigue.
BIO-MATHEMATICAL MODELS
The bio-mathematical models are a tool used in the predictive hazard identification process in the
FRMS. With these models, the flight schedule of pilots can be tested and time intervals with a possible
high fatigue risk can be detected. Airlines cannot fully rely on bio-mathematical models since they
predict the fatigue level of the average person and not of an individual (Abe, Mollicone, Basner &
Dinges, 2014). Currently, they are used as an aid in aviation when scheduling duties (IATA et al., 2011).
CIRCADIAN RHYTHM
The predictions of the current bio-mathematical models are largely based on the circadian rhythm.
The 24-hour physiological and behavioural rhythm is maintained by the suprachiasmatic nucleus (SCN)
in the hypothalamus. The SCN keeps the solar cycle and the local clocks of different brain regions,
“and peripheral organs such as the liver, kidneys and heart in synchrony” (Kyriacou & Hastings, 2010,
p. 260). The rhythm governs “sleep/wakefulness, motor activity, hormonal processes, body
temperature, performance, and many other factors” (Rosekind, Gander, Miller, Gregory, Smith,
Weldon, Co, McNally & Lebacqs, 1994, p. 327). There is a positive correlation between core
temperature, circadian position and sleep/ wakefulness and the factors named above. Between 3 am
and 5 am the core temperature is typically the lowest, which “is associated with sleep, low motor
activity, decreased performance and worsened mood” (Rosekind et al., 1994, p. 327-328). This time
period is also named Window Of Circadian Low (WOCL, Commission Regulation (EU) No 83/2014,
2014).
A disturbance of the circadian rhythm may result in desynchronization between the
physiological systems (Rosekind et al., 1994). Such a disturbance happens when multiple time zones
are crossed during trans-meridian flights, which causes a ‘jet lag’. In these cases, there is a mismatch
between internal and external clocks. The effects of a jet lag depend on how many time zones have
been crossed and in which direction that was. “After flights across more than five time-zones, the
mean re-entrainment rates are 50% higher after westbound than after eastbound transitions” (Klein
& Wegmann, 1980; as cited in Samel, Wegmann & Vejvoda, 1995, p. 31). Jet lag may result in “daytime
tiredness, difficulty initiating sleep at night (after eastward flight) or early awakening (after westward
flight), disturbed night-time sleep, impaired daytime alertness and performance, gastrointestinal
problems, loss of appetite, and inappropriate timing of defecation and urination” (Arendt, Stone &
Skene, 2000; as cited in Rajaratman & Arendt, 2001, p. 1001).
Rouch, Wild, Ansiau and Marquie (2005) studied the long-term effect of circadian rhythm
62 years were assessed. In the male workers, they observed a significant difference in immediate recall
between people who had worked in shifts between ten and twenty years and people with less than
five years of experience in shift work. People who had worked in shifts longer than ten years had an
impaired immediate recall. It is not clear to what extent age contributes to this difference.
De Mello, Esteves, Pires, Santos, Bittencourt, Silva and Tufik (2008) investigated the
relationship between number of errors made by Brazilian airline pilots and time of day. They divided
the day into morning (6:00-11:59), afternoon (12:00-17:59), night (18:00-23:59) and early morning
(0:00-5:59). The most errors (9.47) per 100 h flight time occurred during the early morning between
midnight and 6am, the average being 6.86 errors per 100 h flight time during the whole day. The
numbers reflect the consequences of the circadian rhythm on the performance during the early
morning because of the low core temperature.
ONE- AND TWO-STEP MODELS
There are and two-step bio-mathematical models (Darwent, Dawson & Roach, 2010). In the
one-step models, predictions of fatigue, alertness, performance or risk estimates of each work hour are
based on work and sleep times. A disadvantage of this approach is that organizations do not always
“have access to sleep records for employees” (Dorrian, Darwent, Dawson and Roach, 2012, p. 18).
Also, the predictions are retrospective. The inputs for two-step models are work and rest times
(Gunzelmann, Gross, Gluck & Dinges, 2009). Based on this information, sleep times and consequently
fatigue levels are estimated. According to Darwent et al. (2010), those models are more appropriate
for the use in organizations, because the predictions depend greatly on the sleep estimates (Dorrian
et al., 2012). A schematic representation of both models by Kandelaars et al. (2005) is shown in figure
3.
Figure 3. Schematic representations of the one- and two-step models (Kandelaars et al., 2005).On the left side, the one-step model is shown. Based on given duty and sleep times, the fatigue level is calculated. On the right side, the two-step model
UNDERLYING PROCESSES
Bio-mathematical models are based on sleep homeostasis (process S) and circadian rhythmicity
(Process C; Daan, Beersma & Borbély, 1984). The circadian rhythm is a sinusoidal function with a
24-hour period. Process S shows how fatigued somebody is. When S is higher than the high threshold H,
sleep occurs. When S is smaller than the low threshold L, a person wakes up. The thresholds H and L
are ‘noisy’ since they are not fixed points (Wever, 1979; as cited in Kandelaars et al., 2005). When
sleeping, the value of process S is decreasing and when awake, the value of process S is increasing.
The homeostatic component in a model is either exponential (Folkard & Åkerstedt, 1992; as cited in
Kandelaars et al., 2005), broadly linear (Hursh et al., 2004) or its equation contains the derivative of
the Gaussian equation (Jewett & Kronauer, 1999). A scheme of the model by Daan et al. (1984) which
[image:16.595.122.390.314.669.2]served as a basis of today’s models is shown in figure 4.
Figure 4. Scheme of the model by Daan et al. (1984).The scheme shows the different processes that are contributing to the circadian sleep wake cycle.
Folkard et al. (1992; as cited in Kandelaars et al., 2005) introduced in their model process W
cognitive and physical functioning. We can also differentiate between two and three process models.
Today’s bio-mathematical models are designed for predicting alertness, fatigue, performance,
vigilance and sleep latency and sleep length (Kandelaars et al., 2005).
BIO-MATHEMATICAL MODELS VALIDATED IN AVIATION
The Civil Aviation Safety Authority (CASA) of the Australian Government (2014) found seven
bio-mathematical models validated in aviation and described and evaluated them. Also, the NLR
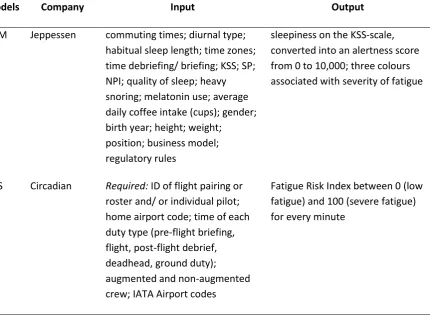
developed a bio-mathematical model in 2013. In Table 1, input and output data are summarized for
all eight models.
Although the limitations of current bio-mathematical models are known, the flight time
schedules for the NH-90 have been tested with them. Flight time testing with real pilots would have
cost too much time and money. Besides, defence would not have had the capacity for researching
fatigue and FTL with the NH-90 for a longer time period. With the models, different situations could
be tested at any time. Because the models are currently used by airlines, advice could also been given
[image:17.595.92.523.426.741.2]on the optimal use by defence.
Table 1. Short Description of Eight Bio-Mathematical Models Validated in Aviation.
Models Company Input Output
BAM Jeppessen commuting times; diurnal type; habitual sleep length; time zones; time debriefing/ briefing; KSS; SP; NPI; quality of sleep; heavy snoring; melatonin use; average daily coffee intake (cups); gender; birth year; height; weight;
position; business model; regulatory rules
sleepiness on the KSS-scale, converted into an alertness score from 0 to 10,000; three colours associated with severity of fatigue
CAS Circadian Required: ID of flight pairing or roster and/ or individual pilot; home airport code; time of each duty type (pre-flight briefing, flight, post-flight debrief, deadhead, ground duty);
augmented and non-augmented crew; IATA Airport codes
Optional: sleep data from
actigraph or log recording; import of Excel files; manual entry of flight-rest schedule data
FAID InterDynamics Time and duration of duty and breaks; work history in the preceding seven days
Apparent Fatigue Tolerance Level (the score below which 98% of historical hours were worked); traffic-light coloured FAID Conditions representing increasing levels of risk; risk matrix view of individuals; graphical representation of risk against activity; tabular and graphical outputs; ranking shifts by Key Performance Indicator (KPI); filtered view of non-compliant work periods; annual KPI trends; staff utilisation reports; work pattern profiles
FRI UK
government
time of day; duty time; commuting time; workload; attention
Fatigue Index: estimated average probability, multiplied by 100, of a value of seven or more on the KSS (a 9-point scale)
Risk Index : relative risk of making an error that could contribute to an injury or accident
SAFE Fatigue Risk Manager
Required: pilot schedule
Optional: sleep times
Samn Perelli (SP) fatigue scores (a 7-point scale) throughout the duty period (although options exist for other scales including Karolinska and 100 point alertness scales). A forecasted fatigue score is generated every 15 minutes and predicts likely sleep patterns.
SAFTE-FAST Institute for Behavior Resources, Inc.
consideration of unlimited time zone changes with waypoints and airport codes; crewing and not crewing (flight time, ground duties, deadheading, etc.); augmentation and split duties; briefings and de-briefings;
times between flights; variable commute times (option); PVT; duty times; sleep times (optional)
Manager Table, Summary File and Visual FAST Graphic
SWP Karolinska Institute/ Stress Research Institute Stockholm University, Sweden
Required: shift schedule
Optional: individual sleep patterns
predicted alertness curve in the form of the 1-21 point generic scale or the Karolinska Sleepiness Scale (KSS; 1-9); proportion of total time or work time in which sleepiness levels are above the critical limit
FRAT NLR position in aircrew; activity (on flight duty, standby, off duty); Acd code; duty time; aircraft type; airport; off-blocks; on-blocks; aircraft function
KSS-scale; graph with duty and sleep blocks
FLIGHT TIME LIMITATIONS FOR NH-90 PILOTS
FLIGHT TIME LIMITATIONS (FTL)
In the predictive hazard identification process of the FRMS, flights with a minimum of fatigue risk are
identified and scheduled. This is done with the help of FTL. In their study, Banks, Avers, Nesthus and
Hauck (2012) compared FTLs of different countries and airlines with each other. They collected all
definitions of different aspects concerning the FTL from the found literature and summarized them.
The definitions are given in Table 2. They make a difference between duty time, flight time and
different rest periods. The aircraft operator/ certificate holder is in charge of reducing or maximizing
duty times or rest periods according to specific rules.
Table 2. Definition of Different Concepts of FTLs as Found by Banks et al. (2012, p. 22)
Terms Definition
Flight and duty time period The time between reporting for an assignment and release from
that assignment. A continuous period of duty in which a flight
attendant carries out any task associated with the business of an
Flight time limitation period A continuous period of duty commencing when the aircraft begins
a flight segment, moving on its own, and finishes after the aircraft
comes to a stop after a flight segment.
Reduced rest period A continuous period of time during which the flight attendant is
free from all restraint by a certificate holder reduced to the
maximum limitation due to unforeseen circumstances.
Day off A period of at least 24 h available for leisure and relaxation free
from all duties.
Standby/reserve duty An aircraft operator/certificate holder places restraints on a flight
attendant who would be off-duty. The flight attendant is subject
for assignment to duty and must be ready for duty.
Commander’s/captain’s
discretion
The pilot in command may exceed the FDP or reduce the rest time
in certain circumstances.
Fatigue responsibility To whom the responsibility lies to guard against fatigue. An
individual may refuse to work if fatigued.
Note. These definitions have been formulated by Banks et al. (2012, p. 22) after analysing different FTL rules of different countries and airlines. Only definitions that are important for this paper were included.
Simons, Wilschut and Valk (2011) investigated the influence of workload and fatigue on alertness
of pilots who fly helicopters in the area of the Dutch North Sea. They tested the vigor, alertness,
sleepiness and vigilance of 24 pilots during each flight duty period (FDP). The longer they had to fly,
the lower their vigilance score was halfway the duty and at the end. Besides, there was a positive
correlation between age, tracking error and reaction time. Older pilots had more difficulties with the
vigilance tasks, but reacted the same as their younger colleagues on the influences of workload and
fatigue on task performance. Pilots got on average one hour and a half less sleep when their duty
began in the morning before 12 am instead of after 12 am. Also, start of duty was associated with level
of sleepiness and vigilance halfway the duty and at the end of a FDP. When their FDP started before
12 am, they were sleepier and less vigilant at the end of the duty than pilots who started later.
It is important that flights are scheduled in such a way that time of FDP and total sleep time (TST)
do not have too much influence on the flight performance of a pilot. Pilots of a helicopter “have to
cope with difficult operational and environmental conditions, such as noise, vibrations, in-flight paper
work, poor landing facilities, limited air traffic control facilities, limited radar coverage, bad weather,
and turbulence around offshore platforms” (Simons et al., 2011). Maximum safety has to be achieved
by optimal flight schedules and therefore fit pilots. In organizations without an FRMS, flights are
fatigue levels of crews and in future hopefully to the fatigue levels of individuals. This approach is
more dynamic and resilient (Cabon et al., 2011).
CURRENT FTL FOR NH-90 PILOTS
The Royal Netherlands Air Force (2011) has formulated special rules for duty and rest times of
helicopter pilots. They are only applicable when the employees are flying an aircraft, sailing on a ship
or boat or participating in an exercise. Other rules for standby and alert duties are given by the Dutch
working hours act by the Ministry of Social Affairs and Employment (Ministerie van Sociale Zaken en
Werkgelegenheid, 2010). The rules by the Royal Netherlands Air Force (2011) have originally been
designed for the Lynx helicopter, but they are also used for the NH-90. In 24 hours, fourteen hours of
duty time are allowed with a maximum of ten hours of flight duty time. After that, there is a rest time
of minimal ten hours, of which eight hours are reserved for uninterrupted sleep. In seven days, pilots
are allowed to fly in total 39 hours. There needs to be a break of at least 24 hours, at least once per
week.
The number of hours of flight time depends on the circumstances. When flying at night without
night vision equipment, the flight time is the actual flight time in hours times 1.5. When using night
vision equipment, the actual flight time is multiplied by the factor two. The duty time of 14 hours can
be extended to 16 hours on naval vessels. This is an exception. The other rules concerning breaks and
total flight time in seven days still apply.
When flying in a helicopter without air-conditioning the flight time can be reduced from ten to
eight hours. The Royal Netherlands Air Force (2011) has a table with a caution range which depends
on temperature and humidity of the air. If the Index of Thermal Stress (ITS)is in the danger zone, flight
time is reduced to six hours. When the ITS is even beyond the danger zone, only the Flight Surgeon
can decide if there will be a flight or not. Besides, flight time is reduced when it is colder than -18˚C.
Under -25˚C pilots are not allowed to fly because of too high risks for material and personnel.
When crossing time zones, the pilots start working after a minimal 8-hour flight on the second
day of arrival. After a long distance flight without crossed time zones, there is a rest time of 36 hours.
The commander has always the right to make exceptions for the FTL.
RESEARCH QUESTIONS
In this research, the different steps of the FRMS were followed for identifying factors that may
contribute to severe fatigue in NH-90 pilots. The first step is identifying operations to which the FRMS
this, the resulting fatigue of flights in the morning, afternoon and night shift, two flights in a shift,
flights at night, and flights with different lengths were investigated. The data were gathered through
designing two flight schedules which are based on the work hour act by the Royal Netherlands Air
Force (2011). The schedules contain extreme and lessextreme work hours. In the first study, the
hazards were identified using bio-mathematical models, the safety risks were assessed and mitigation
strategies were formulated. In the second study, the effectiveness of the mitigations was evaluated
also with bio-mathematical models. The results were used for a recommendation for adjusting the
current working hour act by the Royal Netherlands Air Force (2011) to the NH-90.
The following descriptive research questions were answered:
1. Which flight schedule results in a too high fatigue level according to the criteria of an individual
bio-mathematical model?
2. What changes are needed in the current work hour act by the Royal Netherlands Air Force
(2011) for NH-90 pilots for ensuring an acceptable fatigue level at all times?
3. Which available bio-mathematical model is the most suitable aid for planning flights for
NH-90 pilots in an FRMS?
STUDY 1: IDENTIFYING HAZARDS
METHODS
BIO-MATHEMATICAL MODELS IN AVIATION
Two bio-mathematical models were used for identifying the hazards in the two flight schedules. The
SAFTE-FAST (Sleep, Activity, Fatigue and Task Effectiveness model- Fatigue Avoidance Scheduling Tool)
and the FRI (Fatigue/ Risk Index) were both available at the NLR and were therefore chosen for this
study. Both models are described in more detail beneath.
SLEEP, ACTIVITY, FATIGUE AND TASK EFFECTIVENESS MODEL (SAFTE)
SAFTE is a bio-mathematical model that is integrated in the software FAST. It considers the following
variables as input: unlimited time zone changes with waypoints and airport codes, augmentation and
split duties, variable commute times and typical length and time of sleep. The model predicts cognitive
performance based on “multi-oscillator circadian phase, a circadian sleep propensity process, a sleep
fragmentation process, a circadian phase adjusting feature for time zone changes, regulation of the
homeostatic sleep process resulting from chronic sleep restriction, and a factor that adjusts the rate
manually enter the sleep times or to let the model calculate it. SAFTE can be used as one- or
two-process model. It has a Manager Table, Summary File and Visual FAST Graphic, which shows duty time
and critical time below an adjustable fatigue risk criterion line. Output variables are cognitive
effectiveness, arcophase and sleep reservoir. The output variables were compared to the data of a
study by Angus and Heslegrave (1985) about the effects of TSD. The predictions of the SAFTE-FAST
was quite good: R2= .98. Besides, the output was compared to studies about chronic sleep restriction
and railroad accidents where it also scored well (FAST, 2000).
Cognitive effectiveness of an average person is given as a percentage score. It is influenced by
the sleep reservoir, the circadian rhythm and sleep inertia. A score of 100% is the “baseline
performance of when well rested” (FAST, 2000). This baseline is retrieved from performances on
standard cognitive tests. The effectiveness score can be used for estimating vigilance speed, reaction
time, lapses in attention and target error. The model distributed the scores in three groups: The green
area is 90-100%, the yellow area is 65-90% and the red area is under the effectiveness score of 65%.
An effectiveness score in the red area is associated with severe fatigue and doubled reaction time.
The value of arcophase indicates when the circadian rhythm is at its peak. The sleep reservoir is the
performance capacity of a fully rested person. When awake, the sleep reservoir decreases in the
fashion of a linear performance use function. When sleeping, units are added to the reservoir each
minute. The value of the added unit is influenced by the circadian variation and the reservoir deficit.
The SAFTE model expresses the circadian process as a combination of a cosine function with
a 24 h period and one with a 12 h period. With this, a low rise in the day, a plateau in the afternoon
and a fast decrease in the evening are achieved.
C(t) = cos(2π (T – p)/ 24 + βcos(4π(T – p – p’)/ 24)
Here, “T is the time of day in hours, p is the time of the peak of the 24 h rhythm, p’ is the relative time
of the 12 h peak, and β is the relative amplitude of the 12 h rhythm” (Hursh et al., 2004).
FATIGUE/ RISK INDEX (FRI)
The FRI by the UK Health and Safety Executive (2006) is a free Excel sheet which can be retrieved from
http://www.hse.gov.uk/research/rrhtm/rr446.htm. With the fatigue and risk score, different shifts
can be compared to each other. Input variables are time of day, shift duration, rest periods, breaks,
commuting time, level of workload and level of attention (scale is shown in Table 3). It is a two-process
model, because it predicts the sleep times automatically. The output is expressed in three
components. The cumulative component represents a particular shift in relation to the pattern of the
preceding shifts. Based on datasets of previous studies, a score on the Karolinska Sleep Scale (KSS) is
a nine-point Likert scale for self-estimating fatigue and varies from 1= ‘very alert’ to 9= ‘very sleepy,
fighting sleep, an effort to keep awake’. The second component is associated with the duty timing. It
takes the effect of start time, shift length and the time of day throughout the shift into account. The
job type/ breaks component is associated with the content of the shift, with the activities and the
breaks in the shift. The first two components were validated with data from aviation (CASA, 2014). All
components are expressed as the probability of an eight or nine on the KSS, which stands for very
sleepy, great effort to stay awake and fighting sleep.
Table 3. Workload and Attention Scale of the FRI
Workload Attention
Extremely demanding, no spare capacity All or nearly all the time
Moderately demanding, little spare capacity Most of the time
Moderately undemanding, some spare capacity Some of the time
Extremely undemanding, lots of spare Rarely or nearly none of the time
The fatigue index is calculated with the three indices, using the formula
FI = 100 { 1 – (1-C) (1-J-T) },
where C is the cumulative component, J the job type/ break component and T the duty timing
component. The resulting fatigue index is the value of the KSS multiplied by hundred. The higher the
fatigue index, the higher the chance of microsleep. A score of thirty says that there is a chance of 30
% that someone has a score of eight or nine on the KSS. HSE (2006) does not give threshold scores for
fatigue as it is seen in the SAFTE with the colour categories.
The risk index (RI) is the probability that an error will be made that could result in an accident.
It is calculated with the formula
R = (C * T * J),
where the components C, T and J take other values than in the fatigue risk since they are calculated
for the risk index. An RI of 1 represents the average risk on a typical two-day, two-night, four-off
schedule, involving 12-hour shifts starting at 08:00 and 20:00. If the index is 2, the risk is doubled. The
RI has not been explicitly validated in aviation (Health & Safety Executive (HSE), 2006). Only the FI has
been used further in this research.
SCENARIOS
Flight and duty schedules were designed for a time period of twelve weeks. This time interval was
contained a morning, afternoon and night shift. The morning shift began at 8 am, the afternoon shift
at 4 pm and the night shift at 12 pm. The shifts rotated every week. With this, the effect of the
circadian rhythm on fatigue could be tested. The schedules were based on the working hour act by
the Royal Netherlands Air Force (2011) as described above. One scenario had more and the other one
had less flight hours.
The first scenario contained the maximal flight time periods of ten hours a day, 39 flight hours
per week and the shortest breaks which are allowed by the Royal Netherlands Air Force (2011). With
this, the applicability of the given rules was tested. It was investigated if additional rules for avoiding
severe fatigue are needed.
The second scenario was based on a working week of forty hours with 25 flight time hours. Five
times a week, a flight of five hours was scheduled. According to experts of the NLR, NH-90 pilots fly
regularly once or twice a day for a few hours in their theatre of operations. Because the first scenario
contained two flights a day, this scenario investigated the effect of flying five hours a day.
The time between 10 pm and 6 am was considered as night-time. In the two scenarios, the pilot
used night vision equipment. The actual flight time was weighted with the factor two at night in
conformance with the FTL of the Royal Netherlands Air Force (2011). The flight schedules were
designed in such a way that there was no significant difference (α= .05) in number of flight hours
between the shifts and in the first scenario between the first and second flight in a duty. With this
construction, confounding variables for further analysis were reduced.
The SAFTE-FAST required sleep times. The standard sleep time was 11 pm until 6 am before duties
and 11 pm until 6:30 am before free days. Those sleep lengths were the average sleep times of the
helicopter pilots who took part in the study by Simons et al. (2011). When there was a duty at this
time, sleep time began two hours after end of duty. The sleep environment was estimated as excellent
which means that there is no sleep interruption.
The FRI requires information concerning the subjective level of cognitive workload. At this
moment, there is no study about the actual cognitive workload of a NH-90 pilot neither in a simulator
nor in real since it is nearly impossible to measure it in an unobtrusive manner during flying. For this,
the flying process is too complex (Besson, Bourdin, Bringoux, Dousset, Maïano, Marqueste, Mestre,
Gaetan, Baudry & Vercher, 2013). Due to the complexity, cognitive workload was estimated as high.
All or nearly all the time it requires continuous attention (see Table 3 for the scales).
Two flight scenarios were designed and entered into the SAFTE-FAST and FRI. Only the actual flight
time periods were marked as duty times, because this research is about the consequences of
prolonged flight time. The resulting fatigue levels were analysed as described beneath.
ANALYSIS
The two scenarios were described using descriptive statistics. It was checked whether the three shifts
contain the same number of flights and flight hours. The different schedules were analysed with the
two bio-mathematical models SAFTE-FAST and FRI. First, the output of the models was investigated.
The characteristics of the three shifts and the first and second flight of a shift were analysed.
Only the scores of cognitive effectiveness of the SAFTE-FAST were further processed. SAFTE-FAST
gave one effectiveness score for every flight minute. Because the flight times of the night flights are
multiplied by two, flights which are official four hours long have only the amount of data of two hours.
The data sets of every night flight have been doubled to give them the same weight in the analyses as
the other flights. The output of every half hour of a flight is in one group. With this, the development
of the effectiveness score during a flight could be shown. The model divides the effectiveness scores
into a green, yellow and red category. The characteristics of the effectiveness scores of the different
categories were described. The results showed under which conditions effectiveness is most likely in
the red area. Because this paper is among others about conditions resulting in severe fatigue, the
further focus lied on the effectiveness scores in the red area.
Only the FI of the FRI was used since this research is more about fatigue and less about risks. The
FRI gives one FI per flight time period. For investigating extreme fatigue scores, the FI was divided in
three colour categories: Scores of 15 or less are in the green category and scores between 15 and 30
are in the yellow category. All scores above 30 are in the red category. An FI of 30 or higher was
associated with the red area, because it indicates a chance of at least 30 % for pilots to score an 8 or
9 on the KSS. The characteristics of the FI of the different colour categories have been described.
Histograms have been designed that show per half hour the percentage of the different colour
categories. With this, the development of severe fatigue could be shown through increasing flight time
divided over the three shifts, the first and second flight of a shift, night or day flight, weekdays and
during the twelve weeks of the schedules. Also, the development of severe fatigue was displayed for
the different break lengths before the second flights of a shift. The percentage of the colour categories
is the outcome of this research, but can also be associated with the chance that a flight results in a
RESULTS
FIRST SCENARIO
DESCRIPTION OF THE SCENARIO
The schedule of the first scenariowas 82 days long and had 120 flight time periods. The duty time
periods were between eight and fourteen hours long (M= 10.68; SD= 1.85) and were organized in
shifts. The duties were on the first five days of the week, the other two were free. During all duty time
periods the pilot was flying two times. There were four different schedules that were used once in
every shift. All flights were between two and five hours long (M= 3.9; SD= 1.04). The flight time did
not differ between the first and second flight of a duty (M= 3.9; SD= 1.04). Also, the flight times of the
three shifts did not differ. They were all between two and five hours long (M= 3.9; SD= 1.06). About
43.3 % of the flights were at night. Of the afternoon shift, 45 % of the flights were at night and 85 %
of the flights of the night shift were between 10 pm and 6 am (see Figure 5 for the flight schedule).
Figure 5. Flight and sleep schedule of the first six weeks of the first scenario retrieved from SAFTE-FAST. The blue colour marks the sleep time and the black colour the flight time periods.
Thirty percent of the flights were three hours or shorter. This was the maximum flight time of the
previous helicopter. Twenty-five percent of the flights were between 3.5 and 4.5 hours long.
Thirty-five percent of the flights were Thirty-five hours long, which is the maximum flight time of the NH-90 (see
Table 4). With this distribution the consequences of different flight lengths on fatigue could be tested.
Table 4. Frequency and Percentage of Different Flight Hours
Frequency 12 6 18 18 12 12 42
Percentage 10 5 15 15 10 10 35
The breaks are between 0.25 and 4.5 hours long (M= 1.85; SD= 1.19). They are the shortest in the
morning shift (M= 1.4; SD= .91), longer in the night shift (M= 1.25; SD= .73) and the longest in the
afternoon shift (M= 2.9; SD= 1.13). 41.7 % of the breaks are maximal one hour long, 35 % is longer
than one hour and shorter than three hours and 23.4 % is between three and 4.5 hours long (see
[image:28.595.158.421.253.464.2]Figure 6).
Figure 6. Frequency of the breaks between two flights in one shift.
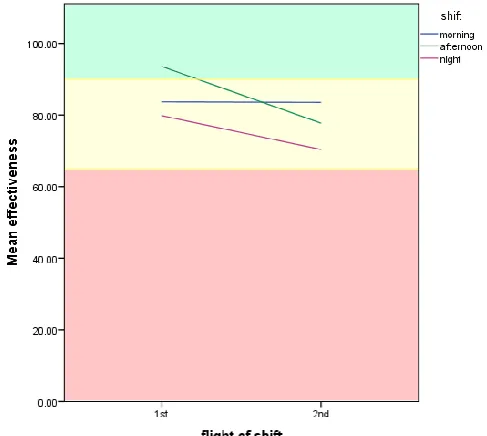
SAFTE-FAST
During the first flight of a shift, mean effectiveness of SAFTE-FAST was the highest in the afternoon
shift and the lowest in the night shift. During the second flight, mean effectiveness was the highest in
the morning shift and the lowest in the night shift. The scores of the first flight of the afternoon shift
Figure 7. Mean effectiveness of first and second flight of the shift as given by SAFTE-FAST. The graph is showing the mean effectiveness during the first and second flight of each of the three shifts with the thresholds of the three colour categories
in the background.
The effectiveness scores had a range from 61.13 to 97.50 (M= 81.45; SD= 10.22). In the
morning shift, the effectiveness score was between 70.16 and 97.50 (M= 83.61; SD= 8.59). In the
afternoon the score lay between 61.26 and 97.18 (M= 85.65; SD= 9.99). In the night shift, the score of
effectiveness was between 61.13 and 96.21 (M= 75.10; SD= 8.80). During the first flight of a shift,
effectiveness had a score between 62.21 and 97.18 (M= 85.70; SD= 8.90). During the second flight the
score lay between 61.13 and 97.50 (M=77.21; SD= 9.69).
Most of the flight minutes were in the yellow area (66.3 %), while the others were either in
the red area (4.2 %) or in the green area (29.5 %). Eighty-three percent of the red-marked flight
minutes were in the second flight of a shift, 78.6 % of the flight minutes were in the night shift and
42.9 % of the red flights were at night.
FRI
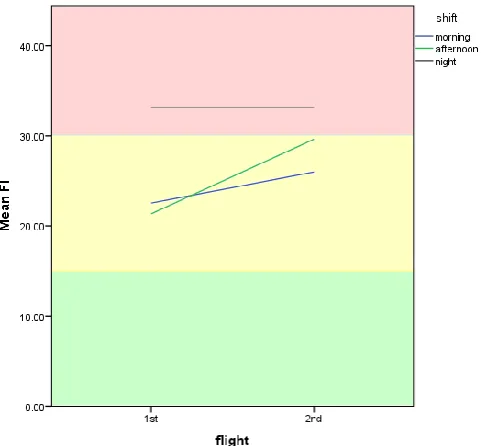
The mean Fatigue Index (FI) of the morning and afternoon shift were higher during the second flights.
The FI of the night shift stayed constant. Besides, the FI was the highest during the night shifts, lower
during the afternoon shifts and the lowest during the morning shifts. The mean FI of the night shift
laid in the red area. The mean FIs of the morning and afternoon shift were in the yellow area (see
Figure 8).
During the morning shifts the FI was between .8 and 32.1 (M= 24.26; SD= 8.56), during the
between 31.6 and 34.1 (M= 33.13; SD= .71). In the first flight of a duty period the FI was between .8
and 34.1 (M= 25.67; SD= 9.14) and in the second flight it was between 8.7 and 34.1 (M= 29.58; SD=
5.48). During the night, FI was between 21.10 and 34.10 (M=31.99; SD= 2.77) and during the day it
was between .80 and 33.10 (M= 24.29; SD= 8.66).
Of all flights, 53.3 % were in the red area, 35.8 % were in the yellow area and 10.8 % were in the
green area. 74.07 % of the flights in the red area were in the night shift. Besides, 43.8 % of the
[image:30.595.162.405.232.455.2]red-marked flights were at least 4.5 hours long.
Figure 8. Mean FI during the first and second flight of the three shifts of the first scenario. In the background, the thresholds of the three colour categories are shown.
DEVELOPMENT OF SEVERE FATIGUE
DEVELOPMENT OF FATIGUE DURING A FLIGHT
First, the development of severe fatigue during a flight was investigated. According to SAFTE-FAST,
there was a rise in severe fatigue in the fifth flight hour from 5.9 % to 10.5 % (see Figure 9). In the
morning shift, there was no red-marked flight. In the afternoon shift, there was an increase of severe
fatigue from the third until the fifth flight hour (14.3 %). In the night shift, there was an increase of
severe fatigue in the fifth hour from 6.7 % to 15.7 % (see Figure 10).
The FRI predicted that 53.3 % of the flights result in severe fatigue. Those flights were dominant
in all flight lengths (see Figure 9), but were mostly found in the night shift (see Figure 10). There was
seen in the fifth hour, especially during the afternoon and night shift. The results of SAFTE-FAST
[image:31.595.158.424.130.343.2]showed a more clear development than the FRI.
Figure 9. Percentage of the three colour categories per flight hour of SAFTE-FAST and FRI.
Figure 10. Percentage of the three colour categories per flight hour and shift of SAFTE-FAST and FRI.
TWO FLIGHTS IN ONE SHIFT
Next, it was examined whether there is a difference in the development of fatigue during a flight
between a first and a second flight of a shift. In the second flight of the afternoon shift, there was
more severe fatigue from the third flight hour on according to SAFTE-FAST. Both flights of the night
shift contained severe fatigue, but it was most obvious during the second flight. First the percentage
[image:31.595.176.436.386.591.2]flights resulted in severe fatigue, but after five hours that percentage increased to 14.7 %. During the
first flight of the night shift, the percentage increased from 5.3 % after 2.5 hours to 13.3 % in the fourth
hour. After 4.5 hours 5.9 % of the flights resulted in severe fatigue and after five hours it increased to
16.5 % (see Figure 11a).
The FRI showed severe fatigue in all flights of the night shift and mostly during the second
flight of the morning and afternoon shift. There was no pattern found in the development of severe
fatigue during increased flight length (see Figure 11b).
Figure 11. Percentage of the three colour categories per flight hour of the first and second flight of all three shifts of a) SAFTE-FAST and b) FRI.
In conclusion, SAFTE-FAST predicted severe fatigue especially during the second flights of the
afternoon and night shift. Also, the first flight of the night shift resulted in severe fatigue. There was a
NIGHT AND DAY FLIGHTS
According to SAFTE-FAST, severe fatigue occurred mostly in flights during the day in the night shift.
This percentage decreased from 66.7 % in the first half hour to 0 % in the fourth hour. During the night
of an afternoon shift, the percentage increased from 2.7 % after three hours to 28.6 % in the fifth
hour. During the night flights of the night shift severe fatigue increased from 8 % after 4.5 hours to
18.7 % in the fifth hour (see Figure 12a). The FRI predicted severe fatigue for all flights of the night
shift and for most of the flights at night of the afternoon shift (see Figure 12b).
Figure 12. Percentage of the three colour categories per flight hour during the day and at night of all three shifts of a) SAFTE-FAST and b) FRI.
When a flight was at night, severe fatigue occurred in 5.3 % of the first flights of the night shift
after 2.5 hours and in 13.3 % of the flights after four hours. After 4.5 hours the percentage decreased
afternoon shift at night, the percentage of severe fatigue increased from 2.7 % after three hours to
28.6 % after five hours. In the second flight of the night shift at night, the percentage of severe fatigue
increased from 1.9 % after four hours to 25 % after five hours (see Figure 13a). The FRI predicted
severe fatigue for all flights at night in the night shift and for most of the second flights at night of the
afternoon shift (see Figure 13b).
Figure 13. Percentage of the three colour categories per flight hour at night during the first and second flight of all three shifts of a) SAFTE-FAST and b) FRI.
Severe fatigue during the day was found during the second flight of a night shift. In the first
one and half hours, 66.67 % of the flights were marked red. After 3.5 hours, only 27.78 % of the flights
According to the FRI, flights during the day resulted in severe fatigue during the second flights
of the afternoon and night shift and incidentally during the first flights of the morning and afternoon
shift and the second flight of the morning shift (see Figure 14b).
Figure 14. Percentage of the three colour categories per flight hour of the first and second flight of all three shifts during the day of a) SAFTE-FAST and b) FRI.
In summary, SAFTE-FAST predicted severe fatigue especially for the flights during the day of the
night shift in the first 3.5 hours. Besides, a high percentage of severe fatigue was found in the second
flights of the afternoon shift which were at night and longer than three hours. The FRI predicted severe
fatigue for all flights of the night shift and nearly all at night.
DEVELOPMENT OF FATIGUE DURING A WEEK
There was no clear development of the effectiveness score of SAFTE-FAST during a week. On the sixth
most red-marked flights were found on the first day of the night shift (see Figure 16) and in the second
flight of a shift (Figure 17). There was no clear difference between the flights at night and during the
day. At night, most of the flights were marked yellow (see Figure 18).
During the week, the percentage of flights resulting in severe fatigue according to the FRI
increased and the percentage of green flights decreased (see Figure 15). This development was also
observed in the morning and afternoon shift (see Figure 16) and in the first and second flight of a shift
(see Figure 17). The flights of the night shift and most of the night flights were marked red (see Figure
18). In conclusion, only the FRI showed an increased percentage of severe fatigue during a week. There
[image:36.595.157.423.276.484.2]was no clear development predicted by SAFTE-FAST during the week.
Figure 15. Percentage of the three colour categories per weekday of SAFTE-FAST and FRI.
[image:36.595.160.421.528.731.2]Figure 17. Percentage of the three colour categories per weekday and first and second flight of a shift of SAFTE-FAST and FRI.
Figure 18. Percentage of the three colour categories per weekday of flights during the day and night of SAFTE-FAST and FRI.
DEVELOPMENT OF FATIGUE DURING THE WHOLE SCHEDULE
Next, the development of fatigue during the whole schedule of twelve weeks was visualized. The
weeks with a night shift (week 3, 6, 9 and 12) showed more fatigue and severe fatigue than the weeks
with a morning or afternoon shift. In the first week, the morning shift only had green-marked flights.
In the fourth and seventh week, they were all marked yellow. In the tenth week, some flights were
also in the green area. There was no clear development from week one to week twelve. According to
the FRI, the weeks with the night shifts resulted in severe fatigue. The percentage of it increased from
[image:37.595.160.423.325.534.2]Figure 19. Percentage of the three colour categories per week of SAFTE-FAST and FRI.
RELATIONSHIP BETWEEN FATIGUE AND BREAK LENGTH BETWEEN TWO FLIGHTS IN ONE SHIFT
As a final test, it was checked if the length of break between the first and second flight of a shift had
an influence on the percentage of severe fatigue of the second flight. SAFTE-FAST predicted no clear
development of the percentage of severe fatigue the longer a break is (see Figure 20). Besides, the
kind of shift has no influence (see Figure 21). According to the FRI, there is also no clear development
of the percentage of severe fatigue the longer a break is (see Figure 20). Besides, kind of shift had no
influence on the development (see Figure 21).
[image:38.595.159.423.512.721.2]Figure 21. Percentage of the three colour categories per break length in a shift and kind of shift of SAFTE-FAST and FRI.
SECOND SCENARIO
DESCRIPTION OF THE SCENARIO
The schedule of the second scenario was 82 days long and had 60 duty and flight time periods. In one
duty period, the pilot flew only one time. The duty time periods were eight hours long and were
organized in shifts. The morning shift began at 8 am, the afternoon shift at 4 pm and the night shift at
12 pm. The shifts rotated every week. The duties were on the first five days of the week, the other
two were free. During every duty period, there was a flight time of five hours (see Figure 22 for the
flight scheme). At night, the actual flight time of two and a half hours was multiplied by two, because
the pilot used night vision equipment. This resulted also in an official flight time of five hours at night.
[image:39.595.81.517.537.741.2]SAFTE-FAST
In the second scenario, mean effectiveness increased a bit in the afternoon and then declined at night.
The morning and night shift resulted in fatigue and the afternoon shift not. The mean score of the
[image:40.595.160.441.166.386.2]night shift was at the bottom of the yellow area (see Figure 23).
Figure 23. Mean effectiveness of the SAFTE-FAST during the morning, afternoon and night shift of the second scenario. In the background, the colour thresholds of SAFTE-FAST are shown.
The effectiveness score of the morning shift was between 81.80 and 93.66 (M= 85.87; SD=
2.7), at the afternoon shift it was between 88.89 and 97.51 (M= 95.23; SD= 1.46) and at the night shift
the effectiveness score was between 66.62 and 83.52 (M= 74.37; SD= 3.87). In this scenario, zero
percent of the flights were in the red area, 63.3 % were in the yellow area and 36.7 % were in the
green area.
FRI
In Figure 24, the FI of every flight time period is shown. The three shifts can be seen because of the
grouping of the variable points. There was no great difference between the morning and afternoon
shift. The FI during the night shift was the highest. During a work week the FI rose during all shifts, but
it ascended the most during the night shifts. During the morning shift, the FI was between .9 and 4.4
(M= 3.2; SD= 1.02), during the afternoon shift between 3.7 and 5.4 (M= 4.46; SD= .62) and during the