I SPY, I SPY WITH MY
LITTLE EYE
A RESEARCH ABOUT THE EFFECTS OF WATCHING
EYES ON PRE-SWIM SHOWER BEHAVIOUR
Master thesis
J. Ribbers
Supervisors
T.J.L. van Rompay J.J. van Hoof M.G.A. Keuten
University of Twente
Faculty of Behavioural, Management and Social Sciences
Communication Science
Master track: Marketing Communication
2
ABSTRACT
Background The basis of this study lies in hygiene of swimming pools, where it is argued that taking a pre-swim shower would lead to a decrease in release of pollutants in the swimming pool, which in the end would lead to the decrease of health issues as red eyes and asthma. However, previous research has shown that not even half of the swimming pool visitors takes a pre-swim shower. Therefore, interventions are needed to increase pre-swim shower behaviour. Whereas previous research focused on ‘conscious’ behavioural interventions, this research focuses on ‘unconscious’ behavioural interventions, by using watching eyes. Watching eyes create an unconscious feeling of being watched, which lead people to behave in a prosocial way (for example: people litter less). It is argued that when swimming pool visitors are ‘confronted’ with watching eyes, they are more likely to take a pre-swim shower. So, this study aimed to increase pre-swim shower behaviour in swimming pools by using watching eyes.
Methodology Three interventions were designed, either containing watching eyes, a symbol, or a combination of both. This led to three conditions: eyes/no symbol (eyes-only), eyes/symbol (eyes + symbol), and no eyes/symbol (symbol-only). A fourth condition was added in which nothing was displayed (no eyes/no symbol): the control condition. Three methods were used to gather data for this study: observations, questionnaires and water quality measurements. Observations were used to gather data about actual pre-swim shower behaviour, and the influence of factors as gender, age, carrying belongings, other people showering, et cetera. These factors were found to influence pre-swim shower behaviour in previous research. Questionnaires were used to gather data about hygiene perceptions, importance of hygiene, and hygienic behaviour, and about the awareness and understanding of the interventions. It was thought that data about the factors mentioned before could give more insights about how swimming pool visitors feel about hygiene in swimming pools, and about the influence of the interventions. Finally, water quality measurements were used to gather data about the release of pollutants in the swimming pool.
Findings Results provide evidence for the effect of watching eyes on pre-swim shower behaviour. It was observed that actual pre-swim shower behaviour increases during all three interventions, with the ‘symbol-only’ intervention being the most effective intervention. Furthermore, it was shown that perceptions of hygiene and hygienic behaviour were rated highest in the ‘watching eyes + symbol intervention’. Finally, less pollutants were released during all three interventions, with the watching eyes + symbol intervention being the most effective intervention.
Conclusions These results indicate that the watching eyes + symbol intervention is the best intervention to increase pre-swim shower behaviour. It is therefore recommended to use this intervention in swimming pools. This research has shown the effectiveness of watching eyes in a new context: in a swimming pool context. Furthermore, this research contributes to the body of literature about the influence of watching eyes on hygienic behaviour. Future research should specifically focus on fine tuning of watching eyes interventions to increase pre-swim shower behaviour, and in general on the underlying process between watching eyes and prosocial behaviour.
3
CONTENT
Introduction p. 4
Theoretical framework p. 6
Method p. 12
Results p. 21
Discussion and conclusion p. 29
Acknowledgements p. 37
4
INTRODUCTION
On a yearly basis, Dutch citizens visit the swimming pool nearly seventy million times for sports and recreational swimming (Centraal Bureau voor de Statistiek [CBS], 2015). All these people bring micro-organisms and pollution into the swimming water, so called anthropogenic pollution (Keuten, Schets, Schijven, Verberk, & Van Dijk, 2012). To keep the water clean and healthy, chlorination is used to inactivate micro-organisms. However, the combination of pollution and chlorination leads to the formation of disinfection by-products (DBP’s), which can have a negative impact on health of swimming pool visitors (Chowdhury, Alhooshani, & Karanfil, 2014; Villanueva, Cordier, Font-Ribera, Salas, & Levallois, 2015). For example, swimming pool visitors are more susceptible for red eyes, respiratory symptoms and asthma (Chowdhury et al., 2014; Villanueva et al., 2015). It is argued that when the anthropogenic pollution in the water is reduced, less DBP’s are formed and health risks of swimming pool water will be reduced (Tang, Ristau, & Xie, 2015).
More than one-third of the anthropogenic pollution that comes into the water is coming from peoples’ bodies during the first minute of body contact with water, so called initial pollution (Keuten et al., 2012; Keuten et al., 2014). To reduce initial pollution in the water (and thereby the formation of DBP’s), it is necessary that people take a shower before they enter the swimming pool (pre-swim shower). A pre-swim shower removes most of the initial pollution that otherwise would be brought into the water by a person (Keuten et al., 2012). However, it is known that not everyone takes a pre-swim shower before entering the swimming pool (Pasquarella et al., 2014; Stronks, 2015; Zwilling, 2014). Therefore, a solution to make people take a pre-swim shower before entering the swimming pool is needed. Previous research concerning the increase of pre-swim shower behaviour has focused on ‘consciously processed’ behavioural interventions (Stronks, 2015; Zwilling, 2014). In these two studies, posters including text and a symbol were used to increase pre-swim shower behaviour. Pre-swim shower behaviour did increase during the interventions used in these studies. However, the results of these studies were not conclusive. Therefore, this study takes a different perspective. In this study, the behavioural interventions are based on unconsciously processing. Interventions based on unconscious processing have proven to be effective. A practical example is the introduction of a fly in urinals at Schiphol. Schiphol dealt with high cleaning costs for male restrooms due to spillage. In order to reduce cleaning costs, a fly was introduced into urinals to change urinating behaviour of males. As a consequence, spillage in male restrooms was reduced with eighty percent (Szmigin & Piacentini, 2014), which led to a decrease in cleaning costs. This example indicates that small interventions can lead to big differences in behaviour. In this study, ‘watching eyes’ are used as a means to increase pre-swim shower behaviour.
5 video camera) triggers the imagination of physical presence of people (feeling of being watched), which influences our behaviour. The watching eyes phenomenon is an example of implied social presence. This phenomenon is based on the fact that just an image of watching eyes gives people the idea that they are being watched, which leads them to behave in a prosocial way (Bateson et al., 2006; Ernest-Jones, Nettle, & Bateson, 2011; Haley & Fessler, 2005; Pfattheicher & Keller, 2015). This is an automatic and unconscious process, in which watching eyes unconsciously activate reputational concerns, which leads people to behave in a prosocial way (Burnham, & Hare, 2007; Izuma, 2012). For example, people are more likely to give money to a charity fund when eyes are presented on a charity box (Ernest-Jones et al., 2011).
Research regarding the watching eyes phenomenon has proven that watching eyes are effective in different fields of study, including the field of health and hygiene (Beyfus et al., 2016; Bittner & Kulesz, 2015; King et al., 2016). For example, it was demonstrated that a poster of watching eyes above a dispenser for hand hygiene has led to significantly more employees cleaning their hands in a hospital (King et al., 2016). The amount of research in the field of health and hygiene is small, but the results of previous studies are promising. It is therefore proposed to extend this field of research with a new study: the effect of watching eyes on pre-swim shower behaviour. The goal of this study is to increase pre-swim shower behaviour by using “watching eyes” (alone, and in combination with a symbol) and herewith reduce pollution of swimming pool water. This leads to the following research question:
To what extent can “watching eyes” increase peoples’ pre-swim behaviour and therefore reduce pollution of swimming pool water?
6
THEORETICAL FRAMEWORK
This research focuses on the influence of implied social presence cues, e.g. watching eyes, on hygienic behaviour in swimming pools (pre-swim shower behaviour). Firstly, the influence of social presence on human behaviour is discussed. Hereafter, the watching eyes phenomenon is discussed. Then, hygienic behaviour and interventions that influenced hygienic behaviour are discussed. Finally, hygienic behaviour in swimming pools, and interventions that focused on increasing pre-swim shower behaviour are discussed.
SOCIAL PRESENCE
The concept of social presence is based on how other people in our neighbourhood can affect our behaviour, without any interaction (Argo, Dahl, & Manchenda, 2005). This “impact” of the mere presence of others is described in the Social Impact Theory by Latané (1981). Social Impact Theory (SIT) describes how the presence of others, either real, implied or imagined, affects our psychological states and subjective feelings, our motives and emotions, and our cognitions and beliefs (Latané, 1981). We want other people to have a good impression of who we are (Baumeister, 1982). So, in situations where rules are applicable, or where norms describe how you should behave, we are more likely to conform to these rules or norms when other people are present, as we want to show them how “good” we are (Kindleberger, 2000).
Research into social presence has shown how the presence of others can affect the way we behave when others are around. The study of Argo et al. (2005) for example shows that when other customers (either one or three) are present in the same aisle in a store, subjects are more likely to buy the luxury version of a product in comparison to when there is no one present. In that scenario, subjects are more likely to buy a cheaper version of the product. Subjects buy a more luxury product when others are around, as they want to impress these other customers (Argo et al., 2005). Other studies have proven the effect of social presence in other fields as well, such as safety (Sayin et al., 2015) and (self-)services (Kinard et al., 2009). For example, a research of Kinard et al. (2009) shows that the mere presence of others leads to more people using technology based self-service (for example, self-service check-out stations at a hotel). The explanation here fore is that when more people are around, the chance of other people noticing that you are making a mistake (perceived risk of using technology) is smaller than when only one person is around. In that way, the chance of forming a good reputation is bigger. Overall, previous studies provide evidence that the concept of social presence leads to adjustments in behaviour in favour of one’s good reputation. Furthermore, it is proven that social presence is applicable to different settings and different disciplines.
7 subjects imagined that there were people present (there were no “real” people), they felt more embarrassed to make a certain purchase. Similarly, Van Rompay et al. (2009) showed that the presence of a camera (which was used as implied social presence cue) triggered subjects’ helping behaviour. Overall, there seems to be evidence to indicate that a “sense of being watched” can affect subjects’ behaviour as well. That only a “sense of being watched” can lead people to behave in a certain way, is also proven by the watching eyes phenomenon (Baillon, Selim, & van Dolder, 2013; Bateson et al., 2006; Haley & Fessler, 2005; Keller & Pfattheicher, 2011; Pfattheicher & Keller, 2015; Powel, Roberts, & Nettle, 2012; Rigdon, Ishii, Watabe, & Kitayama, 2009; Sparks & Barclay, 2013). The watching eyes phenomenon works in essence the same as social presence: the presence of others leads us to behave in a certain way, but moreover, we behave differently than when there is no one present. However, when it comes to watching eyes, there are no “real” people present. An image of watching eyes (or something likewise) replaces the “real people”. So, just a “perception of being watched” can lead us to behave as we think we should behave (Bateson et al., 2006).
WATCHING EYES
First studies into the topic of watching eyes revealed that “watching eyes” led people to behave more prosocial (Haley & Fessler, 2005; Bateson et al., 2006). However, it was unclear why they acted more prosocial, either because they wanted to conform to the (local) norm, or because they wanted to form a good reputation. Research has shown that behaviour stemming from “watching eyes” is moreover focused on building a “good” reputation (Bateson, Callow, Holmes, Redmond Roche, & Nettle, 2013; Fathi, Bateson, & Nettle, 2014; Powel et al., 2012). It is an unconscious process, where watching eyes activate an automatic cognitive mechanism for reputational concerns (Burnham, & Hare, 2007; Izuma, 2012). People want to impress others and show other people how “good” they are. Therefore, they act more prosocial (Bateson et al., 2013; Powel et al., 2012). For example, people are more generous when “watching eyes” are depicted. Haley and Fessler (2005) demonstrated that people playing the dictator game were more willing to give their partners money when stylized eyespots were displayed at their desktop. It was argued that this prosocial behaviour was caused by the eyespots, which served as indicators of attention. The indicators of attention had led people to make more prosocial decisions than when there were no eyespots depicted on the desktop (Haley & Fessler, 2005). However, the study was conducted in a lab-setting. To determine the effects of “watching eyes” in a naturalistic setting, Bateson et al. (2006) conducted a study in a university cafeteria where employees had an option to contribute to an honesty box for drinks. They showed that when a poster containing an image of watching eyes was hung near the honesty box people payed three times more for their drinks than when an image of flowers was displayed on the poster (Bateson et al., 2006). In 2012, Powel et al. found that eye-images on a bucket for donation that was placed in a supermarket led to significantly more people donating money in the bucket, with rates up to 28% when it was busy in the supermarket and 59% when it was quiet in the supermarket. It was concluded that the presence of either eye-images or real people lead to an increase in donations, but that a combination of both does not increase donations.
8 theft (Nettle, Not, & Bateson, 2012), electoral participation (Panagopoulos, 2014a; Panagopoulos, 2014b), health behaviour (Bittner & Kulesz, 2015) and hygienic behaviour (Beyfus et al., 2016; King et al., 2016; Kuliga, Tanja-Dijkstra, & Verhoeven, 2011). For example, Panagopoulos (2014a; 2014b) demonstrated that the amount of people that went voting increased significantly when an image of eyes was displayed at their mailing (including an appeal to go voting). More importantly, Panagopoulos (2014b) found that the durability of the effect was quite long (several days), which indicates that an effect of “watching eyes” would not decay rapidly. When it comes to the field of health behaviour, Bittner and Kulesz (2015) showed that watching eyes on a menu leads people to make healthier food choices. Thereby, the combination of health goals with watching eyes also leads people to make healthier food choices (Bittner & Kulesz, 2015). Despite this promising evidence, not much research has been conducted concerning the effect of “watching eyes” on hygienic behaviour.
HYGIENIC BEHAVIOUR
Hygiene is important to prevent humans from diseases. However, people do not always comply with hygiene rules. Therefore, a lot of studies have focused on interventions to improve behaviour regarding hygiene compliance, and several studies have studied the effect of social presence and watching eyes in particular as well. A study by Nalbone, Lee, Suroviak, and Lannon (2005), concerning the influence of social presence on hygiene compliance, showed that the presence of other males in a restroom has a positive influence on hygienic behaviour of the male subjects. When there were other males present in the restroom, ninety percent of the males washed their hands, against forty-four percent of the males when there are no other males present in the restroom (Nalbone et al., 2005). So, only a small intervention with a basis in social presence can lead to a significant increase in hygienic behaviour. Other studies in the field of hygiene show similar results (Conley, DeRusha, & Peden, 2007; Drankiewicz & Dundes, 2003; Wilson, Jacob, & Powel, 2011). It is therefore suggested to use social presence as a basis for an intervention (Wilson et al., 2011). But, as mentioned before, it is also impossible to always have “real” people in close proximity to influence hygienic behaviour. Therefore, “watching eyes” seem a promising solution. A first research of Kuliga et al. (2011) in which the effect of watching eyes (a canvas poster above the dispenser) on hand hygiene (using the antiseptic hand rub dispenser) was measured, has not shown a significant effect of “watching eyes” on hand hygiene. However, results of two recent studies are promising. King et al. (2016) have shown that a photograph of male eyes above the gel dispenser led to significantly more people using the gel dispenser in order to clean their hands compared to the control condition. Furthermore, the study of Beyfus et al. (2016) showed that when watching eyes are integrated with the dispenser, this leads to significantly more people using the dispenser to clean their hands. Overall, the aforementioned studies have shown that social presence, either real or implied, can affect compliance with hygienic behaviour.
HYGIENIC BEHAVIOUR IN SWIMMING POOLS
9 about risks of unhygienic behaviour and therefore compliance with hygienic behaviour are low (Amodio et al., 2014; Gallè et al., 2016; Water Quality & Health Council [WHQC], 2012). For example, Amodio et al. (2014, p. 210) showed that more than 50% of swimmers at least show one unhygienic behaviour when they are in or around a swimming pool. Examples of unhygienic behaviour are: not taking a pre-swim shower, urinating while bathing, or pre-swimming with skin wounds. Furthermore, Gallè et al. (2016) state that knowledge of the rules of a swimming pool does not necessarily lead to compliance with hygienic behaviour. When it comes to specific hygienic behaviour in swimming pools, research regarding pre-swim shower behaviour has shown that compliance with pre-swim shower behaviour is low as well (Pasquarella et al., 2013; Pasquarella et al., 2014; Stronks, 2015; Zwilling, 2014). Therefore, simply showing the rules and regulations to positively influence hygienic behaviour is not enough. (Educational) interventions should be designed to increase knowledge and / or compliance with hygienic behaviour (Gallè et al., 2016; Pasquarella et al., 2013). Thereby, swimming pool visitors have to be encouraged to behave in a healthy and hygienic way (Pasquarella et al., 2014). For example, specific signs indicating that showering is a pool rule could encourage swimmers to take a pre-swim shower (Wiant, 2012).
In a first attempt to increase pre-swim shower behaviour by means of interventions, Zwilling (2014) designed three interventions (posters) based on guidance, providing information, and social norm. The intervention based on ‘guidance’, a routing game guided swimming pool visitors to the swimming pool, and the last step was taking a shower (before entering the swimming pool). The intervention based on ‘providing information’ informed swimming pool visitors about how to prevent themselves (taking a pre-swim shower) for one of the consequences (irritated eyes) when they would not take a pre-swim shower. The intervention based on the ‘social norm’ indicated that most people take a pre-swim shower, and informed about the positive consequence (cleaner water). The research was performed at three different communal pools. Only the intervention based on ‘providing information’ led to significantly more people taking a pre-swim shower. It was argued that, because this intervention was based on central message processing and the other two interventions were based on peripheral message processing, the central processing of the information has led to a significant improvement in pre-swim showering (Zwilling, 2014).
10 in which the informative intervention was effective, and the social norm intervention was not. This difference in results might be explained by the fact that the research of Zwilling was conducted in communal swimming pools, and the research of Stronks (2015) was conducted in a holiday park swimming pool. There might be a difference in behaviour between visitors of communal pools and of holiday park swimming pools, as visitors of communal pools visit the swimming pool on a more regular basis (for example, once a week) compared to holiday park swimming pool visitors. It is argued that visitors of communal pools are more concerned with water quality and hygiene, and are therefore more susceptible for the informative method than visitors of holiday park pools (Stronks, 2015). Furthermore, though the informative interventions were not effective individually, in combination with a social norm intervention or improving facilities intervention they led to significantly more people taking a pre-swim shower.
Though both studies have shown that interventions can be effective in increasing pre-swim shower behaviour, the results are not conclusive and more research is needed to further increase pre-swim shower behaviour. This study will investigate that, by using interventions based on unconscious processing. These interventions include either watching eyes, a symbol, or a combination of both. Watching eyes have proven to be effective in changing/improving behaviour in different fields, for example in hygienic behaviour (Beyfus et al., 2016; Bittner & Kulesz, 2015; King et al., 2016). Therefore it is proposed that watching eyes can also contribute to hygienic behaviour in swimming pools, in this case pre-swim shower behaviour. This leads to the following hypothesis:
H1: Displaying watching eyes (eyes-only and eyes + symbol) on a poster in the shower room of a swimming pool leads to significantly more swimmers taking a pre-swim shower in comparison to a symbol-only poster and the control condition.
Furthermore, research suggests that an increase in pre-swim shower behaviour can lead to a decrease of pollution of swimming pool water (Keuten et al., 2012). It is therefore proposed that:
H2: An increase in pre-swim shower behaviour by displaying watching eyes (eyes-only and eyes + symbol) on a poster in the shower room of a swimming pool leads to a decrease of pollution of swimming pool water.
11 hygiene and hygienic behaviour. The foregoing explanation led to the following five explorative questions:
- To what extent do watching eyes only increase pre-swim shower behaviour?
- To what extent is there a difference in effectiveness between the watching eyes only intervention and the eyes + symbol intervention?
- To what extent do factors as gender, age, other people showering, group, company, carrying belongings, time of the day and outside temperature influence pre-swim shower behaviour? - To what extent did participants see and understand the interventions?
- To what extent is participants’ perception of hygiene, the importance of hygiene and hygienic behaviour influenced by the interventions?
12
METHOD
This study was based on a two (watching eyes versus no watching eyes) by two (symbol versus no symbol) experimental design (table 1). The pre-swim shower behaviour was measured by means of observations. This method was chosen as it was the most unobtrusive way to measure pre-swim shower behaviour. In this way, it was most likely that people just behave as they normally would do, and that they would not show socially desirable behaviour because of the research. Furthermore, a questionnaire was distributed, among an at random selected part of the swimming pool visitors, to gain more insight into the pre-swim shower behaviour of swimming pool visitors and their awareness regarding the interventions. Finally, water quality was tested and analysed to see whether the interventions also have led to less polluted swimming water.
Table 1
Research design
Symbol No Symbol
Watching Eyes X X
No Eyes X X
This study consisted of four conditions, in which the ‘no eyes x no symbol’ condition is the control condition (no poster was displayed in this condition). Three different interventions were designed, in which either an image of watching eyes, a symbol, or a combination of both was displayed.
PRE-TEST
In order to make sure that the image of eyes that was used in this study were realistic, appropriate, and serious, a pre-test was conducted. The pre-test consisted of three stages. In the first stage, pairs of eyes were collected from the internet (N = 32). In the second phase, a focus group (N = 5) was conducted to limit the amount of pairs of eyes to eight-ten pairs of eyes for the third phase, an online questionnaire (N = 70) in which participants had to rate the pairs of eyes on their level of “reality”, “seriousness”, and if the pairs of eyes were “suitable” for a swimming pool environment.
The images of eyes in the first stage were selected based on the following criteria: 1. The image had to be bigger than 400 x 150 pixels
2. The image had to be sharp
3. The pair of eyes should look at you
4. The eyes had to be right next to each other 5. The image could not have a watermark 6. The background of the image had to be white
13 In the second phase, the images that were collected in the first phase were discussed in a focus group. The goal of the focus group was to limit the amount of images of pairs of eyes from thirty-two (selected by the researcher) to eight – ten pairs of eyes (selected by the participants of the focus group) that could be included in the third phase of the pre-test. The criteria for the selection of pairs of eyes were:
1. The eyes should be realistic
2. The appearance of the eyes should be serious, and display authority 3. The eyes should be appropriate for a swimming pool environment
In total, five participants participated in the focus group, and they selected ten pairs of eyes for the third phase in the pre-test.
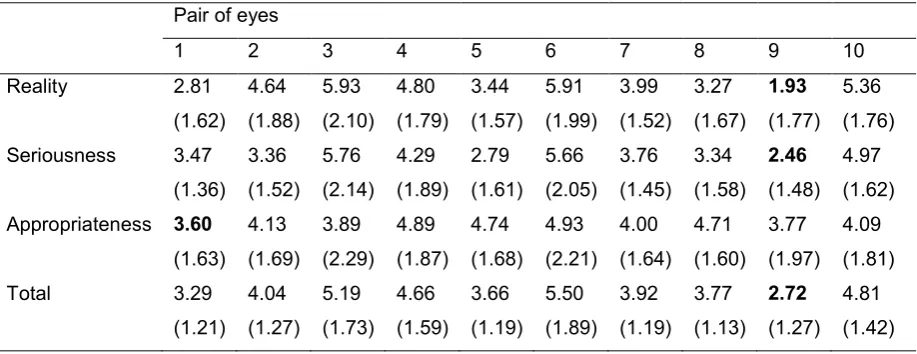
[image:13.595.73.532.510.687.2]In the third phase the ten pairs of eyes were included in an online questionnaire. The goal of the questionnaire was to select one pair of eyes that would be used in the main study. Seventy participants filled in the questionnaire completely (male = 17.1%, female = 82.9%; Mage = 33.36, SDage = 13.88). The questionnaire existed of ten questions (one question for each pair of eyes). Each question consisted of three seven-point Likert scales, on which participants could rate the pair of eyes. The scales were: realistic – not realistic; serious – not serious; appropriate for a swimming pool environment – not appropriate for a swimming pool environment, where 1 was realistic/serious/appropriate, and where 7 was not realistic/not serious/not appropriate. The scales were based on the criteria used for in the focus group. The questionnaire was spread via Facebook. An introduction explained the goal of the research, and explained how the questionnaire should be filled in. Participants were thanked for their participation at the end of the questionnaire. The data gathered with the questionnaire was analysed using the program IBM SPSS Statistics 22. For all pairs of eyes the mean score (and standard deviation) on reality, seriousness and appropriateness was calculated, these scores are depicted in table 2.
Table 2
Mean scores (SD) on reality, seriousness and appropriateness for each pair of eyes and in total. Pair of eyes
1 2 3 4 5 6 7 8 9 10
Reality 2.81
(1.62) 4.64 (1.88) 5.93 (2.10) 4.80 (1.79) 3.44 (1.57) 5.91 (1.99) 3.99 (1.52) 3.27 (1.67) 1.93 (1.77) 5.36 (1.76) Seriousness 3.47
(1.36) 3.36 (1.52) 5.76 (2.14) 4.29 (1.89) 2.79 (1.61) 5.66 (2.05) 3.76 (1.45) 3.34 (1.58) 2.46 (1.48) 4.97 (1.62) Appropriateness 3.60
(1.63) 4.13 (1.69) 3.89 (2.29) 4.89 (1.87) 4.74 (1.68) 4.93 (2.21) 4.00 (1.64) 4.71 (1.60) 3.77 (1.97) 4.09 (1.81)
Total 3.29
(1.21) 4.04 (1.27) 5.19 (1.73) 4.66 (1.59) 3.66 (1.19) 5.50 (1.89) 3.92 (1.19) 3.77 (1.13) 2.72 (1.27) 4.81 (1.42) Note. The best mean scores are in bold.
14
MATERIALS
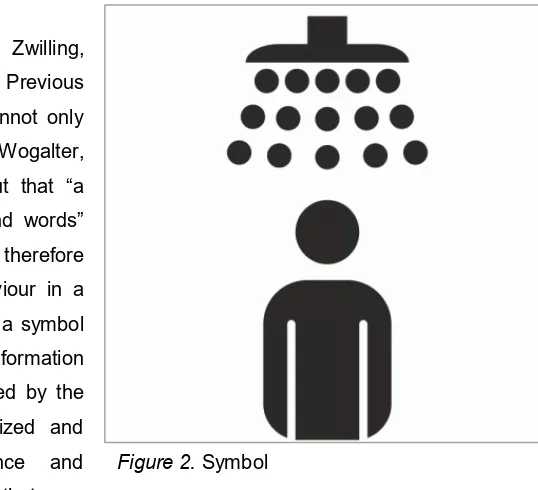
For this study, three interventions (posters) were designed, containing either “watching eyes” (figure 1), a symbol (figure 2), or a combination (watching eyes and symbol). In this section, the design choices for the interventions are discussed.
USE OF SYMBOL
Instead of using text (Stronks, 2015; Zwilling, 2014) a symbol was used in this study. Previous research has shown that a symbol cannot only attract attention (Laughery, 2006; Wogalter, Conzola, & Smith-Jackson, 2002), but that “a symbol can say more than a thousand words” (Laughery & Wogalter, 2014, p. 6), and therefore can be really useful to change behaviour in a glance. It is therefore important to use a symbol with direct representation, that is, the information (or instruction, in this case) represented by the symbol was expected to be recognized and understood from general experience and knowledge (Laughery, 2006, p. 472). In that way,
people were able to see in one glance what behaviour is expected from them. Furthermore, instructional signs have proven to be beneficial for compliance with the behaviour depicted by the sign (Laughery & Wogalter, 2014). The symbol used in this study is depicted above (figure 2).
OTHER DESIGN CHOICES
To make the intervention look like a poster, a coloured border and the corporate identity of the park were added to the intervention. The coloured border was added as it is more likely to attract attention to the poster, and it even increases the likelihood that the information will be encoded (Laughery, 2006; Wogalter et al., 2002).
[image:14.595.142.456.69.218.2]To make the intervention recognizable for the visitors, the logo of the holiday park was included on the poster in the right upper corner. In this way, it was made clear that the poster belonged to the
Figure 1. Pair of eyes, selected and used for the main study.
[image:14.595.248.517.335.580.2]15 holiday park, and that the holiday park supported the message of the poster.
The size of the posters was A2 format (420 mm x 594 mm). The general rule concerning the size of sign says “the bigger the better” (Laughery & Wogalter, 2014). Furthermore, the intervention was placed in a so-called pavement sign (A0 format), so an A2 format was needed to attract swimming pool visitors’ attention when they enter the showering room.
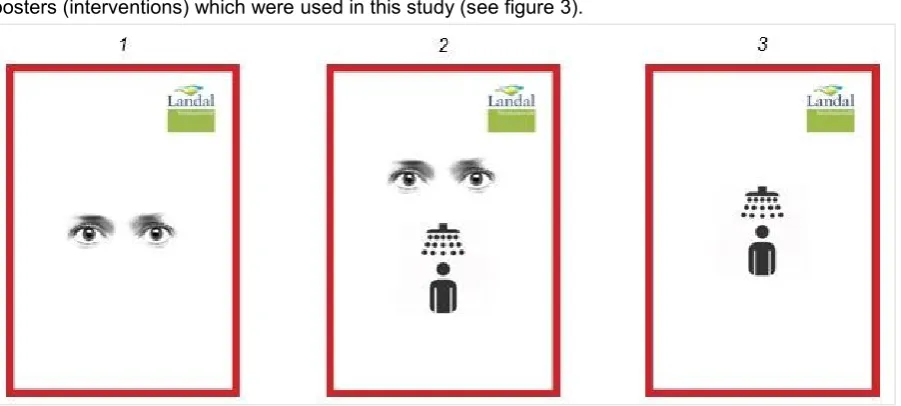
The design factors discussed before were taken into account when all the interventions were designed. Furthermore, “watching eyes” were added in two of the three interventions. This has led to the following posters (interventions) which were used in this study (see figure 3).
LOCATION
The location of the intervention can influence the effectiveness of the intervention. Therefore, the intervention was displayed in a so called “pavement sign” which was placed in the showering room. Herewith the intervention was placed at the location where the behaviour should be conducted, so that it was encountered by the participants (Laughery, 2006; Wogalter et al., 2002). Furthermore, the intervention was not obstructed from view (Laughery & Wogalter, 2014). The placement of the pavement sign was at the left side of the showering room when visitors enter the showering room. Herewith swimming pool visitors would directly see the intervention as they opened the door. Furthermore, to leave the showering room swimming pool visitors had to go left. So if they were not intending to take a pre-swim shower, they would practically walk into the pavement sign including the intervention.
PARTICIPANTS
The participants that were included in the research were visitors of a swimming pool at a holiday park. As visitors of holiday parks stay mostly for a week (or shorter) at the park, it became possible to test different interventions in a short period without cross interference. In this study the effect of the interventions was investigated during several days. Children younger than ten years were excluded from the research, as it was thought that they were too young to understand the intervention. Adults that were joining children younger than ten years were included in the sample.
[image:15.595.75.526.202.405.2]In total, 596 swimming pool visitors were observed. A total of 116 swimming pool visitors were observed during the control condition, 137 swimming pool visitors were observed during the ‘eyes-only’
16 condition, 181 swimming pool visitors were observed during the ‘eyes + symbol’ condition, and 162 swimming pool visitors were observed during the ‘symbol-only’ condition. 48.7% of the participants was a man, 51.3% was a woman. The age of the participants varied between approximately 10 years and 90 years.
N = 125 respondents filled out a questionnaire. A total of 29 respondents filled out the questionnaire during the control condition, 31 respondents filled out the questionnaire during the ‘eyes-only’ condition, 30 respondents filled out the questionnaire during the ‘eyes + symbol’ condition, and 35 respondents filled out the questionnaire during the ‘symbol-only’ condition. 43.2% of the respondents was a man, 56.8% was a woman, with Mage = 47.3 (SDage = 16.3). The youngest participant in the questionnaire was 23 years old, and the oldest participant was 73 years old.
MEASURES
OBSERVATION LIST
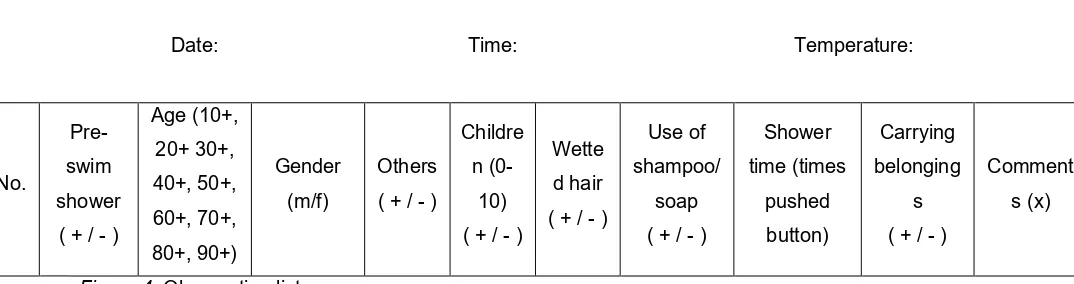
First of all actual pre-swim shower behaviour was observed. Thereby, if visitors wetted their hair, if they used shampoo/soap and the time taking a shower (number of times they push the shower button) was observed, as all three factors could influence the level of pollution that is washed off (or brought into the swimming pool) (Keuten, et al., 2012; Pasquarella, et al., 2013; Pasquarella, et al., 2014). Furthermore, the presence of other people in the shower room taking a shower was observed, as this might influence the behaviour of swimmers. Finally, gender, estimated age, if adults were joined by children younger than 10 years, and the carrying of belongings were observed, as previous research has shown that these variables can influence pre-swim shower behaviour (Stronks, 2015; Zwilling, 2014). For each observation period, date, time, and outside temperature were noted to be able to control for circumstances during the observation period. The observation list (and order of the variables) that was used in the research is shown in figure 4.
Date: Time: Temperature:
[image:16.595.30.567.496.638.2]No. Pre-swim shower ( + / - ) Age (10+, 20+ 30+, 40+, 50+, 60+, 70+, 80+, 90+) Gender (m/f) Others ( + / - ) Childre n (0-10) ( + / - ) Wette d hair ( + / - ) Use of shampoo/ soap ( + / - ) Shower time (times pushed button) Carrying belonging s ( + / - ) Comment s (x)
Figure 4. Observation list
QUESTIONNAIRE
17 behaviour were measured using scales.
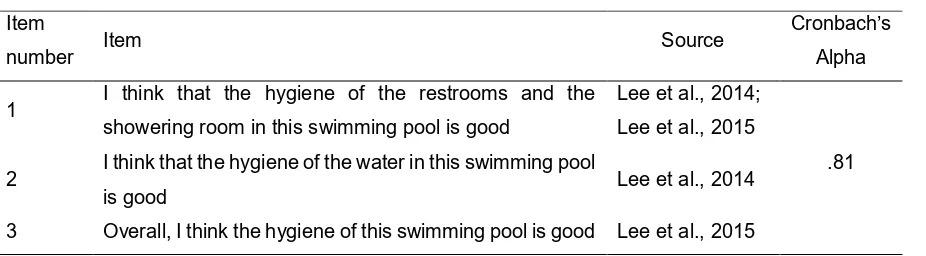
[image:17.595.73.536.177.305.2]The scale hygiene perceptions measured what people think of hygiene in and around the swimming pool. This scale existed of three items, with items derived from former scales and questionnaires (table 3).
Table 3
Hygiene perceptions scale Item
number Item Source
Cronbach’s Alpha 1 I think that the hygiene of the restrooms and the
showering room in this swimming pool is good
Lee et al., 2014; Lee et al., 2015
.81 2 I think that the hygiene of the water in this swimming pool
is good Lee et al., 2014
3 Overall, I think the hygiene of this swimming pool is good Lee et al., 2015
The scale importance of hygiene measured how important people think hygiene is. This scale existed of three items, and was derived and rewritten from the hygiene perceptions scale (table 4).
Table 4
Importance of hygiene scale Item
number Item
Cronbach’s Alpha 1 It is important for me that the changing room and showering room in this
swimming pool are hygienic
.91 2 It is important for me that the water of this swimming pool is hygienic
3 It is important for me that the overall appearance of the swimming pool is hygienic
To conclude, two items about hygienic behaviour formed a third scale (table 5). Table 5
Hygienic behaviour items Item
number Item
Cronbach’s Alpha 1 I behave in a hygienic way when I am in a swimming pool
.85 2 It is important for me that others behave in a hygienic way
18
WATER QUALITY
Water quality was analysed to measure the effect of the interventions on swimming pool water. Water samples were taken at the start and end of every observation day. For each sample, the level of urea, non-purgeable organic carbon (NPOC) and total nitrogen (TN) was examined to indicate water quality. These parameters were used as these parameters would be the best indicators of initial pollution in swimming pool water (Keuten et al., 2012).
PROCEDURE
The research was conducted in a period of four weeks. Each week started on a weekend day (either Saturday or Sunday) and ended the following weekend. A week started by installing the pavement sign with the subsequent poster in the showering room (with the exception of the control condition). During the week, the researcher would observe pre-swim shower behaviour on three days, one day in the weekend and two days during the working week. Pre-swim shower behaviour was observed during those days in three timeslots of two hours, from 10.00-12.00; 13.00-15.00; and 17.30-19.30. On the fourth day, after all three observation days, the researcher distributed questionnaires under swimming pool visitors. Water samples for measuring water quality were taken on each observation day, in the morning before the observation started, and in the evening after the observation day ended.
OBSERVATIONS
During an observation day, the researcher went incognito as swimming pool visitor. The researcher was dressed in bathing clothes, brought a bath towel and a bag. Before a timeslot started, the researcher took a pre-swim shower, and went in the pool for a swim. During the observation of two hours, the researcher sat next to the swimming pool, in opposite direction of the showering room, to have a clear view on the showering room. The researcher used puzzle books and magazines to hide the observation form. As much information as possible was noted down on the observation form for each swimming pool visitor. Between the first and the second timeslot the researcher stayed in the swimming pool area, as the timeslots were divided by one hour. The chance would be too high that swimming pool visitors at the end of the first timeslot would see the researcher coming back at the start of the second timeslot, which might have created suspicion regarding the researcher and influence the outcome of the observations. Depending on how many visitors were in the swimming pool, the researcher either went for a swim (when it was calm) or read a magazine (when it was busy). Between the second and the third timeslot the researcher went outside the swimming pool building. Before the third timeslot started the researcher would take a pre-swim shower and a swim to stay in the role of swimming pool visitor.
QUESTIONNAIRES
19 the building, they were asked by the researcher to fill in a questionnaire. First, the researcher would explain what the research was about, and then ask them to fill out a questionnaire. The researcher offered respondents help to fill out the questionnaire when they were not able to fill out the questionnaire themselves (for example: forgot glasses) or when they asked the researcher for help. Every respondent was thanked for their help after they filled out the questionnaire.
WATER SAMPLES
Water samples were taken in the morning (before the first observation period started) and in the evening (after the end of the last observation period) on each observation day. Water samples were taken in the technical room of the swimming pool. A clean 200 mL sample bottle was filled with swimming pool water. For each sample that was taken, date, time, level of free chloride, and level of acidity (pH) was noted. The samples were kept cool in a cool box with cooling elements until analysis. Within twelve hours after sampling, the parameter urea was analysed by the researcher for each sample. Furthermore, for each sample 30 mL vials were prepared in duplo and 1.6 mL 2M hydrochloric acid was added for preservation. The preserved samples were kept cool in a fridge until analysis. The samples were analysed for non-purgeable organic carbon (NPOC) and total nitrogen (TN) within four weeks after sampling in the laboratory of Delft University.
DATA ANALYSIS
OBSERVATIONS AND QUESTIONNAIRES
The data that were gathered by means of observations and questionnaires were analysed using SPSS version 22, employing descriptive statistics, Chi-square statistics, and a univariate analysis of variance (ANOVA) (only for data of questionnaires). Descriptive statistics were used to describe the data in frequencies (N), percentages, means and standard deviations. Chi-square statistics were calculated in order to test if there were statistically significant differences for pre-swim shower rates in general, between groups (‘eyes-only’ condition, ‘eyes + symbol’ condition, ‘symbol-only’ condition compared to control condition) and within groups (values of variables within one condition). Results were marginally significant with α <.10, and were statistically significant with α <.05. When results were statistically significant, effect size was calculated with phi and Cramer’s V, with a small effect size when phi = .10, a medium effect size when phi = .30 and a large effect size when phi = .50. The univariate ANOVA was only used in the questionnaire, to test for statistical differences between the conditions regarding hygiene measures. The level of significance for the univariate ANOVA was set at .05. Open questions in the questionnaire were analysed by the researcher. All answers were listed and similar answers were grouped. The results for the questions ‘can you describe the information board’ and ‘can you describe the goal of the information board’ were used as variables in SPSS (see table 8).
WATER QUALITY
Urea was analysed by enzymatic hydrolysis of urea to ammonium by the enzyme urease. Ammonium is quantified colorimetrically, by the indophenols reaction, using a Lovibond MD600 spectrophotometer. Data retrieved with the urea analysis were saved in an excel-document.
20 using a Shimadzu TOC-Vcph analyser. The 30 millilitre samples were purged, and injected into the combustion chamber at 720°C to oxidise all carbon into CO2. The level of CO2 was measured by using infrared spectrometry. Data retrieved with the NPOC analysis were saved in an excel-document.
The level of TN in swimming pool water was determined according to NEN-EN 12260 (2003) using a Shimadzu TNM-1 analyser (connected to the Shimadzu TOC-Vcph analyser). The 30 millilitre samples were injected into the combustion chamber at 720°C where the nitrogen compounds of the sample were converted into nitric oxide. Nitric oxide was exposed to ozone to induce emission of light. The light that was induced by nitric oxide was measured by a chemiluminescent detector. Data retrieved with the TN analysis were saved in an excel-document.
The data that were gathered were used in the following formula to calculate the load (in milligrams per litre, mg/L) for each bather per hour:
𝑆𝑡𝑎𝑛𝑑𝑎𝑟𝑑𝑖𝑠𝑒𝑑 𝑝𝑜𝑙𝑙𝑢𝑡𝑎𝑛𝑡 𝑟𝑒𝑙𝑒𝑎𝑠𝑒 = (𝐶𝑒𝑛𝑑− 𝐶𝑠𝑡𝑎𝑟𝑡) × 𝑉𝑝𝑜𝑜𝑙
# 𝑜𝑓 𝑏𝑎𝑡ℎ𝑒𝑟𝑠 × 𝑤𝑎𝑡𝑒𝑟 𝑐𝑜𝑛𝑡𝑎𝑐𝑡 𝑝𝑒𝑟 𝑏𝑎𝑡ℎ𝑒𝑟
Where:
Standardised pollutant release = Release per individual bather per hour of water contact (grams)
Cend = Concentration of parameter at the end of the observation period (mg/L) Cstart = Concentration of parameter at the start of the observation period (mg/L) Vpool = Volume of swimming pool = 160 m3
# of bathers = Number of individual bathers during the observation period (in counts) Water contact per bather = 𝑆𝑢𝑚 𝑜𝑓 ℎ𝑜𝑢𝑟𝑙𝑦 𝑜𝑏𝑠𝑒𝑟𝑣𝑎𝑡𝑖𝑜𝑛𝑠 (𝑐𝑜𝑢𝑛𝑡𝑠/ℎ)
# 𝑜𝑓 𝑏𝑎𝑡ℎ𝑒𝑟𝑠 (𝑐𝑜𝑢𝑛𝑡𝑠) (h)
21
RESULTS
The results are presented in three subchapters. Firstly, results regarding actual pre-swim shower behaviour and the influence of different factors on pre-swim shower behaviour are presented (data gathered by observations). Secondly, results regarding understanding of the interventions and the importance of hygiene are presented (data gathered by questionnaires). Lastly, results regarding the influence of pre-swim shower behaviour on water quality are presented (data gathered by water samples).
OBSERVATIONS
In total, 44,5% of the 596 participants took a pre-swim shower during observations. The pre-swim shower rate in the control condition was 35,3%, and 45,3% in the ‘eyes-only’ condition, 45,3% in the ‘eyes + symbol’ condition, and 49,4% in the ‘symbol-only’ condition, indicating that pre-swim shower behaviour is likely to increase in the intervention conditions. Results are presented in figure 5.
A chi-square test was used to compare the pre-swim shower rates of the control condition and the ‘symbol-only’ condition to the pre-swim shower rates of the ‘eyes conditions’ (eyes-only and eyes + symbol). The chi-square test was marginally significant for the comparison with the control condition,
χ
2 (1, N = 434) = 3.43, p = .06, phi = .09, indicating that participants in the ‘eyes conditions’ were more likely to take a pre-swim shower compared to the control condition. The chi-square test was not statistically significant for the symbol-only condition,χ
2 (1, N = 480) = 0.73, p = .40. Herewith, hypothesis 1 (H1) is partially supported.Then, a chi-square test was used to compare the pre-swim shower rates of the three interventions solely to the pre-swim shower rates of the control condition. The chi-square test was
35,3
45,3 45,3
49,4
44,5
0 10 20 30 40 50 60
Control Eyes-only Eyes + Symbol Symbol-only Total
Pre
-s
w
im
s
h
o
w
e
r ra
te
s
(i
n
%
[image:21.595.133.467.330.594.2])
22 statistically significant for the ‘symbol-only’ condition,
χ
2 (1, N = 278) = 5.42, p = .02, phi = .14, indicating that participants in the ‘symbol-only’ condition were more likely to take a pre-swim shower compared to the control condition. The chi-square test was marginally significant for the ‘eyes + symbol’ condition,χ
2 (1, N = 297) = 2.89, p = .09, phi = .09, suggesting that participants in the ‘eyes + symbol’ condition were more likely to take a pre-swim shower compared to the control condition. The chi-square test was not statistically significant for the ‘eyes-only’ condition,χ
2 (1, N = 253) = 2.56, p = .11.Furthermore, a chi-square test was used to compare the pre-swim shower rates of the ‘eyes + symbol’ condition and the ‘eyes-only’ condition. There was no statistically significant difference between the pre-swim shower rates of the ‘eyes + symbol’ condition and the ‘eyes-only’ condition,
χ
2 (1, N = 318) = 0.00, p = .99.INFLUENCE OF FACTORS ON PRE-SWIM SHOWER BEHAVIOUR
Pre-swim shower rates were calculated for different factors as gender, age, and company. Chi-square tests were performed to see if there were statistically significant differences for the factors between the four conditions, and within conditions. Results are presented in table 6. Statistically significant results are presented below for the ‘eyes-only’ condition and the ‘eyes + symbol’ condition, as the focus of this research is on the effect of watching eyes. Results for the symbol-only condition show similar patterns. INFLUENCE OF FACTORS ON PRE-SWIM SHOWER BEHAVIOUR IN ‘EYES-ONLY’ CONDITION
Age
When comparing the ‘eyes-only’ condition to the control condition, the chi-square test was statistically significant for participants in the age group of 40-49 years,
χ
2 (1, N = 30) = 5.79, p = .02, phi = .44, indicating that participants aged 40-49 were more likely to take a pre-swim shower in the ‘eyes-only’ condition compared to the control condition. The chi-square test was also statistically significant for the age group of 60-69 years,χ
2 (1, N = 37) = 6.73, p = .01, phi = .43, indicating that participants aged 60-69 were more likely to take a pre-swim shower in the ‘eyes-only’ condition compared to the control condition.Company
A statistically significant difference was found for participants in the ‘eyes-only’ condition who did not bring (grand)children to the swimming pool,
χ
2 (1, N = 181) = 5.63, p = .02, phi = .21, indicating that participants in the ‘eyes-only’ condition were more likely to take a pre-swim shower when they did not bring (grand)children compared to the control condition.Carrying belongings
23 Time of the day
A chi-square test was statistically significant for participants that visited the swimming pool in the afternoon in the ‘eyes-only’ condition (compared to the control condition),
χ
2 (1, N = 59) = 4.09, p = .04, phi = .26, indicating that participants that visited the swimming pool in the afternoon in the ‘eyes-only’ condition were more likely to take a pre-swim shower compared to the control condition.INFLUENCE OF FACTORS ON PRE-SWIM SHOWER BEHAVIOUR IN ‘EYES + SYMBOL’ CONDITION
Other people showering
A statistically significant difference was found for participants in the ‘eyes + symbol’ condition when there were no other people showering,
χ
2 (1, N = 204) = 7.16, p = .01, phi = .19, indicating that participants in the ‘eyes + symbol’ condition took statistically significant more pre-swim showers compared to the control condition when there were no other people showering.The chi-square test was statistically significant for participants who took a pre-swim shower when there were no other people showering compared to when there were other people showering,
χ
2 (1, N = 181) = 6.23, p = .01, phi = -.19, indicating that participants were more likely to take a pre-swim shower when there were no other people showering than when there were other people showering. GroupThe chi-square test was statistically significant for the comparison between the pre-swim shower rates of participants in the ‘eyes + symbol’ condition when they were alone (no group) and pre-swim shower rates of participants in the control condition who came alone,
χ
2 (1, N = 16) = 5.76, p = .02, phi = .60, indicating that participants in the ‘eyes + symbol’ condition were more likely to take a pre-swim shower when they were alone (no group) compared to the control condition.Company
The chi-square test was statistically significant for participants who took a pre-swim shower together with their (grand)children,
χ
2 (1, N = 181) = 4.81, p = .03, phi = .16, indicating that participants who took a pre-swim shower together with their (grand)children in the ‘eyes + symbol’ condition were more likely to take a pre-swim shower compared to the control condition.Carrying belongings
A chi-square test showed statistically significant differences between participants in the ‘eyes and symbol’ condition that did not carry belongings and participants in the control condition that did not carry belongings,
χ
2 (1, N = 136) = 8.08, p = .004, phi = .24, indicating that participants in the ‘eyes + symbol condition when they did not carry belongings were more likely to take a pre-swim shower compared to the control condition.24 * p < .05, ** p < .01, *** p < .001: indicating a within-group difference, in bold. † p < .05, †† p < .01, ††† p < .001: indicating a between-group difference, in italic.
Table 6
Pre-swim shower rates for each factor per condition
Control Eyes-only Eyes + Symbol Symbol-only
Sex
Male 36.1 48.2 51.1 49.4
Female 34.5 43.2 39.3 49.4
Age
10-19 16.7 22.2 22.2 25.0
20-29 40.0 46.4 45.5 60.6
30-39 38.3 21.4 55.3 49.1
40-49 16.7 61.1† 47.6 64.3†
50-59 38.5 55.6 26.7 12.5
60-69 27.3 73.1†† 48.1 45.5
70-79 100 33.3 55.6 55.6
80-89 - 100.0 - -
Other people showering
Yes 41.4 55.6 32.8 42.6
No 33.3 41.6 52.1*†† 53.5††
Group
Yes, adults and children
39.3 41.5 53.6 52.6
Yes, one adult and children
46.2 33.3 58.3 52.9
Yes, only adults 30.6 48.8 35.6 40.4
No 0.0 40.0 60.0† 58.8†
Company (< 10 years)
Yes 41.1 41.7 54.3* 52.7
No 25.6 47.2† 38.0 45.1†
Carrying belongings
Yes 30.4 37.0 31.4 37.3
No 40.0 54.7* 64.5***†† 62.0**††
Time of the day
Morning 38.5 43.5 42.6 45.1
Afternoon 24.0 50.0† 44.0 44.4
Evening 38.5 43.9 55.2 73.1*†
Outside temperature
<21 28.6 - - 60.6††
21-25 43.4 45.3 41.3 46.5
25
QUESTIONNAIRES
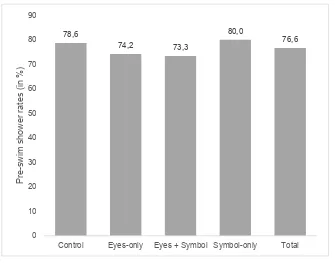
In total, 76,6% of the respondents stated that they had taken a pre-swim shower before entering the swimming pool. Figure 6 shows that the pre-swim shower rates per condition (both the control condition and the three intervention conditions) are relatively equal to each other, indicating that there are no significant differences between the conditions.
A chi-square test was performed to see if there were any significant differences in pre-swim shower rates between the conditions. No statistically significant differences were found.
AWARENESS AND UNDERSTANDING OF THE INTERVENTIONS
In the questionnaire the participants were asked if they had seen the information board regarding showering in the shower room. 47.6% of the participants stated that they had seen the information board, with 27.1% of the participants describing the right information board. From the 27.1% of the participants that described the right information board, 75.0% of the participants described the right goal of the board (take a shower). An overview of the results per condition can be found in table 7.
The information board was best seen (66.7%) and described (45.0%) in the ‘eyes + symbol’ condition. The goal of the information board was best described by participants in the ‘symbol-only’ condition (83.3%).
78,6
74,2 73,3
80,0
76,6
0 10 20 30 40 50 60 70 80 90
Control Eyes-only Eyes + Symbol Symbol-only Total
Pre
-s
w
im
s
h
o
w
e
r ra
te
s
(i
n
%
[image:25.595.123.458.173.436.2])
26 Table 7
Intervention (information board) recognized by participants
Control Eyes-only Eyes+symbol Symbol-only Total
N % N % N % N % N %
See information board (N = 124)
Yes 7 25.0 13 41.9 20 66.7 19 54.3 59 47.6
No 21 75.0 18 58.1 10 33.3 16 45.7 65 52.4
Describe right information board (N = 59)
Yes 0 0.0 1 7.7 9 45.0 6 31.6 16 27.1
No 7 100.0 12 92.3 11 55.0 13 68.4 43 72.9
Describe right goal information board (N = 16)
Yes - - 0 0.0 7 77.8 5 83.3 12 75.0
No - - 1 100.0 2 22.2 1 16.7 4 25.0
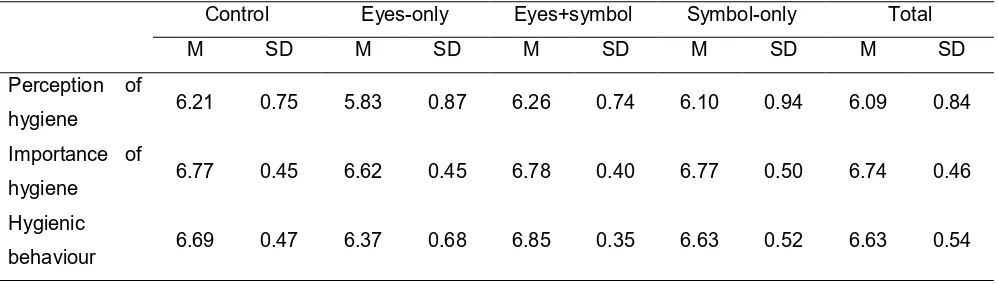
PERCEPTIONS AND IMPORTANCE OF HYGIENE, AND HYGIENIC BEHAVIOUR
The perception of hygiene, importance of hygiene and hygienic behaviour were measured using a respectively 3-item, 3-item, and 2-item scale. All items in these scales were measured on a 7-point Likert scale, with 1: totally disagree and 7: totally agree. The results are presented in table 8.
Table 8
Perceptions and importance of hygiene, and hygienic behaviour per condition
Control Eyes-only Eyes+symbol Symbol-only Total
M SD M SD M SD M SD M SD
Perception of
hygiene 6.21 0.75 5.83 0.87 6.26 0.74 6.10 0.94 6.09 0.84
Importance of
hygiene 6.77 0.45 6.62 0.45 6.78 0.40 6.77 0.50 6.74 0.46
Hygienic
behaviour 6.69 0.47 6.37 0.68 6.85 0.35 6.63 0.52 6.63 0.54
Overall, participants perceived the swimming pool as hygienic, it was rated 6.09 on a seven point scale. Hygiene is important for participants, it was rated 6.74 on a seven point scale. Hygienic behaviour (to show themselves and expected from others) was also rated high, 6.63 on a seven point scale.
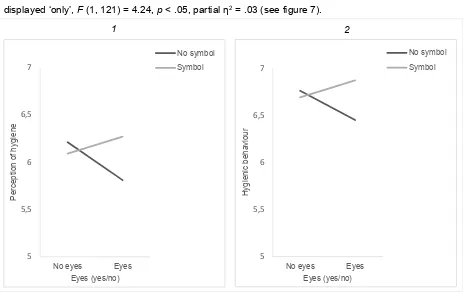
[image:26.595.72.571.441.583.2]27 (combination of eyes and symbol) led to higher scores on hygiene perceptions than when eyes were displayed ‘only’, F (1, 121) = 4.24, p < .05, partial η2 = .03 (see figure 7).
A univariate analysis of variance (ANOVA) with eyes (yes/no) and symbol (yes/no) as independent variables was conducted to gain insights about the influence of eyes and/or symbol on the importance of hygiene. There was no main effect for eyes, F (1, 121) = .22, p = .64, partial η2 = .00. There was no main effect for symbol, F (1, 121) = .88, p = .35, partial η2 = .01. There was no interaction effect, F (1, 121) = .17, p = .68, partial η2 = .00.
A univariate analysis of variance (ANOVA) with eyes (yes/no) and symbol (yes/no) as independent variables was conducted to gain insights about the influence of eyes and/or symbol on hygienic behaviour. There was no main effect for eyes, F (1, 121) = .47, p = .50, partial η2 = .00. The main effect of symbol on hygienic behaviour was marginally significant, F (1, 121) = 3.44, p = .07, partial η2 = .03, with participants who were exposed to the symbol giving marginally significant higher scores on hygienic behaviour than participants who were not exposed to the symbol. There was a significant interaction effect, F (1, 121) = 7.00, p < .01, partial η2 = .06. For eyes, the addition of a symbol (combination of eyes and symbol) led to higher scores on hygienic behaviour than when eyes were displayed ‘only’, F (1, 121) = 9.93, p < .01, partial η2 = .08 (see figure 7).
WATER QUALITY RESULTS
[image:27.595.67.532.84.376.2]A formula presented in the method chapter (data analysis) was used to calculate the release of Urea, NPOC, and TN (mg/L) into the swimming pool by each bather per hour. These results are presented in table 9.
Figure 7. Interaction plots 1) Perception of hygiene, and 2) Hygienic behaviour
5 5,5 6 6,5 7
No eyes Eyes
H yg ien ic b eh av iou r Eyes (yes/no) No symbol Symbol 5 5,5 6 6,5 7
No eyes Eyes
P er ce pt ion o f h yg ien e Eyes (yes/no) No symbol Symbol
28 Table 9
Standardised pollutant release (Urea, NPOC, or TN) per individual bather per hour of water contact (in mg/L)
Control Eyes-only Eyes + symbol Symbol-only
Urea 0.17 0.26 0.11 0.26
NPOC 0.45 0.46 0.60 0.44
TN 1.27 0.56 0.30 0.40
The results of the parameters for each condition (eyes-only, eyes + symbol, symbol-only) were compared to the control condition. A lower count of pollutants (mg/L) indicated a decrease in pollutants in the swimming pool water.
For the urea parameter, the release seems to be relatively steady over the four conditions. This also accounts for the NPOC parameter.
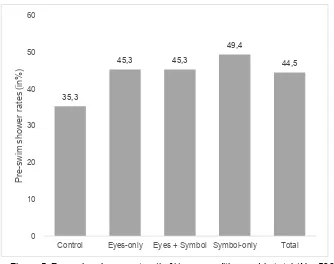
For the TN-parameter, there was a clear difference in release of TN by swimming pool visitors in the ‘eyes-only’, ‘eyes + symbol’ and ‘symbol-only’ condition in comparison to the control condition. The daily load of TN brought into the swimming pool by bathers in the control condition is 1,27 mg/L per bather per hour. In the other three conditions, the daily load of TN brought into the swimming pool by bathers was 0,60, 0,44 and 0,46 mg/L/bather/h respectively. The differences between the control condition and the interventions are 56% (eyes-only), 76% (eyes + symbol) and 68% (symbol-only). Herewith, hypothesis 2 (H2) is supported for parameter TN (total nitrogen).
Data revealed that there might be a relation between the release of total nitrogen in the swimming pool and the mean number of bathers per hour that were in the swimming pool. This relationship is presented in figure 8.
The relationship that might appear here is that the release of total nitrogen is high when the number of bathers per hour is low and that the release of total nitrogen lowers when the mean number of bathers per hour raises.
0,0 0,1 0,2 0,3 0,4 0,5 0,6 0,7 0,8 0,9 1,0
0 5 10 15 20 25
S ta nd ar dis ed TN ( m g/ L/ ba th er /h )
Number of bathers per hour (mean)
[image:28.595.137.459.483.670.2]29
DISCUSSION
GENERAL DISCUSSION
The aim of this study was to increase pre-swim shower behaviour by means of watching eyes interventions. Results from all three research methods provide evidence that watching eyes do increase swim shower behaviour. Furthermore, this study is the first study to prove that interventions for pre-swim shower behaviour reduce the amount of pollution in the pre-swimming pool. Results from the observations show that pre-swim shower rates increase when watching eyes interventions were used. Results from the questionnaires show that the ‘eyes + symbol’ intervention lead to highest scores on hygiene perception and hygienic behaviour. The effect of the interventions on pre-swim shower behaviour is confirmed by the results from the water quality measures, which show that less pollutants are brought into the swimming pool during all three interventions. These results, and results from additional analyses are discussed in detail below.
Results from the observations show that pre-swim shower rates increase during all three interventions. More specifically, results have shown that watching eyes solely and in combination with a symbol were able to influence pre-swim shower behaviour. These results are consistent with the body of literature about the positive influence of watching eyes on prosocial behaviour (Baillon, et al., 2013; Bateson et al., 2013; Bateson et al., 2015; Bateson et al., 2006; Bittner & Kulesz, 2015; Ernest-Jones et al., 2011; Francey & Bergmüller, 2012; Haley & Fessler, 2005; Keller & Pfattheicher, 2011; Nettle et al., 2012; Panagopoulos, 2014a; Panagopoulos, 2014b; Pfattheicher & Keller, 2015; Powel et al., 2012; Rigdon et al., 2009; Sparks & Barclay, 2013). More specifically, these results are consistent with previous studies of the influence of watching eyes on hygienic behaviour (Beyfus et al., 2016; King et al., 2016). It indicates that a watching eyes intervention can be a useful instrument to increase pre-swim shower behaviour.
An interesting finding in this study was the effect of the ‘symbol-only’ intervention on pre-swim shower behaviour. During this intervention, pre-swim shower rates were at highest. A possible explanation for this finding can be that the symbol clearly expressed to swimming pool visitors what behaviour was expected from them. In previous research it was stated that: “A symbol can tell more than a thousand words” (Wogalter & Laughery, 2014, p. 6), indicating that a symbol can express in a glance what behaviour should be shown by for example swimming pool visitors. The statement seems to be applicable to this study.
30 Results from the water quality measures confirm that the decrease of pollution (measured by parameter total nitrogen [TN]) was clearly the highest during the watching eyes + symbol intervention. This finding indicates that the watching eyes did increase pre-swim shower behaviour, with as consequence that less pollution was brought into the swimming pool. The parameter TN decreased with 76% during the ‘eyes + symbol’ intervention. An explanation for the fact that the watching eyes + symbol intervention is most effective can be that the combination of elements does not only lead to better pre-swim shower behaviour, but also increases other hygienic behaviour (for example, not urinating in the pool). This might also explain why the ‘eyes-only’ intervention in general did not lead to a significant increase in pre-swim shower behaviour, but here still show that TN is decreased with 53%. The intervention might have been understood as an intervention for hygienic behaviour. It might be the case that taking a shower before entering the pool is not seen as hygienic behaviour, but urinating for example does. So, watching eyes do not only affect pre-swim shower behaviour but seem also effective in increasing other hygienic behaviour.
Additional analyses for observational data showed that the watching eyes only intervention did affect pre-swim shower behaviour. Previous studies suggested that watching eyes have a positive effect on prosocial behaviour even without an accompanying symbol or message (Bateson et al., 2013; Bateson et al., 2015; Ernest-Jones et al., 2011; Nettle et al., 2012). This study has proven the effect of watching eyes solely. Though, a remark has to be made. The results for the watching eyes only intervention were not significant. An explanation for this non-significance can be that most of the swimming pool visitors did not link watching eyes to pre-swim shower behaviour. To connect watching eyes to pre-swim shower behaviour, not taking a pre-swim shower behaviour must be seen as antisocial behaviour (Bateson et al., 2015; Kraft-Todd, Yoeli, Bhanot, & Rand, 2015). Taking a pre-swim shower then becomes prosocial behaviour that would be shown when people are observed. It seems that not taking a pre-swim shower was not seen as antisocial (and unhygienic) behaviour by most swimming pool visitors, which has led to a small but not significant increase in pre-swim shower rates. This might indicate that there is a knowledge gap regarding the importance of taking a pre-swim shower before entering the swimming pool. It is argued that the effect of watching eyes can be further increased when swimming pool visitors are aware of the importance of taking a pre-swim shower. Future research regarding pre-swim shower behaviour should take this into account. Future research regarding watching eyes should further investigate the underlying process between watching eyes and prosocial behaviour: when are watching eyes effective?
Furthermore, additional analyses showed that there are some interesting results for watching eyes effects when additional factors ‘carrying belongings’ and ‘other people showering’ are taken into account. During all three interventions, swimming pool visitors were more likely to take a pre-swim shower when they did not carry belongings. This outcome is a replication of the findings of Stronks (2015) and Zwilling (2014). Though the possibility to stall belongings was offered in the form of hooks on the wall, it was barely used by swimming pool visitors. Obviously, the storage of belongings has to be further facilitated in order to give swimming pool visitors who do carry belongings the opportunity to take a pre-swim shower. In agreement with Stronks (2015) this requires further examination.