University of Warwick institutional repository: http://go.warwick.ac.uk/wrap
This paper is made available online in accordance with
publisher policies. Please scroll down to view the document
itself. Please refer to the repository record for this item and our
policy information available from the repository home page for
further information.
To see the final version of this paper please visit the publisher’s website.
Access to the published version may require a subscription.
Author(s): Peter J. Bryanston-Cross and Zuobin Wang
Article Title: Camera focusing based on fringe pattern matching
Year of publication: 1997
Link to published article:
http://dx.doi.org/10.1364/AO.36.006498
Publisher statement: Bryanston-Cross, P. J. and Wang, Z. (1997).
Camera focusing based on fringe pattern matching. Applied Optics,
36(25), pp. 6498-6502. © 1997 The Optical Society. This paper was
published in Applied Optics and is made available as an electronic
reprint with the permission of OSA. The paper can be found at the
following URL on the OSA website:
http://dx.doi.org/10.1364/AO.36.006498. Systematic or multiple
Camera focusing based
on fringe pattern matching
Peter J. Bryanston-Cross and Zuobin Wang
A method of camera focusing based on fringe pattern matching is presented. In the method, the variance of the mismatch function is used as a focus measure. The focus measure was examined in a fringe analysis system, and the results from the three well-known focus measures— gray-level variance, image gradient, and Laplacian—were also obtained in the experiment as a comparison. The experimental results show that the focus measure based on fringe pattern matching performs well in peak sharpness, monotonicity, and noise sensitivity and that it has a better performance in noise sensitivity owing to its advantage of averaging noise. © 1997 Optical Society of America
Key words: Focusing technique, focus measure, fringe pattern matching, fringe analysis, optical interferometry.
1. Introduction
Camera focusing is an important technique in ma-chine vision and imaging. This technique is directly related to the accuracy of information in the image acquired from the real world. Many focus measures such as gray-level variance,1– 4 image gradient,1–3
Laplacian,1– 4 and fringe contrast5 have been
pro-posed for camera focusing. The focus measures, in practice, are different in their performances mainly in the sharpness of the peak, monotonicity, noise sen-sitivity, and processing time. It has been found that the gray-level variance is not good in sharpness and that the image gradient, Laplacian, and fringe con-trast are sensitive to noise. A better performance in noise sensitivity may be obtained with low-pass fil-ters in practical use.1
In this paper a method of camera focusing that is based on fringe pattern matching6 –9 is presented.
In the method, the variance of the mismatch function is used as a focus measure for camera focusing. A reference image patch in one fringe pattern and an identical but shifted image patch with the same size as the reference image patch are selected for comput-ing the focus measure. We produce the phase curve of the mismatch function by shifting the image
patches with respect to each other, pixel by pixel, and, at the same time, by calculating the mean-square-difference values for each shift. The signal-to-noise ratio of the fringes is significantly improved because each value of the mismatch function is obtained from averaging M3N pixels if the image patches with the
size of M 3 N pixels are used in the calculations.
Therefore the phase curve obtained from fringe pat-tern matching, compared with the original fringes, has a better signal-to-noise ratio from the statistical point of view, and it also contains the focusing infor-mation of the imaging system because the mismatch function is directly proportional to the square of the modulation of the fringes.
The method of camera focusing based on fringe pattern matching presented in this paper was exam-ined in a fringe analysis system, and it was also compared with the three well-known focus measures— gray-level variance, image gradient, and Laplacian—with the same set of captured fringe pat-terns. The normalized focus measures and their standard deviations were achieved from 250 captured fringe patterns in the experiment.
2. Principle
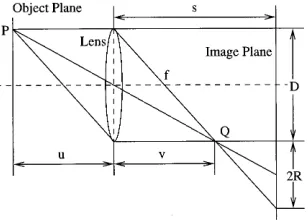
The principle of image formation in a camera,1,2
which is described by a thin-lens model, is shown in Fig. 1. In the figure, P is a point in the object plane and Q is its focused image. The assumed best-focused position is not in the image plane; therefore a blurred or defocused image of P is formed. If the aperture is circular, the blurred image is a circle and it is called a blur circle.1,2 In this case, a captured
The authors are with the Department of Engineering, Univer-sity of Warwick, Coventry CV4 7AL, UK.
Received 19 February 1997; revised manuscript received 5 May 1997.
image is, in effect, the superposition of the light in-tensity distributions of many blur circles. Therefore the captured image is degraded in sharpness or con-trast.
According to geometrical optics and similar trian-gles, the radius of the blur circle R can be calculated by1
R5sD
2
S
1v2
1
s
D
, (1)or
R5sD
2
S
1 f2 1 u2 1s
D
, (2)where s is the distance between the image plane and the lens, D is the aperture diameter, f is the focal length, v is the distance from the focused image to the lens, and u is the distance between the object plane and the lens.
It can be seen from Eqs.~1!and~2!that the size of
R is equal to zero when s equals v. This is the case that the best-focused or sharpest image is theoreti-cally achieved. In practice, however, it is difficult or impossible to measure the size of R in many applica-tions. Therefore the focus measure that describes the sharpness of the image is often used for deter-mining whether the image is in focus. In this re-search, the interference fringe pattern is used as a test object and the presented focus measure is based on fringe pattern matching.
In the case of two-beam interference, the light in-tensity distribution of the kth captured fringe pattern
Ik~m, n!can be written as
Ik~m, n!5ak~m, n!1bk~m, n!cosfk~m, n!,
k50, 1, 2, . . . , (3)
where m is the row number and n is the column number of the sampled fringe pattern; a~m, n! and
b~m, n! are the background illumination and the modulation of the fringes, respectively; andfk~m, n!
is the phase that is normally related to the physical quantity to be measured in optical interferometry;
m5 1, 2, 3, . . . , M0and n51, 2, 3, . . . , N0for the
image size of M03N0pixels.
In fringe pattern matching, the mismatch function
for the fringe patterns with vertical fringes can be calculated by8,9
fk~t!5 1 MNm
(
51M
(
n51N
@Ik~m, n!2Ik~m, n1t!#2,
k50, 1, 2, . . . , (4)
where fk~t! is the mismatch function, M 3 N is the
image patch size used in the calculation, and t is the phase shift number in the matching process.
Consider a measured value of the mismatch function
fqat any point of the phase curve in a set of samples, which is formed by the addition of noise nq to the sample mean value f#q. The measured value fqis
fq5fq1nq, q51, 2, 3, . . . , (5)
where nqdenotes a zero mean noise process,10,11i.e., the expectation that Enqequals 0.
In a measurement of K samples, the standard de-viationscan be calculated by12,13
s5
F
(
q51K
~fq2fq!2
K21
G
1y2
, (6)
where
fq5 1
K
(
q51K
fq. (7)
For discussion of the relationship between the stan-dard deviation achieved from 1 3 1 pixel image patches or one pixel and the standard deviation achieved from M 3 N pixel image patches in the
measurement, the mismatch function can be rewrit-ten as
fk~t!5 1 MNm
(
51M
(
n51N
gk~t, m, n!, k50, 1, 2, . . . , (8)
where
gk~t, m, n!5@Ik~m, n!2Ik~m, n1t!#2,
k50, 1, 2, . . . . (9)
It can be seen that gk~t, m, n!is the mismatch func-tion acquired from one pixel or from an image patch of 1 3 1 pixel. This means that the phase curve obtained from the image patches of M3N pixels can
be expressed as the superposition of M 3 N phase
curves from one pixel. Therefore each value of the mismatch function achieved from M3N pixel image
patches can be considered as the mean of those from 13 1 pixel image patches.
Assuming that the measurements of mismatch function values based on 13 1 pixel image patches are uncorrelated, one can calculate the standard de-viationsMNfor the image patches with M3N pixels
used in the matching process by11,13,14
sMN5 s1
[image:3.612.103.257.38.150.2]~M3N!1y2, (10)
where M 3 N is the number of pixels in the image
patches used for the matching process, ands1is the
standard deviation acquired from the measurement based on one pixel. It is now clear that the direct determination of fringe contrast from the original fringe pattern is based on the data from one pixel, but the determination made by fringe pattern matching is based on the data from M3 N pixels. Therefore fringe pattern matching has the advantage of aver-aging noise.
Because the mismatch function in theory is directly proportional to the square of the modulation of the fringes, its variance is in accordance with the sharp-ness of the fringe pattern. As such the variance of the mismatch function can be used as a focus mea-sure; and the focus measure, like many other focus measures, is a maximum for the best-focused fringe pattern. The focus measure based on fringe pattern matching, MF, therefore can be expressed as
MF~k!51 T
(
t51T
@fk~t!2fk#2, k50, 1, 2, . . . , (11)
where T is the phase shift number in the matching process, and f#k is the mean value of the mismatch function, i.e.,
fk5 1
T
(
t51T
fk~t!, k50, 1, 2, . . . . (12)
Above, it is assumed that the fringes are vertical in the fringe patterns. The method is, in effect, also valid for the fringe patterns in which the fringes are horizontal, oblique, or curved. For the fringe pat-terns with horizontal fringes, Ik~m, n 1 t! must be changed for Ik~m1 t, n!in Eqs.~4!and~9!.
3. Experimental Result
The method of camera focusing based on fringe pat-tern matching was examined with the fringe analysis system as shown in Fig. 2. In the experiment we used a Cohu 4712 CCD camera and a Sigma Macro lens with f 5 50 mm. The camera settings were Gamma, 1.0; AGC, off; and f-number, 2.8. The in-terference fringe pattern produced by the two laser beams from the fibers was projected on the diffuser and it was captured for different positions of the fo-cusing lens. The displacement of the focusing lens was approximately 0.1 mm for each step in the ex-periment.
Figure 3 shows a best-focused fringe pattern, and
[image:4.612.101.257.39.120.2] [image:4.612.327.544.40.213.2]the intensity in row 255 of the best-focused fringe pattern is shown in Fig. 4. Figure 5 shows the phase curve obtained from the best-focused fringe pattern. A blurred fringe pattern, as a comparison, is given in Fig. 6. Figure 7 shows the intensity in row 255 of the blurred fringe pattern, and the phase curve is Fig. 2. Schematic diagram of the fringe analysis system.
[image:4.612.325.542.332.500.2]Fig. 3. Best-focused fringe pattern.
[image:4.612.328.542.536.704.2]Fig. 4. Intensity in row 255 of the best-focused fringe pattern.
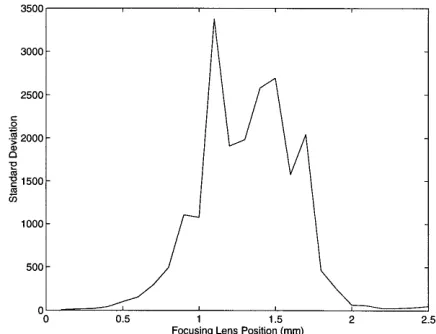
shown in Fig. 8. The focus measure versus the fo-cusing lens displacement is plotted in Fig. 9, and the standard deviation of the focus measure versus the focusing lens displacement is given in Fig. 10. The image patch size of 100 3 512 pixels was used for
calculating the focus measure in the experiment. The standard deviation of the focus measure achieved from 250 captured fringe patterns was better than 0.22% of the maximum value of the focus measure.
4. Discussion
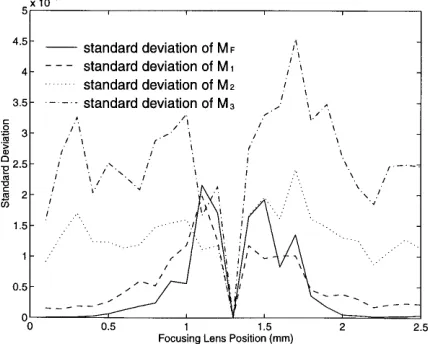
For the discussion of the performance of the focus measure based on fringe pattern matching, the three well-known focus measures1— gray-level variance M1, image gradient M2, and Laplacian M3—as a com-parison were also computed with the captured fringe patterns for the calculation of MFin the experiment. The focus measures were normalized to have the same peak values; we accomplished this by dividing their values by their maximums, as shown in Fig. 11. The standard deviations plotted in Fig. 12 were ac-quired from the normalized focus measures. The mean value of the standard deviation for the focus measure MFwas 0.0005, that for M1was 0.0006, that
[image:5.612.326.544.38.214.2]for M2was 0.0013, and that for M3was 0.0026. It can be seen clearly from Figs. 11 and 12 that the focus measure based on fringe pattern matching has a sound performance in sharpness of the peak, mono-Fig. 6. Blurred fringe pattern.
Fig. 7. Intensity in row 255 of the blurred fringe pattern.
[image:5.612.72.288.40.214.2]Fig. 8. Phase curve from the blurred fringe pattern.
Fig. 9. Focus measure versus focusing lens displacement.
[image:5.612.70.286.328.500.2] [image:5.612.325.543.526.693.2] [image:5.612.71.284.536.709.2]tonicity, and noise sensitivity. The disadvantage of the focus measure is that its calculation is compli-cated and needs more processing time. The focus measure M1 also has a sound performance in noise sensitivity, but it is not good in sharpness. The fo-cus measures M2 and M3 have a better sharpness around the best-focused position, but they are sensi-tive to noise and their monotonicity is apparently affected by noise.
5. Conclusion
The experimental results have shown that the focus measure based on fringe pattern matching performs
well in peak sharpness, monotonicity, and noise sen-sitivity. The signal-to-noise ratio of the fringes is improved significantly because each value of the mis-match function is obtained from averaging M 3 N
pixels if the image patches with the size of M 3 N
pixels are used in the matching process. In practice this method is also useful for fringe-quality analysis. The disadvantage of the focus measure presented in this research is that its calculation is complicated and needs more time in the focusing process.
References
1. M. Subbarao, T. Choi, and A. Nikzad, “Focusing techniques,” Opt. Eng.32,2824 –2836~1993!.
2. J. H. Lee, K. S. Kim, B. D. Nam, J. C. Lee, Y. M. Kwon, and H. G. Kim, “Implementation of a passive automatic focusing algorithm for digital still camera,” IEEE Trans. Consumer Electron.41,449 – 454~1995!.
3. G. Lightart and F. Groen, “A comparison of different autofocus algorithms,” in Proceedings of IEEE International Conference
on Pattern Recognition,~Institute of Electrical and Electronics Engineers, New York, 1982!, pp. 597– 600.
4. E. Krotkov, “Focusing,” Int. J. Comput. Vision 1, 223–237
~1987!.
5. N. Akiyama, H. Makihira, and T. Nakata, “Automatic focusing method using stripe pattern projection technique II: subjects and countermeasures for practical use,” J. Jpn Soc. Precis. Eng.56,2273–2279~1990!.
6. A. Goshtasby, G. C. Stockman, and C. V. Page, “A region-based approach to digital image registration with subpixel accuracy,” IEEE Trans. Geosci. Remote SensingGE-24,390 –399~1986!. 7. A. Kashko, H. Buxton, B. F. Buxton, and D. A. Castelow, “Parallel matching and reconstruction algorithms in computer vision,” Parallel Comput.8,3–17~1988!.
8. Z. Wang, P. J. Bryanston-Cross, and D. J. Whitehouse, “Phase difference determination by fringe pattern matching,” Opt. La-ser Technol.28,417– 422~1996!.
9. Z. Wang, M. S. Grac¸a, P. J. Bryanston-Cross, and D. J. White-house, “Phase-shifted image matching algorithm for displace-ment measuredisplace-ment,” Opt. Eng.35,2327–2332~1996!. 10. K. R. Castleman, Digital Image Processing ~Prentice-Hall,
Englewood Cliffs, N.J., 1979!.
11. M. K. Steven, Fundamentals of Statistical Signal Processing,
Estimation Theory ~Prentice-Hall International, London, 1993!.
12. A. Novini, “Fundamentals of on-line gauging for machine vi-sion,” in Close-Range Photogrammetry Meets Machine Vision, E. P. Baltsavias and A. Gruen, eds., Proc. SPIE1395,736 –746
~1990!.
13. J. F. W. Galyer and C. R. Shotbolt, Metrology for Engineers
~Cassell, London, 1990!.
14. A. Athanasios, Probability, Random Variables, and Stochastic
[image:6.612.69.285.38.205.2]Processes~McGraw-Hill, New York, 1965!. Fig. 11. Normalized focus measures versus focusing lens
dis-placement.
[image:6.612.71.285.251.423.2]