Enhancing Network Intrusion
Detection through Host Clustering
Master’s thesis
W.J.B. Beukema
W.J.B. Beukema:Enhancing Network Intrusion Detection through Host Clustering, July 2016
SUPERVISORS:
Prof. dr. ir. Aiko Pras Dr. Anna Sperotto Luuk Hendriks MSc
Abstract
The state-of-the-art in intrusion detection mainly relies on signature-based techniques. Al-though signature-based detection is an efficient way of protecting against known threats, it will not protect against new, advanced intrusions such as Advanced Persistent Threats (APTs). Moreover, many intrusion detection systems only monitor the network traffic crossing the external border of a network, ignoring the internal network traffic. This research proposes a new approach towards detecting advanced attacks, by focusing on internal network traffic and by using anomaly-based detection. The performance of the anomaly detection is enhanced by using clustering techniques.
Internal network traffic is an undervalued source of information for recognising APT-style attacks. Whereas most systems focus on the external border of the network, we show that APT-style campaigns often involve internal network activity and that certain changes in internal network behaviour are a strong indicator for intrusions. To this end, a framework that shows the relation between attack characteristics and the impact on internal network traffic patterns is presented.
To reduce false positive rates and limit the burden of data processing, we propose an additional step in model-based anomaly detection involving host clustering. Through host clustering, individual hosts are grouped together on the basis of their behaviour on the internal network. We argue that a behavioural model for each cluster, compared to a model for each host or a single model for all hosts, performs better in terms of detecting potentially malicious behaviour. We show that by applying this concept to internal network traffic, the detection performance increases for both identifying malicious flows and identifying malicious hosts.
Contents
Abstract iii
Contents iv
List of Tables, Figures and Listings vii
List of Acronyms and Abbreviations ix
1 Introduction 1
1.1 Problem statement . . . 1
1.1.1 Background . . . 1
1.1.2 The problem . . . 1
1.1.3 Proposed solution . . . 2
1.1.4 Contribution . . . 3
1.2 Research questions . . . 4
1.3 Research methods . . . 4
1.4 Structure of this thesis . . . 5
2 State-of-the-art 7 2.1 Advanced Persistent Threats . . . 7
2.1.1 Definition . . . 7
2.1.2 Life cycle . . . 8
2.2 Intrusion detection techniques . . . 10
2.2.1 Data source . . . 10
2.2.2 Processing method . . . 13
2.2.3 Other . . . 15
3 APTs in internal networks 17 3.1 Internal network traffic . . . 17
3.2 Attack analysis . . . 18
3.2.1 Stuxnet . . . 18
3.2.2 Duqu . . . 20
3.2.3 Flame . . . 21
3.2.4 Carbanak . . . 23
3.3 Attack characteristics . . . 24
3.3.1 Attack metric . . . 24
3.3.2 Expand Access . . . 24
3.3.3 Strengthen foothold . . . 25
3.3.4 Perform attack . . . 25
3.4 Conclusion . . . 25
CONTENTS v
4 Network host clustering 27
4.1 Clustering methods . . . 27
4.1.1 Selecting clustering algorithms . . . 27
4.1.2 k-means clustering . . . 29
4.1.3 Mean shift clustering . . . 30
4.1.4 Louvain community clustering . . . 31
4.1.5 Stochastic Blockmodel Clustering . . . 34
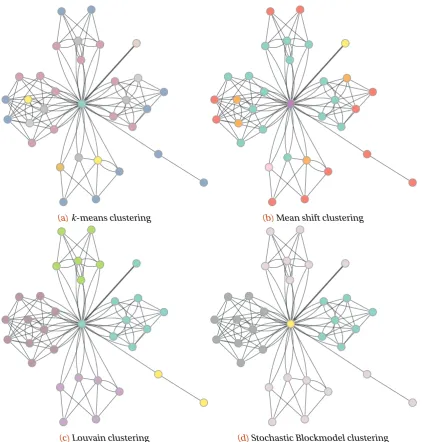
4.1.6 Evaluating clusterings . . . 35
4.2 Host clustering . . . 36
4.2.1 Rationale . . . 37
4.2.2 Requirements . . . 40
4.2.3 Evaluation . . . 41
4.2.4 Conclusion . . . 44
5 Anomaly detection 47 5.1 Model-based anomaly detection . . . 47
5.1.1 Process . . . 47
5.1.2 Data . . . 48
5.1.3 Time frame . . . 50
5.2 Feature selection . . . 51
5.2.1 Common approaches . . . 51
5.2.2 APT-relevant features . . . 51
5.3 Anomalous behaviour . . . 54
5.3.1 Support Vector Machines . . . 55
5.3.2 Applying data and scoring . . . 56
6 Evaluation 59 6.1 External data sources . . . 59
6.1.1 Requirements . . . 59
6.1.2 Evaluation . . . 60
6.1.3 Caida 2008-2016 . . . 61
6.1.4 DEF CON 2009-2015 . . . 61
6.1.5 KDD 1999 and DARPA 1999 . . . 61
6.1.6 LBNL 2005 . . . 62
6.1.7 UNB ISCX 2012 . . . 62
6.2 Proof-of-concept . . . 62
6.3 Results . . . 62
6.3.1 Preprocessing . . . 63
6.3.2 Clustering . . . 64
6.3.3 Classification . . . 64
6.4 Conclusion . . . 69
7 Conclusion 71 8 Discussion and future work 73 8.1 Discussion . . . 73
8.1.1 Verification data . . . 73
8.1.2 Future attacks . . . 73
vi CONTENTS
8.1.4 Reliability of input data . . . 74
8.2 Future work . . . 74
8.2.1 Alternative clustering methods . . . 74
8.2.2 Different data sources . . . 74
8.2.3 IPv6 compatibility . . . 74
8.2.4 Broader application . . . 75
A Proof-of-concept implementation 77 A.1 Generating network traffic . . . 77
A.2 Preprocessing . . . 77
A.3 Clustering . . . 78
A.4 Analysis . . . 79
List of Tables, Figures and Listings
Figure 1.1 Basic example of identifying anomalous behaviour based on cluster-level
internal network communication patterns. . . 3
Table 1.2 Research methods per subquestion. . . 5
Figure 2.1 The relationship between APTs and targeted attacks. . . 8
Figure 2.2 Overview of the SecureWorks APT life cycle. . . 9
Figure 2.3 Taxonomy of the different characteristics of IDSs . . . 11
Table 3.1 Overview of observable characteristics in the internal network traffic, set out against the studied APT campaigns. . . 24
Figure 3.2 Examples of how internal network structures may change as the result of an APT intrusion. . . 26
Figure 4.1 Possible taxonomy of clustering methods. . . 28
Table 4.2 Overview of the reviewed clustering methods, with their classes and type of input. . . 28
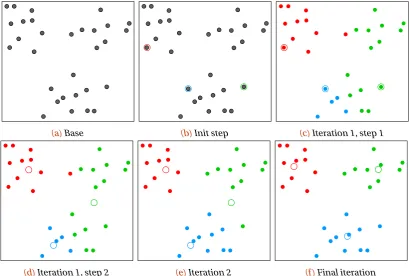
Figure 4.3 An example of running thek-means algorithm using a two-dimensional feature space. . . 30
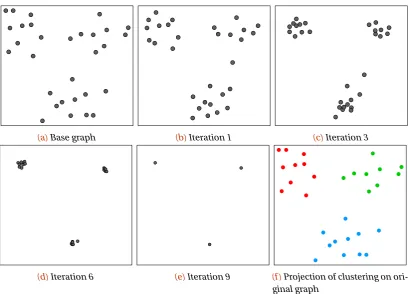
Figure 4.4 An example of running the mean shift algorithm using a two-dimensional feature space. . . 31
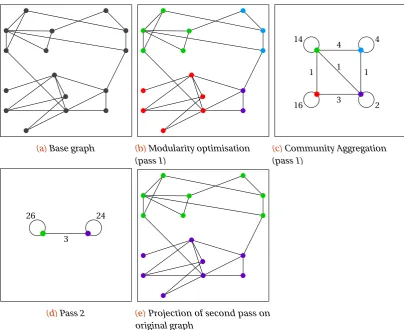
Figure 4.5 An example of running the Louvain community clustering algorithm. . . . 33
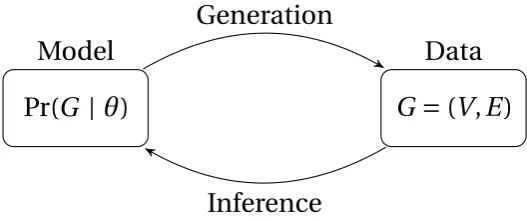
Figure 4.6 Relation between model and observed data according to the Stochastic Blockmodel principle. . . 34
Figure 4.8 Comparison of clustering techniques on the UNB ISCX 2012 data set. . . 39
Table 4.9 Overview of the partitioning per clustering method with their correspond-ing colour and size in figure 4.8. . . 39
Table 4.10 ARI scores between the clusterings of figure 4.8. . . 40
Table 4.11 An overview of the used methodology per clustering method requirement. 41 Table 4.12 Overview of stability tests for the assessed clustering methods. . . 42
Table 4.13 Average number of alterations before cluster changes occur relative to the number of hosts/edges, for the UNB ISCX 2012 data set. . . 43
Listing 4.14 Pseudo-code representation of test C3. . . 43
Table 4.15 Overview of the minimum, maximum and average ARI between two exact same network instances for each clustering method. . . 44
Table 4.16 Computational complexity (classification) ofk-means, means-shift, Louv-ain and Stochastic Blockmodel clustering. . . 44
Table 4.17 Qualitative evaluation of the investigated clustering methods. . . 45
viii LIST OF TABLES, FIGURES AND LISTINGS
Figure 5.1 Flow diagram of the proposed host clustering-based anomaly detection algorithm. . . 47 Figure 5.2 Relationship between the level of information and the obtainability for the
various data types. . . 50 Table 5.3 Overview of flow-based features relevant for network intrusion detection. 52 Table 5.4 Overview of relevant IPFIX fields for network traffic anomaly detection. . 53 Table 5.5 Likelihood of observing behaviour in internal network traffic for the
ana-lysed APT campaigns, for each of the characteristics from section 3.3. . . . 54 Figure 5.6 Example of adding a categorical featuref4to numeric feature setw. . . . 57
Figure 5.7 Example of a two-dimensional SVM with training data and test data using the RBF kernel withγ=0.001. . . 57
Table 6.1 Overview of publicly available network data sets. . . 61 Table 6.2 Flow-related statistics extracted from the UNB ISCX 2012 data set and its
labelling. . . 63 Table 6.3 The number of clusters and their cluster sizes for each each data entity in
the UNB ISCX 2012 data set. . . 64 Table 6.4 Overview of relationship between possible performance classifications. . 65 Figure 6.5 ROC curves for flows based on comparing UNB ISCX 2012 data from
Saturday 12 June against Sunday, Monday and Tuesday, respectively. . . . 67 Table 6.6 The true positive rate (TPR), false positive rate (FPR) and the accuracy
(ACC) for the highest accuracy for each clustering per data set, based on flows. . . 67 Figure 6.7 ROC curves for hosts based on comparing UNB ISCX 2012 data from
Saturday 12 June against Sunday, Monday and Tuesday, respectively. . . . 68 Table 6.8 The true positive rate (TPR), false positive rate (FPR) and the accuracy
(ACC) for the highest accuracy for each clustering per data set, based on hosts. . . 68
List of Acronyms and Abbreviations
ACC Accuracy . . . 67, 68 APT Advanced Persistent Threat . . 4, 5, 7–11, 17, 18, 21–26, 51, 53, 54, 59, 66, 71, 73, 75 ARI Adjusted Rand Index . . . 36, 38, 40, 43, 44, 79
C&C Command and Control . . . 8, 18–24, 52
DHCP Dynamic Host Configuration Protocol . . . 50, 75 DNS Domain Name System . . . 12, 49, 50, 78
FPR False Negative Rate . . . 67, 68
IDPS Intrusion Detection & Prevention System . . . 10 IDS Intrusion Detection System . . . 10–15, 17, 59 IETF Internet Engineering Task Force . . . 49 IOC Indicator of Compromise . . . 13 IPFIX IP Flow Information Export . . . 49, 52, 53 IPS Intrusion Prevention System . . . 10 IPv4 Internet Protocol version 4 . . . 12, 53, 74, 75 IPv6 Internet Protocol version 6 . . . 12, 53, 74, 75
MCMC Markov chain Monte Carlo . . . 35
P2P Peer-to-Peer. . . 19 PCAP Packet Capture . . . 49, 50, 77, 78
RBF Radial basis function . . . 31, 55–57 ROC Receiver Operating Characteristic. . . 65–68, 79
SBM Stochastic Blockmodel (clustering) . . . 28, 34, 35, 38, 42, 64, 67–69, 79 SVM Support Vector Machine . . . 55–57, 69, 79
TPR True Positive Rate . . . 67, 68
UNB ISCX University of New Brunswick, Information Security Centre of Excellence . . 39, 43, 61–64, 66–68
1
Introduction
In this chapter, an introduction is given to the problem behind the research of this thesis. The problem statement is discussed (section1.1), followed by the introduction of the research questions (section1.2). Furthermore, the proposed research methods are discussed in section
1.3. Finally, an overview of the structure of this thesis is provided in section1.4.
1.1 Problem statement
1.1.1 Background
In the last decades, cyber-attacks have had a significant impact on the security of businesses and organisations. In 2014, the cost of cyber-attacks on world-scale was estimated to range frome300 billion toe600 billion annually [46]. Especially advanced, targeted cyber-attacks are a serious threat to businesses and organisations worldwide. As targeted attacks are getting more sophisticated every year, targeted attacks are amongst the biggest security threats to businesses and organisations [66].
A means to detect this kind of attack are intrusion detection systems. Even though there are various methods to detect intrusions, these advanced monitoring tools are dominantly misuse-based or anomaly-based. The former relies on signatures, which are created after human analysis of discovered threats. The latter relies on analysing a system’s behaviour in an automated way, which makes it possible to detect unknown attacks.
Currently, most commercial intrusion detection systems are misuse-based [26]. An inevitable result of this approach is that detecting undiscovered threats is rather difficult, as there are no signatures available for these threats beforehand. Especially advanced, targeted threats, such as Advanced Persistent Threats, are hardly detectable using this approach, as they often use zero-day vulnerabilities.
As threats are likely to become stronger and more advanced in the long term, anomaly-based detection can provide a more flexible approach in keeping up with these threats compared to misuse-based detection.
1.1.2 The problem
The problem is that in order to detect advanced network intrusions such as Advanced Persistent Threats, a misuse-based defence is insufficient. For this reason, anomaly-based methods are necessary. However, the current anomaly-based detection methods used in this domain have severe shortcomings.
2 CHAPTER 1. INTRODUCTION
In some traditional network-based anomaly detection approaches, a model is created for each individual host in a network. Based on these models, the intrusion detection system analyses all network traffic for each host and tries to detect abnormalities. However, this approach suffers from several drawbacks. For instance, individual host models often result in high false positive rates, caused by the fact that minor changes in the host’s behaviour may be considered to be anomalous. Additionally, this method does not scale well to large networks, making this approach impractical for deployment in larger networks.
Another approach is creating a single model for a network as a whole. Although this solves scalability issues, the pitfall of this approach is that by taking too many hosts together, important details may get lost. Consider a host that usually behaves as a workstation, suddenly starts behaving like a server. Although this would be certainly an anomaly, the behaviour the host in question shows in the new situation itself is not anomalous, as there are other hosts in the network showing the same behaviour. Therefore, it is unlikely to be flagged as anomalous using this approach.
Given the fact that anomaly-based detection is able to identify threats that misuse-based attacks cannot identify, research in the field of anomaly detection is of vital importance to keep up with the progressing cybersecurity landscape. Improvements to existing anomaly-based detection approaches, in particular with respect to detection rates, are necessary to achieve this.
In other words, the problem is that despite currently being the best option to identify un-discovered threats, anomaly-based intrusion detection suffers from some serious limitations which may make its use impractical. The fundamental question therefore is how anomaly-based intrusion detection can be improved such that it is feasible to use it in practice.
1.1.3 Proposed solution
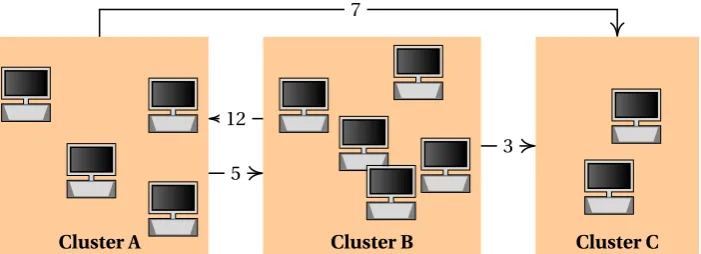
For this research, in trying to find which method provides the best way to find anomalies, it is investigated how host clustering can be used to enhance the performance of anomaly-based intrusion detection. To this end, we propose an enhancement to existing anomaly-anomaly-based intrusion detection methods that involves clustering host entities acting on the internal network. When analysing a network of hosts, we propose grouping the entities into clusters, based on similarities between the entities. For each cluster, a model will be created that describes how entities within the cluster are expected to behave. Based on these models, it is examined how anomalous behaviour can be detected. To illustrate this concept, a simplified example is given in figure1.1.
This concept of cluster-based modelling is applied to internal network traffic, i.e. network traffic between hosts on the local network that does not involve the (external) Internet. We argue in this work that internal network traffic is a valuable source of information to detect advanced intrusions and that our approach works well with internal network traffic data.
1.1. PROBLEM STATEMENT 3 Cluster A 3 4 1 2 Cluster B 7 8 9 6 5 Cluster C 10 11 5 12 3 7
(a)Sample model for a network consisting of three clusters. The edges indicate traffic flows between hosts in the clusters, the weight is a measure for the average intensity of the traffic. The hosts in each cluster are expected to adhere to their cluster’s behaviour.
Cluster A 3 4 1 2 Cluster B 7 8 9 6 5 Cluster C 10 11 5 13 2 3 5 13
[image:13.595.125.476.88.215.2](b)Instance of interactions within the sample network, compared to the above model. Black interactions indicate behaviour that is (close to) the behaviour as described in the above model, while red interactions are anomalous. For simplicity, inner-cluster flows have been omitted.
Figure 1.1:Basic example of identifying anomalous behaviour on cluster-level internal network communication patterns. Note that the proposed anomaly detection system takes many more characteristics into account.
Model-based detection is not new in the domain of intrusion detection, as was discussed in the previous section. However, with our solution, an approach in between the existing per-host modelling and a single model is taken. It takes advantage of considering multiple hosts at one time, while trying to distinguish between different classes of hosts. To the knowledge of the author, no similar research has been conducted before.
We argue that the proposed approach overcomes both issues of high false positive rates and scalability through the clustering aspect. Grouping similar hosts is likely to well-represent the ‘average’ behaviour of these hosts, making small-changes in behaviour less anomalous. Also, because the number of clusters is strictly smaller than the number of hosts, fewer models have to be stored and therefore this method scales better to larger networks.
1.1.4 Contribution
4 CHAPTER 1. INTRODUCTION
More generally, the proposed technique of applying clustering can be applied in other domains than just internal network traffic. Even though this research focuses on internal network traffic, the proposed method may be applied to solutions such as external network traffic analysis, user behaviour analysis and host behaviour analysis. In this sense, a more general contribution of this research is providing a new way of enhancing anomaly detection when dealing with vast amounts of data.
1.2 Research questions
Based on the problem statement in the previous section, we derive the following main research question:
How well does internal network traffic anomaly detection based on host clustering perform in detecting network attacks such asAPTs?
The first part, ‘internal network traffic anomaly detection based on host clustering’, refers to the methodology that we investigated. As part of this, methods have been developed that group network hosts into clusters, models ‘normal’ behaviour of hosts within each cluster, and subsequently detects abnormalities based on this modelled behaviour.
The performance of this approach is measured in terms of effectiveness (the expected false positive/false negative rate) and efficiency (the overhead/computational complexity of the algorithm). To rank this performance, both performance factors are compared with similar methods.
The focus of the developed methods are, as the last part of the research questions suggests, on detecting anomalies caused by advanced network attacks such as APTs. As has been mentioned before, these attacks are hard to detect using traditional mechanisms and are therefore an interesting topic for research.
From this, the following sub research questions are derived:
1. How do targeted network intrusions impact internal network traffic patterns?
2. How can hosts within a network be divided into clusters of hosts with similar behaviour?
3. How can models, representing normal behaviour, be derived from network host clusters?
4. How can the behaviour of clusters be used to identify anomalous behaviour?
5. How well does the suggested approach perform in terms of detection rates and overhead?
1.3 Research methods
1.4. STRUCTURE OF THIS THESIS 5
Finally, for the fifth subquestion the developed algorithm is evaluated in order to be able to make statements about its performance.
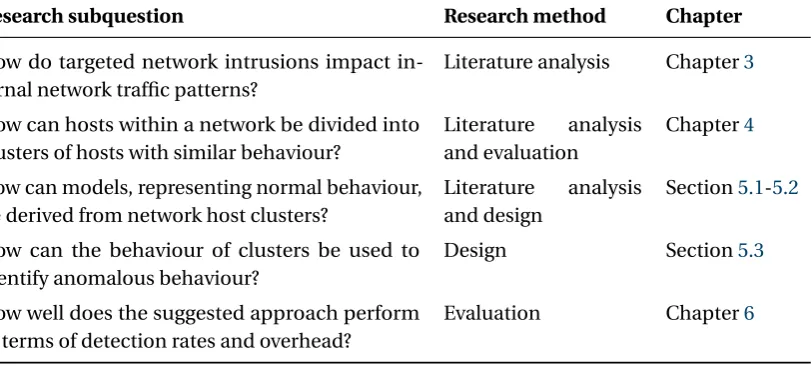
[image:15.595.103.509.175.358.2]An overview of the proposed methods per research question is provided in table1.2.
Table 1.2:Research methods per subquestion, as outlined in section1.2.
Research subquestion Research method Chapter
How do targeted network intrusions impact in-ternal network traffic patterns?
Literature analysis Chapter3
How can hosts within a network be divided into clusters of hosts with similar behaviour?
Literature analysis and evaluation
Chapter4
How can models, representing normal behaviour, be derived from network host clusters?
Literature analysis and design
Section5.1-5.2
How can the behaviour of clusters be used to identify anomalous behaviour?
Design Section5.3
How well does the suggested approach perform in terms of detection rates and overhead?
Evaluation Chapter6
1.4 Structure of this thesis
The next chapters will address the different research subquestions. Chapter2discusses the state-of-the-art in this field of research by introducing the concept of Advanced Persistent Threats and providing a literature review on existing intrusion detection techniques. Chapter3
2
State-of-the-art
In order to provide some background information for the context of this research, this chapter will discuss the current state of research regarding Advanced Persistent Threats (section2.1) and give a literature overview of intrusion detection system techniques (section2.2).
2.1 Advanced Persistent Threats
2.1.1 Definition
Advanced Persistent Threat (APT) is a type of cyber attack, which is usually managed by well-skilled and well-funded attackers, often targeting specific organisations or sectors. Goals APT campaigns may have include stealing information, theft of assets, and damaging the target. Whereas APTs used to be directed at political and military targets, there has been a shift towards enterprise targets [24].
APTs are characterised by the following:
Advanced The adversary is highly skilled, and has significant resources. In contrast to tradi-tional malware, APTs are targeted: they are specifically designed for the target and involve manual actions from the attacker’s side.
Persistent The adversary is able to infiltrate in to a network, where it remains hidden for a long time (either passively or actively). Using a Command and Control channel, the attackers are able to continuously monitor, extract data from and send commands to the target.
Threat Traditionally, for APTs the adversary’s goal is to obtain sensitive information, such as intellectual property, trade information or political information. However, more recent attacks show attackers may have different goals, such as damaging or destroying the target, manipulating data of the target, etc.
The unusual stealth, advanced skill set of the attackers and the vast resources available to them result in a powerful type of attack with a remarkably high success rate [7].
The term APT was coined in 2006 by analysts of the United States Air Force to describe complex cyber-attacks against specific targets over a longer period of time [7]. Roughly a decade later on, the term ‘Advanced Persistent Threat’ is still used in the cybersecurity domain to describe this kind of threat. However, there exists controversy on whether it is the right term for the type of threat it tries to describe. Some prefer the termtargeted attack, as the ‘targeted’ element is a rather important feature that is not part of the APT acronym. Strictly speaking however, APTs form a subset of targeted attacks, containing the most advanced types of targeted attacks, as is shown in figure2.1. For instance, cyber espionage or spear phishing in itself can be seen as targeted attacks, while they are not necessarily APTs.
8 CHAPTER 2. STATE-OF-THE-ART
APTs
More damaging, expensive and exclusive
Damaging, but more common
Comp lexit
y/uniqu enes
s Resou
rce con
su m
pt ion
Prevalence Targeted Attacks
Figure 2.1:The relationship betweenAPTs and targeted attacks.
2.1.2 Life cycle
There has been a lot of research in the typical behaviour of APTs and the various stages an attack can be in. For instance, Hutchins et al. [35] present a life cycle for advanced intrusions, accompanied with a Courses of Action Matrix, providing a framework for risk managers in detecting and mitigating such attacks. Brewer [7] provide a general framework for describing the phases of intrusion in case of a targeted computer network attack, which are discussed below. The Dell SecureWorks APT life cycle [20], another often-used model, shows strong similarities with Brewer’s framework. A visualisation of the Dell SecureWorks model is shown in figure2.2.
The stages described by Brewer and their link to the Dell SecureWorks life cycle are:
Reconnaissance The adversary gathers as much information as possible on the target. This includes, but is not limited to, the crawling of websites for information, collecting email addresses, structuring social relationships, and information concerning specific techno-logies used by the target. This phase matches the first five stages of figure2.2.
Compromising the target Based on the gathered information, the adversary will select one or more entry points to gain foothold in the network environment. For this, the adversary will create malware that will be used for intruding on the network. This could, for instance, be a malicious attachment (e.g. a PDF file), a malicious applet (e.g. using an Adobe Flash vulnerability) or a trojan. This may involve the use of one or more zero-day exploits. To compromise the network, often social-engineering techniques are used. One way would be to usespear phishing, i.e. luring a user (that has access to the target environment) to open a specially crafted website or attachment to infect the system. Alternatively, a user could be tricked into attaching a malicious USB device to a system connected to the network. This phase matches theDeploymentandInitial intrusionstages of figure2.2. Increasing foothold As soon as the attacker has compromised a target machine, it will do its
2.1. ADVANCED PERSISTENT THREATS 9
Advanced
Persistent
Threat
Define target(1) Find and organise accomplices (2) Build or acquire tools(3) Research target infra-structure / employees(4) Test for detection(5) Deployment (6) Initial intrusion(7) Outbound connection initiated(8) Expand access and obtain cre-dentials(9) Strengthen foothold(10) Exfiltrate data(11) Cover tracks and remain undetected (12)Figure 2.2:Overview of the SecureWorksAPTlife cycle. Adapted from [20].
infections are detected. Often, a command and control (C&C) channel is set up so that the adversary can remotely give instructions to the infected machines.
Lateral movement After establishing its foothold, the attacker will move around the network in order to identify the system or systems that are valuable to them. Often, the APT will try to move around to other systems using default credentials or by guessing passwords. Therefore, it may be less likely to be discovered at this stage. Note that unlike untargeted attacks, this stage is usually carried out manually. This and the previous phase match theOutbound connection initiated,Expand access and obtain credentialsandStrengthen footholdstages of figure2.2.
Carrying out attack If the attacker’s goal is to obtain sensitive information, the attackers will try to move the target data outside the network once found. Again, to make this action difficult to detect, evasion techniques are applied, e.g. encrypting the target data before moving it around the network, or hiding a file using steganography in a legitimate looking file.
Alternatively, the attacker may manipulate data during this stage. When the adversary’s goal is to destroy, damage or disrupt, the attack usually happens as soon as the attacker reached the right system(s). Depending on the goal, this stage might (in contrast to stealing information) immediately attract a lot of attention as a result of the attack.
10 CHAPTER 2. STATE-OF-THE-ART
Hiding Often, after APTs have achieved their goal, they try to hide their tracks. As they have control over various systems, they may try to alter log files to make it appear that the APT was never there. This makes analysing APTs afterwards hard, as the available evidence may be tampered with. This phase matches the final stage of figure2.2.
2.2 Intrusion detection techniques
From section2.1, it follows that detecting APTs is harder than traditional malware, as a result of the sophistication of the attacks.
A class of solutions that intend to detect suspicious behaviour in a network environment are calledIntrusion Detection Systems (IDSs). Usually, IDSs gather information from various types of system and or network sources. Subsequently, the information is analysed in order to identify possible intrusions on the system monitored [21]. Typically, IDSs only flag suspicious behaviour, and notify system administrators to take further actions. This is in contrast to
Intrusion Prevention Systems(IPSs), in which case the system itself takes action to mitigate a possible attack, for instance by blocking suspicious connections. Due to the high similarity between IDSs and IPSs, they are sometimes calledIntrusion Detection and Prevention Systems
(IDPSs) in literature. In this analysis however, the focus will be on IDSs.
IDSs come in many different forms using different methods and algorithms. In the next subsections, a number of important characteristics are discussed. An overview of the taxonomy of IDSs can be found in figure2.3.
2.2.1 Data source
The first factor on which IDSs differ, is the source of the data on which the IDS makes its decisions. IDSs are usually host-based or network-based, although hybrid options combining the two exist as well.
2.2.1.1 Host-based
Host-based IDSs work, as the name suggests, on single hosts to detect suspicious behaviour. The events and behaviour of a single host are monitored for suspicious activity. Usually, this entails monitoring log files, running processes, file access, file modification/deletion and system configuration changes. Also, this may include incoming and outgoing network traffic of the host [62].
Host-based intrusion detection is mostly installed on the host itself. Traditional detection and prevention systems, such as virus scanners and firewalls, could be seen as host-based intrusion detection and prevention systems.
The advantage of this approach is the level of detail available to the IDS: virtually everything the machine is doing can be monitored by the IDS. In contrast to network-based approaches1, the contents of packets can always be analysed at application-layer level. A downside of a host-based approach is the overhead it causes on the resources of the machine. Even more disadvantageous is the limited scope of host-based IDSs: in a network of hosts communicating with each other, a host-based IDS would only look at individual hosts and not take the bigger picture into account. This could as a result reduce the effectiveness of the solution.
2.2. INTRUSION DETECTION TECHNIQUES 11
IDS
Data Source
Host-based
Network-based
Cloud-based
Processing Method
Misuse
Signature-based
Rule-based
State transition-based
Data mining based
Anomaly
Statistical
Distance-based
Rule-based
Model-based
Profile-based Time aspect
Real-time
Off-line
Architecture
Centralised
[image:21.595.122.466.86.447.2]Distributed
Figure 2.3:Taxonomy of the different characteristics ofIDSs, adapted from [61].
2.2.1.2 Network-based
As a main characteristic of APTs is the strong network component, it may be beneficial to look from a network-level when trying to detect advanced network threats. Network-based detection approaches look at parts of a network to analyse the traffic and protocol data in order to detect intrusions.
Typically, a network-based IDS consists of multiple sensors, which monitor and analyse network activity on one or more network segments [62]. Generally, there are two ways in which sensors are deployed. One way is to force all network traffic to pass through the sensor, making it an
inline sensor. This type of sensor is usually combined with a firewall, which uses the same approach. As a result, this approach makes it possible to filter malicious traffic. The downside of this approach is that it might create a bottle neck at the sensor, delaying the network traffic if the sensor cannot process the packets quickly enough. Another option would be to copy network traffic without actually making the actual traffic pass the detector, i.e. aparallel sensor. In this case, an alert may be given when a suspicious network flow is detected, upon which action can be undertaken by the user; the IDS itself cannot actively intervene.
12 CHAPTER 2. STATE-OF-THE-ART
traffic [3].
The data processed by this type of IDS is solely network data. For each network layer (e.g. OSI model layers [72]), an IDS could potentially extract information which it may use to identify threats, such as:
Data Link Layer This layer handles the frames exchanged between physical components of the network. The data link layer is rarely taken into account by network-based IDSs.
Network layer Responsible for addressing and routing network data, the network layer provides information such as source and destination IP addresses. Next to the IPV4 and IPV6 protocol running on this layer, the Internet Control Message Protocol (ICMP) is also used. Next to the IP address information, additional fields from the packet headers (such as Time to Live) may be useful in characterising network patterns.
Transport Layer This layer is responsible for transmitting data between hosts, and is therefore useful for network-based approaches in order to identify communication patterns. On this layer, TCP and UDP are mainly used. Each TCP segment and UDP datagram has a port number for both source and destination. Due to the connection-oriented nature of TCP, information about the session between source and destination can also be used in tracking communication patterns.
Application Layer Even a step further would be to inspect the contents of the application layer. Analysing data on this level is also calledDeep Packet inspection, emphasising the depth of the analysis. Application-specific information from protocols such as Hypertext Trans-fer Protocol (HTTP), Domain Name System (DNS), and Simple Mail TransTrans-fer Protocol (SMTP) may be used to identify threats. Some protocols, such as SSL/TLS and SSH, make inspection at this level harder, as the actual payload carried by this layer is encrypted.
An advantage of network-based intrusion detection is that it offers extensive detection capab-ilities. Running intrusion detection from a network level perspective provides a view on the ‘bigger picture’, whereas host-based solutions usually only take individual hosts into account. Running sensors in a network will, if deployed correctly, not reduce the performance of the hosts. A network-based approach is also more flexible compared to host-based approached in the sense that it does not require new hosts to be configured in order to be monitored. Every device connected to the network will be automatically be monitored.
A drawback of this approach is that under high loads, the IDS may either not be able to process all traffic or will cause network traffic congestion. The former could apply to passive sensors, simply dropping packets, while the latter could apply to inline sensors. Hence, it is important that a network-based IDS has enough capacity to process items, possibly scaling with the network load. Another issue, which has already been addressed, is the possibility that encryption is applied at application-layer level, making it harder to carry out a full analysis on the network traffic. Especially for forensic-level analysis, this is a downside. Nevertheless, information gathered from the other levels can still be analysed, which is considered to provide sufficient information to identify intrusions [61].
2.2.1.3 Cloud-based
2.2. INTRUSION DETECTION TECHNIQUES 13
While the advantage of on-premises deployment of an IDS is the complete control over all the systems and data, the downside is the cost on hardware, software and maintenance. A cloud-based IDS can offer increased scalability, speed and support, as it is often provided by a specialised company on a large scale. An additional advantage is that the organisation does not have to keep up with the latest technologies and functionalities in order to ensure an acceptable level of security.
Even more interesting, cloud-based IDS providers often centrally correlate the data gathered at their clients’ site with multiple intelligence sources at once [52]. This makes it also possible to use the data to detect new, undiscovered threats, with the additional advantage of being able to apply the intelligence directly to all customers. Thus, in terms of analysing and researching new attacks, cloud-based IDSs provide the most flexible mechanism. However, since the captured data has to leave the premises, some organisations fear privacy issues, making it the main barrier for deploying this type of IDS.
2.2.2 Processing method
Sabahi and Movaghar [61] distinguish between misuse methods and anomaly methods with regards to intrusion detection. Also, within those methods, a number of subtypes can be specified.
2.2.2.1 Misuse
Misuse detection is based on knowledge of known attacks and system vulnerabilities, often provided by human experts. Within this approach, it is usually necessary to have extensive knowledge on the common practises and to keep up-to-date with developments in order to provide security against intrusions [42].
Signature-based methods Within a signature-based approach, the IDS tries to find so-called signatures in the observed behaviour. The signatures are a predefined set of patterns of known intrusions, maintained in a database by the IDS. Therefore, only known attacks can be found; new attacks need to be updated over time.
Rule-based methods A rule-based system relies on a set ofif-thenrules to characterise com-puter attacks. Similarly to signature-based methods, this is often based on known attacks or known attack vectors.
State transition-based methods In a state transition system, the IDS maintains a final state machine in which each state corresponds to a state within the IDS, often based upon network protocol stacks or integrity and validity of files or running processes. When a flagged state is reached, the situation is reported as a possible intrusion.
Data mining based techniques In a data mining approach, the IDS bases its decisions on a database with past events, all labelled either ‘normal’ or ‘intrusive’. A learning algorithms will train itself based on this database. Based on this information, the IDS will recognise known attacks or variations on it. The advantage of this approach is that models of misuse are created automatically and is better able to detect variations (in contrast to the approaches above).
14 CHAPTER 2. STATE-OF-THE-ART
Details of IOCs can be relatively easily be shared and used for (manual) analysis or automated detection. In an effort to quickly exchange indicator of compromise data among systems, there have been initiatives to standardise a format describing the indicator(s), sharing the threat intelligence [17].
2.2.2.2 Anomaly
Anomaly-based intrusion detection tries to identify deviating patterns, comparing test data to a defined baseline of normal behaviour [42]. Compared to misuse detection, anomaly-based intrusion detection offers a more dynamic, flexible approach, as it may also detect unknown intrusions.
Statistical methods By measuring certain variables over time (e.g. traffic intensity, number of open connections, time a user is logged in for, keystrokes, etc.) statistics are applied to find deviations. This can for instance be achieved by keeping the average of the variables, and comparing how the new situation relates to these averages. If new values differ too much from the averages, it is marked as a possible intrusion. Alternatively, the IDS can derive a probability distribution for the variables and evaluate the probabilities for the new situation.
Distance-based methods Distance-based anomaly detection tries to detect anomalies by com-puting distances between multidimensional points representing several variables. Major approaches include nearest-neighbour, density-based and clustering. If a certain point, representing an analysed event, cannot be linked to existing clusters, it can be considered as abnormal behaviour. The main advantage of distance-based over statistical methods is that is more flexible in taking multiple variables into account.
Rule-based methods IDSs relying on rule-based anomaly detection have predefined know-ledge of what is considered to be normal behaviour. When a host deviates from this pattern, it is identified as a possible intrusion. Because of the statical approach, this kind of anomaly detection will not automatically adapt to changing situations.
Model-based methods Similar to rule-based intrusion detection, in a model-based approach the normal behaviour of a monitored system is defined and formalised into a model. An anomaly is detected as deviation of the model.
Profile-based methods Profile-based intrusion detection has a profile of normal behaviour for each type of network traffic, hosts, program, etc. based on historic data. Profiles are usually build using data mining techniques or heuristic-based approaches. Again, when is deviated from this pattern, the IDS will mark this as a possible intrusion.
2.2.2.3 Comparison andstatus quo
2.2. INTRUSION DETECTION TECHNIQUES 15
for instance, an organisation with a high security level is likely to accept a high false positive rate if this means it increases the true positive rate.
As mentioned before, misused-based approaches require manual input and do not account for new, undiscovered threats, in contrast to anomaly-based approaches. Anomaly-based approaches however usually have higher false positive rates compared to misuse-based [3], as unexpected but harmless behaviour may be seen as a potential threat.
In this day and age, there are various IDSs available, such as those provided by FireEye, Dell Secureworks, Fortinet and Trend Micro [60]. Despite the significant research in the field of an-omaly detection, modern intrusion detection systems tend to focus on misuse techniques, with none or very little anomaly techniques. Mainstream solutions therefore rely on the intelligence provided by the provider, which in turn relies on manual analysis of known threats.
2.2.3 Other
Additionally, IDSs can differ in the moment at which the detection is applied. Usually, an IDS will detect intrusions real-time or near real-time. In this case, the IDS will work with the data as it comes in, goes through and goes out the network on-the-fly. An alarm will be raised as soon as a possible intrusion is detected, so that sufficient countermeasures can be taken if necessary. Alternatively, an offline IDS will analyse network data at a later point of time. This post-analysis is usually performed as a form of audit. Although offline IDSs reduce the overhead burden on a network, it is not considered to be sufficient to ensure high security [42].
3
APTs in internal networks
This chapter explores the impact of Advanced Persistent Threats (introduced in section2.1) on internal network traffic. First, an introduction of the relevance of internal network data on intrusion detection is discussed (section3.1), after which a number of APT campaigns are structurally analysed (section3.2). Next, a framework is presented that describes the relationship between APTs and internal network traffic (section3.3). Finally, conclusions on this chapter are drawn in section3.4.
3.1 Internal network traffic
One of the characteristic features of an APT is the tendency to target network infrastructures instead of targeting individual hosts. When considering the APT life cycle (figure2.2), especially theExpand access and obtain credentials,Strengthen footholdandExfiltrate dataphases are likely to involve internal network traffic.
What follows from the analysis in section2.2, is that common intrusion detection mechanisms are misuse-based, and even those mechanisms that are anomaly-based are usually network-based and focus on data between the border of the internal network and the external network. Intrusions found using these approaches are likely to be in theInitial intrusion,Outbound connection initiatedorExfiltrate dataphases.
If the existing intrusion mechanisms would have a 100% success rate at detecting APT-style attacks, the attack would be detected at an early stage, therefore not requiring any additional detection measures. However, since a perfect success rate is unlikely to be realised, one should consider how false-negatives can be detected at later stages. This is in line with the defence-in-depth principle.
With existing, common IDS technologies, networks are protected according to the eggshell principle [64]: strong on the outside, soft on the inside. In other words, the border between the internal network and the (external) Internet is well-monitored, while the activity of hosts on the internal network is hardly taken into account. This implies that once an attacker has gained foothold in the target environment, it can relatively easily move around the network in order to expand its access, making it more likely the attacker will be able achieve its goal.
As intrusion detection ought not to solely depend on intercepting APTs in theInitial intrusion
andOutbound connection initiatedphases, it is vital to develop methods to detect intrusions in the later stages as well. As these stages seem to have a strong component of internal network traffic, it is worthwhile to investigate this area further.
In the remainder of this chapter, it will be investigated whether and how existing Advanced
18 CHAPTER 3. APTS IN INTERNAL NETWORKS
Persistent Threats use the internal network infrastructure as part of the threat and how internal network patterns change as a result.
3.2 Attack analysis
In order to gain insight into how APTs operate, this section will provide a literature review of APT campaigns.
When it comes to studying APT campaigns, it is often only possible to perform a black box analysis on the motivations behind the attack and the used methods. This is mainly due to the fact that for most APTs it is unclear whom are behind it, what their real motivations are and what their exactmodus operandiis. The lack of this background information means that the analysis of APTs often comes down to contemplating what happened based on an interpretation of the available facts.
For this review, literature that (a) describes campaigns that are conform to the definition of APTs (as in section2.1), (b) provides a sufficient level of detail to evaluate their impact on internal network traffic, and (c) is from a authoritative source, were selected.
As there is a very limited number of peer-reviewed literature available that describe the inner workings of APTs in detail, other literature is taken into account as well. Research institutes such as the Laboratory of Cryptography and System Security (CrySyS Lab, Budapest University of Technology and Economics) and cybersecurity companies such as Kaspersky and Symantec provide detailed threat reports on some campaigns in which systematically is assessed how the APT malware works and how the attackers operated throughout the campaigns.
Based on these requirements, the following four APT campaigns will be discussed: Stuxnet (section3.2.1), Duqu (section3.2.2), Flame (section3.2.3), and Carbanak (section3.2.4). Each campaign is introduced by a short overview, followed by an analysis of its behaviour per life cycle stage. Also, an overview of the APT’s effect in internal network traffic is provided.
3.2.1 Stuxnet
Stuxnet [41] is a threat first discovered in July 2010. Analysis showed the target was an Iranian nuclear facility that enriched uranium. Stuxnet was designed to change the rotor speed of the centrifuges in such a way that it would destroy the centrifuges, and thus disturbing Iran’s nuclear programme. It did so by infecting industrial control systems (ICSs), which control the hardware on which such facilities are ran (called PLCs).
3.2. ATTACK ANALYSIS 19
3.2.1.1 Attack phases
Reconnaissance The researchers of the Symantec report [23] concluded that the attackers must have obtained the schematics of the ICS as part of the reconnaissance phase, which enabled the attackers to adjust Stuxnet such that it would successfully destroy the cent-rifuges. It is highly likely that the attackers used a mirrored environment with the ICS hardware to test their code. Based on the analysis of Stuxnet’s executables, it was found that Stuxnet targeted five different organisations.
Compromising the target It is highly likely that the initial intrusion took place by attaching an infected removable drive, supposedly at clients of the targeted organisations. The attack-ers managed to infect partnattack-ers of the five target organisations, which in turn infected the target organisations through their removable drives.
Increasing foothold / lateral movement Given the environment Stuxnet intends to operate in (i.e. computers not having access to the external Internet or not networked at all), it propagates itself through LAN and removable drives to increase foothold.
Stuxnet contains many features that enabled it to spread itself through the network. It ab-used vulnerabilities in the Windows Print Spooler, SMB and WinCC, and copies/executes itself on remote computers through network shares. The latter entails trying to copy itself to all available network resources and execute on the remote share using either security credentials found on the local computer or domain, or through a WMI Explorer impersonation.
Performing the attack Because of Stuxnet’s target environment, the code to sabotage the target systems is part of the Stuxnet executable itself. C&C channels are used to instruct infected machines that have access to the external Internet, while the target systems (which often do not have such access) cannot be controlled in this way. However, Stuxnet uses a peer-to-peer mechanism to update the executable on all machines of an infected network. An infected host that has access to the Internet could get instructed to download a new version of the executable and distribute it to the other hosts on the internal network. Through this, the attackers are still able to some extent command/control all infected machines, although not directly or machine-specific.
In brief, the P2P structure was set up as follows: every infected machine installs and starts an RPC server and client. Any other compromised host on the network can connect to the RPC server to query the installed version of Stuxnet on the remote host. If the remote version is newer, then the local computer will request a copy of the new version and will update itself. If the remote version is older, the local computer will prepare a copy and send it to the remote computer.
Covering tracks Stuxnet has a built-in, fixed kill date of June 24, 2012. From that day on, it will no longer infect machines through removable drives. Additionally, it tries to erase itself from infected machines on that date.
3.2.1.2 Network data behaviour
A few observations regarding the network aspects of Stuxnet:
20 CHAPTER 3. APTS IN INTERNAL NETWORKS
Windows Print Spooler vulnerability sends a WPS request to a host with a shared printer. If the infected host never exchanged data with the destination or never used WPS on the destination host before, the action is likely to be marked as anomalous.
• The peer-to-peer mechanism to propagate updated versions of Stuxnet through a local network can also result in anomalous behaviour, as Stuxnet does not take into account which hosts an infected host usually communicates with.
• Stuxnet may build a complete peer-to-peer network, meaning that a host may have multiple peers. As will become apparent in the next section, this is different from the peer-to-peer mechanism as used in Duqu, in which a peer-to-peer network seems to consist of one middle man that helps one or more (individual) hosts.
3.2.2 Duqu
Closely related to Stuxnet is Duqu [2]. Discovered in 2011, Duqu appears to target machines that may have interesting information with regards to attacking ICSs.
According to Bencsáth et al. [2], Duqu re-uses a lot of source code found in Stuxnet. However, unlike Stuxnet, Duqu only seems to capture system information (including key strokes, screen-shots, browser history and system logs), whereas Stuxnet’s main goal seemed to be destroying a certain type of ICS. Duqu would infect machines through a zero-day vulnerability in Microsoft Word. Duqu-infected machines could receive instructions from the attackers over a C&C chan-nel. Communication over the channel took place over HTTP, obfuscated as JPEG images. After 30 to 36 days, Duqu would self-destruct itself in order to limit traceability.
3.2.2.1 Attack phases
Reconnaissance Even though Duqu does not seem to have a specific target, it follows from analysis that it is targeting intelligence data and assets from entities such as industrial infrastructure and system manufacturers. Possibly, the goal of this is to conduct a future attack against another party relying on these systems [23].
Compromising the target In order to infect a target, spear phishing was used. For this, a zero-day injected Microsoft Word document was used, that takes advantage of the way the Windows kernel used to handle embedded fonts. Through this, Duqu installed itself on the target machine.
Increasing foothold / lateral movement Duqu can be commanded to replicate through net-work shares. On some of these infections, a non-default configuration file was created, in which the newly infected machine configured itself to not use the external C&C server, but send all data to the infecting machine, therefore creating a peer-to-peer C&C infra-structure. Thus, all communication is passed through the infecting computer, making it possible for the attackers to even get access to devices that are not connected to the Internet.
3.2. ATTACK ANALYSIS 21
external Internet, (some) hosts from the insecure zone can. Thus, creating a peer-to-peer C&C network may not be flagged up as malicious, even though effectively hosts in the secure zone are controlled from the external Internet. Additionally, as only one compromised computer in the network will connect directly to the C&C server, there is only one host showing suspicious traffic to outside the network.
Performing the attack When a machine is infected, the attackers were able to download addi-tional modules to the malware, making it possible to use keyloggers, save screenshots, and steal documents and emails.
Covering tracks By default, Duqu has a lifespan of 30 - 36 days, after which it tries to erase itself from the machine. The C&C server could however extend this period.
3.2.2.2 Network data behaviour
A few observations on the network aspects of Duqu:
• As discussed before, the peer-to-peer option that Duqu supports is a smart way to make the APT successful. However, the very same technique is likely to result in deviating network patterns, as this means that there will be more traffic between the infected machine and its proxy.
• In case that a single host is proxy for one or more other machines, the host will exchange noticeable amounts of data to the C&C servers. This might be visible in the network data.
• The simple fact that infected machines are controlled manually from a C&C channel means that this may result in anomalous patterns, just as with the other examined APTs.
3.2.3 Flame
Although first detected in 2012, it is believed that Flame had been created five to seven years earlier [69]. Flame spied the target through a keylogger, by taking screenshots, intercepting emails, making microphone recordings, eavesdropping Skype calls and even connect through Bluetooth to nearby devices to download contact information. Flame infections took mainly place in the Middle East; it is believed the main goal of Flame was espionage, without targeting a specific industry.
An analysis of Flame showed that it infected USB drives in order to replicate, using the same two zero-day vulnerabilities used in Stuxnet. Beyond this, there are no signs that Flame is made by the same team behind Stuxnet or Duqu. Another way Flame propagated itself is through impersonating the Windows Update Server. In order to successfully do this, it performs a complex attack using an old certificate that relied on MD5 for its digital signatures, used in the Microsoft Windows operating system. Over 80 domains were used as command and control servers, which communicated over HTTP, HTTPS and SSH. Flame is able to recognise over 100 security products, and adopts itself depending on which products were found. Due to the highly advanced, sophisticated attacks part of the APT, experts have suggested the attack is state funded [69].
3.2.3.1 Attack phases
22 CHAPTER 3. APTS IN INTERNAL NETWORKS
particular target, other than collecting intelligence, such as sensitive emails, documents and messages.
Compromising the target While it remains unclear how the initial infection was done, it is likely to have been through spear phishing or drive-by downloads.
Increasing foothold / lateral movement Flame can both replicate through hardware and through networks. Regarding the former, Flame can infect USB media such that upon connecting to a new (vulnerable) host, the host get infected as well. Regarding the latter, Flame can infect other computers in the network through printer sharing and remote job tasks. Also, if an infected host is a domain controller, it will create backdoor accounts on the hosts controlled by that host and infect those machines as well.
Using a highly sophisticated way to propagate itself through the network, Flame acted like a Windows Update server. As described by Symantec [65], a non-infected machine might use NetBIOS to query the network in order to find the WPAD server to get proxy settings. An Flame-infected machine will answer, claiming to be the WPAD server. All traffic from the non-infected machine will now be forwarded through the infected machine, serving as a proxy server. After this, when the machine tries to access Windows Update, the proxy will impersonate a Windows Update server and send a Flame loader (that appears to be signed by Microsoft) over Windows Update. The loader will be executed by Windows Update and subsequently infect the machine with Flame.
Performing the attack Flame’s main goal is to gather sensitive information. To do so, Flame sniffs network traffic, takes screenshots, records audio from microphones and records key strokes using a keylogger. In addition, it is even capable of turning the infected computer into a Bluetooth beacon, trying to connect to near Bluetooth devices to look for sensitive information. The information is sent over the C&C channels over SSL on a regular basis.
Covering tracks A self-destruct command could be sent over the C&C channel to let Flame erase all its files and remove itself from the machine.
3.2.3.2 Network data behaviour
When considering how the network traffic patterns might change as a result of a Flame injection, one observes:
• Again, an obvious abnormality would be the communication to the C&C servers con-trolled by the attackers. Even though the communication is sent over SSL, the patterns of the C&C communication can possibly still be observed in the network traffic.
• The mechanism used by Flame to impersonate a Windows Update server certainly gives different network patterns. For instance, all traffic of a host is passed through another host acting as a proxy, for at least the period necessary to install Flame on the machine.
3.2. ATTACK ANALYSIS 23
3.2.4 Carbanak
Carbanak [38] is an APT campaign discovered in 2015, mainly targeting financial institutions. It is estimated that between 500 million USD and 1 billion USD were stolen by the criminals through various means. In contrast to ‘traditional’ APTs, which focus on business-critical information, the goal of this APT was to steal money on a big scale, making Carbanak a cyber version of bank robbery.
3.2.4.1 Attack phases
Reconnaissance The main target of Carbanak was the financial sector. The report suggests that the attackers must have had insider knowledge, as Carbanak looks for tools that are mainly used within the financial world, such as tools to make large transactions.
Compromising the target The first penetration into the system was performed through spear phishing. The emails sent included malicious attachments that exploited vulnerabilities in Microsoft Office systems. Through the vulnerabilities, malware was installed that sets up a C&C channel. If certain banking applications are detected, special notifications are sent to the C&C server.
Increasing foothold / lateral movement According to the Kaspersky report [38], in most cases the target’s network was compromised for between two and four months. Within this time, as many as hundreds of computers within a single target were affected. In this period of time, the attackers observed the behaviour of the users in order to learn about the normal routine. This information was then used to get access to the right victims and systems, and eventually to get the cash out.
As mentioned before, Carbanak enabled the attackers to study the workflow of users. Carbanak did so not only by traditional means such as keyloggers and taking screenshots, but it also video recorded users of the victim systems using video equipment such as webcams and security cameras. As a result of this, the attackers were able to observe how the systems were typically used, i.e. to understand the daily routine of their users in the target environment. This enabled the attackers to copy their behaviour in great detail without being noticed.
Performing the attack As a result of the in-depth analysis performed as part of the lateral movement stage, the attackers were able to select who to impersonate on the infected system. For instance, the attacker would insert fraudulent transactions to the internal database of the victim’s financial software, making the attacker’s movements hardly noticeable.
Additionally, sensitive information could be stolen as well. Classified emails, manuals, crypto keys and passwords were found on the C&C servers, giving the attackers internal knowledge about the systems of the targeted institutions.
Covering tracks The attacks stopped after $10 million was stolen. It does not follow from the report whether or how Carbanak covered its tracks after its mission was completed.
3.2.4.2 Network data behaviour
24 CHAPTER 3. APTS IN INTERNAL NETWORKS
• An obvious deviation would be the communication between the infected machines and the attacker’s servers over C&C channels. Even though the communication itself was encrypted, the patterns of a C&C channel might still be observed in the network traffic.
• In the lateral movement phase, the attackers used common tools such asAmmyy Admin and SSH servers to control the victim’s machine. As these tools may be usually accessed from within the internal network, seeing such traffic leaving the internal network may have been observed.
3.3 Attack characteristics
3.3.1 Attack metric
Having reviewed a variety of APT campaigns in section3.2, it has become clear that existing APTs often have aspects that alter internal network traffic patterns. To illustrate this, a frame-work is constructed which lists the methods used by the investigated APTs that may cause different internal network traffic patterns. Using the APT life cycle (see section2.1.2), various components are discussed.
3.3.2 Expand Access
A common tactic in order to expand the access within a network is to probe other nodes in the network in order to test whether they are vulnerable. There are various ways to perform this; some APTs seem to performde factoa port scan, others try to see if hosts are vulnerable to specific vulnerabilities by querying a limited number of ports. Also, which hosts are queried varies: one could scan the whole network, a certain subnet or specific IP addresses. Harder to detect are APTs which study the behaviour of the infected host to see which hosts it usually connects to, and only queries these hosts.
In summary, when APTs are trying to expand their access, it is common to probe other hosts to see if they can be infected. As a result, new connections between hosts may appear. In table3.1, these characteristics are listed as EA1 and EA2.
Table 3.1:Overview of observable characteristics in the internal network traffic, set out against the studiedAPTcampaigns.
Description Ca
rba
nak
F
lam
e
D
u
q
u
S
tuxne
t
Expand Access
EA1 Probing all available hosts for vulnerabilities - X X X
EA2 Probing known hosts for vulnerabilities X - - -Strengthen foothold
SF1 Use peer-to-peer C&C (infected host as C&C proxy) - - - X
SF2 Use peer-to-peer network to update threat - - X
-SF3 Lead traffic over local proxy - X -
-Perform attack
PA1 Extract information: use of staging server - - - X
-3.4. CONCLUSION 25
3.3.3 Strengthen foothold
The strengthen foothold phase could also cause observable changes in network patterns. Es-pecially when the network consists of hosts that are not connected to the Internet, a common technique seems to set up peer-to-peer infrastructures to enable the attackers to get access to those machines. These infrastructures may, as seen in Duqu and Stuxnet, be used to give new instructions or update the malware. Additionally, for gathering intelligence or stealing credentials to get more foothold, a proxy infrastructure may be set up to eavesdrop on network data, as seen in Flame.
In other words, APTs may set up new communication infrastructures as a means to get to their target. These infrastructures may result in new connections and different flow sizes. These characteristics are referred to as SF1, SF2 and SF3 in table3.1.
3.3.4 Perform attack
Depending on the goal of the attackers (such as stealing information, damaging/destroying infrastructure, performing malicious actions), an APT may cause abnormal network patterns. When the goal is to steal intelligence, the APT may transfer the information through the network, for instance when the information comes from a host that has no connection to the Internet. Similarly, when the goal is to perform malicious actions, the commands sent by the attacker may result in uncommon patterns.
Thus, depending on the goal of the attackers and the network infrastructure, APTs may alter the internal network patterns as well. These types of attack are listed as PA1 and PA2 in table
3.1.
Figure3.2provides some examples from the characteristics of table3.1, visualising how the char-acteristics may result in observable, anomalous behaviour. Note that these are simplifications; in reality, the behaviour caused by APTs may not be as obvious as in the given situations.
3.4 Conclusion
After having analysed four major APT campaigns and having identified their characteristics, it is possible to make some statements about the relationship between APT campaigns and internal network traffic patterns.
A conclusion that can be drawn from the analysis is that the reviewed APT campaigns are indeed unique in their methods. As a consequence, misuse-based approaches are highly unlikely to detect this type of attack.
Still, it is possible to identify similarities between the underlying approach taken by the attackers, as there are steps that the attacks share. For each of the attacks, it is possible to identify the actions taken in the various APT life cycle stages. Thus, despite their uniqueness, it possible to make higher level statements about APT behaviour.
26 CHAPTER 3. APTS IN INTERNAL NETWORKS
SECURE ZONE
(a)Base situation
SECURE ZONE
(b)EA1
SECURE ZONE
(c)EA2
SECURE ZONE
(d)SF1
SECURE ZONE
(e)SF2
SECURE ZONE
(f )SF3
SECURE ZONE
(g)PA1
SECURE ZONE
[image:36.595.96.504.94.681.2](h)PA2
![Figure 2.2: Overview of the SecureWorks APT life cycle. Adapted from [20].](https://thumb-us.123doks.com/thumbv2/123dok_us/9767821.477783/19.595.131.461.90.419/figure-overview-secureworks-apt-life-cycle-adapted.webp)
![Figure 2.3: Taxonomy of the different characteristics of IDSs, adapted from [61].](https://thumb-us.123doks.com/thumbv2/123dok_us/9767821.477783/21.595.122.466.86.447/figure-taxonomy-different-characteristics-idss-adapted.webp)