Faculty of Behavioral Management and Social Science
Effect of different forms of pre-defined hypotheses on
supporting inquiry learning in a simulation environment
Master Thesis
Educational Science and Technology
Xiulin Kuang
Supervisors:
Prof. Dr. A.J.M. de Jong
1
Table of contents
Abstract ... 2
1. Introduction ... 3
2. Conceptual framework ... 5
2.1 Inquiry learning ... 5
2.2 Influencing factors of inquiry learning ... 5
3. Method ... 7
3.1 Participants ... 7
3.2 Design ... 7
3.3 Instrumentation ... 7
3.3.1 To be verified and to be falsified hypothesis ... 7
3.3.2 Go-Lab inquiry learning spaces ... 8
3.3.3 Tests ... 10
3.4 Measuring inquiry process... 14
3.5 Procedure ... 15
4. Results ... 15
4.1 Difference between conditions on knowledge test ... 16
4.2 Difference on inquiry process based on reflection test ... 18
4.3 Difference on inquiry process based on coding scores ... 21
4.4 Influence of students’ belief ... 21
5. Discussion ... 24
References ... 28
Appendix A ... 31
Appendix B ... 32
Appendix C ... 33
Appendix D ... 35
Abstract
The purpose of this study was to examine differences in effect of two forms of pre-defined hypotheses: to be falsified (TBF) and to be verified (TBV) hypotheses in a simulation-based inquiry learning environment. TBF and TBV hypotheses respectively denote pre-defined hypotheses that are meant to be falsified or verified by inquiry results. The present study used a quasi-experimental pretest and posttest design. The effect comparison was implemented based on both domain knowledge acquisition and inquiry process. Thirty-seven second-year Dutch students from a pre-university school were first grouped by gender and then randomly assigned to either one of the conditions to keep the same proportion of female and male students under each condition. Results showed no significant differences between conditions on both knowledge acquisition and inquiry process. Students’ beliefs on the given hypotheses were also considered as probable influencing factors. Comparison among students who were given different pre-defined hypotheses and held different beliefs on these hypotheses found no significant difference either, indicating students’ beliefs have the same non-significant impact on students from TBV and TBF group.
3
1.
Introduction
Inquiry learning is an active learning approach within which students explore problems or phenomena in a way that is applied by scientists – asking questions, generating hypothesis, designing experiments and reaching conclusions. The growing call for inquiry learning in science education is based on the recognition that science is essentially a question-driven, open-ended process and that students must be involved in the process to understand this fundamental aspect of science (Edelson, Gordin, & Pea, 1999). With the development of information technology, computer simulations arose as a promising platform that can support inquiry learning. A computer simulation is an interactive program that models a natural or artificial system or process (de Jong & Van Joolingen, 1998). Compared with traditional lectures and textbooks, simulation-based inquiry has the advantages that students can systematically explore the hypothetical situations in a relatively realistic inquiry context, can change the time-scale of events and make attemps without stress, and can interact with simplified versions of inquiry process or systems (Van Berkum & de Jong, 1991). By using computer simulation, students can be actively involved in authentic inquiry practices.
However, the advantages of simulation-based inquiry can be realized only when appropriate supports are provided. Inquiry learning is widely regarded as a difficult process for students (de Jong, 2006; Eckhardt, Urhahne, Conrad, & Harms, 2013; Gijlers & de Jong, 2009). De Jong and van Joolingen (1998) concluded that learners could encounter problems during all the main processes of inquiry learning, including: generating and stating testable hypotheses; designing effective experiments; making prediction and interpreting data as well as monitoring and reflecting what they have done. Empirical studies also confirmed that instruction with minimal guidance or even no guidance is less effective and less efficient than appropriately guided learning processes in facilitating learning (Hmelo-Silver, Duncan, & Chinn, 2007; Kirschner, Sweller, & Clark, 2006; Mayer, 2004).
This study will concentrate on the support for the hypothesis generation phase in a simulation-based inquiry environment. This is firstly because hypotheses play an important
role throughout the whole inquiry learning process. To be more specific, hypotheses not only
hold the initial and tentative ideas of students on problems or phenomena, but also provide a base of information for subsequent inquiry phases (Kim & Pedersen, 2011). For instance, hypotheses can give direction to experiment design phase, of which the variables stated in the hypotheses are needed to be translated into manipulable and observable variables (de Jong, 2006). In addition, the hypotheses can also guide evidence accumulation and conclusion making phases to decide whether to confirm or disconfirm the hypotheses (Klahr & Simon, 1999; Piekny & Maehler, 2013).
Earlier studies have demonstrated that providing learners with complete pre-defined hypotheses has positive impact on learners’ inquiry learning. Njoo and de Jong (1993) provided students with an open-ended assignment on mechanical engineering, within which either free text blocks to present hypotheses or complete ready-made hypotheses were provided to two groups of students. The results revealed that those students who were provided with pre-defined hypotheses got higher scores in domain correctness of learning processes and showed a higher global activity level. Inspired by this work, Gijler and de Jong (2009) created three experimental groups to further compare the effectiveness of three levels of detailed hypotheses. One group of students did not receive any support for hypotheses generation; one group had a hypothesis scratchpad which allowed students to compose hypotheses from separate elements such as variables, relations and conditions; and the last group received a set of pre-defined hypotheses about the domain. The findings indicated that complete pre-defined hypotheses could lead to better knowledge acquisition on relations and greater number of discussed hypotheses than the other two conditions.
However, there is little study examining the impact of different forms of pre-defined hypotheses on students’ inquiry learning. Gijlers and de Jong (2009) introduced the pre-defined hypotheses presented in their experiment as “a list of 26 propositions about the domain”. Njoo and de Jong (1993) clarified the pre-defined hypotheses used in their experiments as “the hypotheses were stated in an affirmative or negative sense, could be verified or falsified, and differed in complexity”. Both studies ended with the general effectiveness of all kinds of pre-defined hypotheses without further discussion on the influence of different forms of hypotheses. Pre-defined hypothesis is still too general to illuminate which kind of hypotheses presented to students is more effective in facilitating inquiry learning. It is of practical importance to move one step further to figure out whether the form of hypothesis statement will make any difference on students’ inquiry outcomes, thus exploring a more detailed rule to guide the use of pre-defined hypotheses as an inquiry support.
The physics domain of electric circuit was selected as the main topic for the inquiry learning in present study. Two key reasons could account for this: First, electricity is all around our everyday life, and it is no surprising that students can infer some basic ideas about electricity from their daily experience. Hence, there is more chance that students could have more interest on electric circuit. Second, students’ intuitive ideas about electric circuit are incomplete and conflict with scientific explanations of electric circuits (Jaakkola, Nurmi, & Veermans, 2011). It is meaningful for students to bridge the knowledge gap through their own inquiry.
5
2.
Conceptual framework
This section will introduce the main concepts included in this study. Firstly, the definition of inquiry learning in present study will be introduced based on previous researches. This will be followed by an introduction of two important influencing factors of inquiry learning considered in this study. At last, the research questions and the corresponding hypotheses will be presented.
2.1 Inquiry learning
Different forms of definitions on inquiry learning can be found in the abundant
literature. In general, three main perspectives can be concluded: a personal, a functional and a process perspective. The personal perspective highlights the active role of learners in the learning process, and stresses that learners construct their own knowledge in doing science (Gijlers & de Jong, 2005; Njoo & de Jong, 1993a). The functional perspective emphasizes the aimed effects of inquiry learning. In this perspective, engagement in inquiry can promote development and transformation of both domain knowledge and scientific learning skills (Lazonder, Hagemans, & de Jong, 2010; Njoo & de Jong, 1993a, 1993b; Zacharia et al., 2015). The process perspective lays stress on the classification of inquiry learning processes. From this point of view, inquiry is regarded as a series of scientific exploring processes that resembles what scientists do (Pedaste et al., 2015). Taking all these three aspects into consideration, in this study, inquiry learning is defined as a learning approach that learners need to engage in an exploring process, during which students can improve both their content knowledge and inquiry process.
All these three aspects of inquiry learning were reflected in present study. With regards to personal perspective, students needed to actively participate in a simulation-based inquiry environment to construct knowledge about a specific domain. As for the functional aspect, the domain knowledge acquisition and the inquiry process were the two main dimensions in assessing the effects of suspected influencing factors. Regarding the inquiry process, a simulation-based inquiry learning environment was structured and designed according to a scientific division of inquiry learning phases.
2.2 Influencing factors of inquiry learning
Prior knowledge
Prior knowledge is one of the often mentioned influencing factors on inquiry learning.
Research on scientific reasoning illustrated that compared with students with low domain knowledge, students with high domain knowledge are more likely to select investigative strategies and execute strategies effectively (Alexander & Judy, 1988). In addition, learners with high prior knowledge could carry out their inquiry process in a goal-oriented and well-planned way, while learners with low prior knowledge performed unsystematically (Hmelo, Nagarajan, & Day, 2000).
knowledge about the domain to be explored, who do not know the syntactic characteristics of a testable hypothesis and who cannot distinguish dependent and independent variables, generating a testable hypothesis about a specific domain all by themselves is scarcely possible. In the present study, the domain to be inquired by students was beyond their lesson scope to ensure they had less prior knowledge on the domain. This decision was made by considering that direct presentation of information (in this case complete hypotheses) is more appropriate for students who lack prior knowledge for completing a task (Zacharia et al., 2015).
Prior belief
Prior belief is another factor that could influence inquiry learning. Prior belief bias scientific reasoning in the sense that when data conflict with prior beliefs, people are often reluctant to relinquish them or to make major changes to their underlying ideas about the situation (Chinn & Brewer, 1993). When presented belief-enhancing information (information that is in line with what one believe in), learners readily assimilate it to their existing belief system which require little cognitive effort. By contrast, belief-threatening information can urge learners to deal with their resistant to change and motivate learners to engage in more sophisticated reasoning and to process extensively in refute the given information (Klaczynski, Gordon, & Fauth, 1997). Besides, researches on scientific reasoning found that many cognitive behaviors can be biased by people’s prior belief, including hypotheses generation, data interpretation, evidence evaluation and drawing conclusion (Croker & Buchanan, 2011; Ditto & Lopez, 1992; Greenhoot, Semb, Colombo, & Schreiber, 2004; Klahr & Simon, 1999). In this study, students’ “prior belief” were taken into account in assessing the effect of pre-defined hypotheses. All the ready-made hypotheses were presented within the simulation environment. A simulated circle-shaped tool named confidence meter was used beside each presented hypothesis. It can be set by students to record their beliefs concerning to what extent the given hypothesis would be accepted. It is interesting to figure out if students’ intuitive beliefs on the given hypotheses recorded by confidence meter could have the same effect as students’ prior beliefs that are based on their prior knowledge.
The present study aimed to answer whether TBV and TBF hypotheses have different impact on students’ inquiry process and knowledge acquisition. If the answer is yes, which kind of pre-defined hypotheses are more effective in facilitating students’ inquiry process and knowledge acquisition?
TBF hypotheses were expected to have better effects on students’ inquiry learning.
Presented with pre-defined hypotheses, students were supposed to be imparted with initial ideas about predictions of specific situations on electric circuits. All their subsequent inquiry processes were based on the information provided by the pre-defined hypotheses. When presenting students with TBF hypotheses, the information students gained through their inquiry process was assumed to conflict with the content mentioned in the given hypotheses. Inspired by the positive effect of cognitive conflict on promoting students learning (Limón, 2001), the contradictory information brought out by TBF hypotheses was expected to result in better knowledge acquisition and inquiry process than TBV hypotheses.
7
Consistent with Klaczynski et al. (1997), if the inquiry results conflicted with students’ intuitive beliefs on the pre-defined hypotheses, namely belief-threatening situations were established, the situations were expected to have better effects on students’ inquiry process.
3.
Method
3.1 Participants
In total, 37 Dutch students (18 female – 19 male) from two bilingual classes of a pre-university school participated in this study. They were second-year students with a mean
age of 12.92 years (SD=.36) whose parents gave consent for participation. To minimize the
difference between two experimental groups, all the students from two classes were firstly grouped by gender. Then the female students and male students were randomly assigned to either condition such that each condition contained relatively the same number of female and male students. In this way, 37 students from two classes were rearranged into two groups, of which 19 students (9 female, 10 male) were allocated to the TBV group, while 18 students (9 female, 9 male) were allocated to the TBF group. Two links related to the TBV and the TBF inquiry learning environments were uploaded to the school’s network platform. The link of the TBV inquiry learning environment was set to be only visible to the students from the TBV group, while the link of the TBF inquiry learning environment was only visible to those from TBF group. All the grouping work was implemented in advance. Students were supposed to know nothing about the existence of the two different versions of learning environments.
3.2 Design
The study used a quasi-experimental pretest and posttest design with knowledge
acquisition and inquiry process as dependent variables and form of pre-defined hypotheses
(TBV or TBF) and prior belief as independent variables. The different impact of TBV and TBF hypotheses on students’ knowledge acquisition was examined by analysis of covariance (ANCOVA) as well as Mann-Whitney test, while the impact on inquiry process was tested
with t-test. In addition, a Mann-Whitney test was used to compare the scores of inquiry
process based on students’ different intuitive beliefs on each pre-defined hypothesis.
3.3 Instrumentation
3.3.1 To be verified and to be falsified hypothesis
A TBV hypothesis refers to the hypothesis that should be verified in the subsequent inquiry process, while a TBF hypothesis refers to the hypothesis that will be falsified by the inquiry evidence. In particular, to make TBV and TBF hypotheses more comparable for two experimental groups, these two kinds of predefined hypothesis were stated in a format that only differs in the last several words. For example, if a TBV hypothesis is stated as: If two identical bulbs are connected in a series circuit, then the electric current flowing through these
two bulbs is the same, the corresponding TBF hypothesis will be stated as: If two identical
bulbs are connected in a series circuit, then the electric current flowing through these two
bulbs is different. In addition, when forming the paired TBV and TBF hypotheses, antonyms
the probable negative influence of “not” on students. For instance, “same” corresponds with “different”, “stay the same” corresponds with “change”, and “decrease” corresponds to “increase”.
3.3.2 Go-Lab inquiry learning spaces
Students worked with a simulation-based inquiry learning environment about series
and parallel circuits. The inquiry learning environments were designed in the Go-Lab, a learning portal aiming at promoting and supporting the use and design of virtual and remote inquiry learning environment. With Go-Lab, teachers and/or instructional designers can create Inquiry Learning Spaces (ILSs) in which a simulation or online lab is central, students follow an inquiry cycle with different phases, and the ILS can be completed with multimedia material and learning scaffolds or apps, such as a hypothesis scratchpad (de Jong, Sotiriou, & Gillet, 2014). For this study, the ILSs were designed based on a lab on electric circuits. In the ILSs, students had to investigate the characteristics of electric current flowing through series and parallel circuits, and find out the difference of electric current flowing through these two kinds of electric circuits. Since this topic was beyond students’ current lesson scope, they were assumed to have low prior knowledge about this domain.
Orientation, conceptualization, investigation, conclusion and discussion are the five
inquiry learning phases suggested by Go-Lab. Based on this, two ILSs that only differed in the form of pre-defined hypotheses were designed. To meet the requirements of this study, the ILS for each group was adjusted into 9 phases, including an introduction phase, an orientation phase, a hypotheses phase, six investigation phases and a reflection phase (see Figure 1). The main content included in each phase will be clarified in subsequent parts.
9
Before the start of the inquiry, an “Introduction” phase was presented to inform
students with the learning topic and learning goals. In the orientation phase, an introduction of
basic concepts and skills to be used in subsequent inquiry phases was illustrated with text, pictures and videos. Besides, concepts and corresponding questions were presented
alternatively to motivate studentsto read the presented information carefully.
“Conceptualization” was simplified into “Hypotheses” to make the title more understandable to students. Although students did not need to generate their own hypotheses, a worked-example about the concept and format of testable hypotheses was still designed in this phase to familiarize students with the definition and formation of a testable hypothesis, aiming to facilitate students’ understanding of the given hypotheses. In addition, to prepare students with enough operational skills for subsequent investigation phases, a video on how to draw electric circuits with the Electric Circuit Lab (a simulated electric circuit lab used for circuit design) was provided in this phase.
The investigation phase presented to students in the present study differed from previous investigation phase in two aspects. First, the investigation phase in this case was rearranged as a combination of hypotheses, experiment design, data record and conclusion. The main reason for the rearrangement was to reduce cognitive load. Cognitive load refers to the total amount of mental activity imposed on working memory at a certain moment in time (Sweller, Van Merrienboer, & Paas, 1998). Working memory denotes a cognitive system that is used for temporally holding and processing information (Sweller et al., 1998). In total, each student has to inquiry on 6 pre-defined hypotheses. Splitting all the inquiry processes for testing each hypothesis apart would largely increase the total number of inquiry phases. This would increase cognitive load if students need to consult among phases for information. The cognitive load theory is subject to the assumption that the capacity for mentally holding and manipulating information in the working memory is limited (Mayer & Moreno, 2003; Sweller et al., 1998). Considering this, combining the main inquiry processes in one phase could reduce the visual search, thus decreasing the burden on students’ working memory. Moreover, integrating all the inquiry process for testing one hypothesis together could benefit students with more coherent and complete inquiry experiences.
Second, the Electric Circuit Lab used in this study was a simplified version of the
original Electric Circuit Lab. All the pre-defined hypotheses presented to students in this study focused on electric current of series or parallel circuits. To avoid unnecessary misunderstanding and misuse of the circuit elements provided in the simulated lab, all the irrelevant circuit elements such as switches, resistor, batteries, and voltmeter were removed (see Figure 2). Besides, two different bulbs and an extra ammeter were added to meet the requirements of this study.
Reflection phase was the last phase of the learning environment. In this study, students were
required to complete the inquiry process independently to avoid the influence of
Figure 2.Screenshot of the original and the simplified version of Electric Circuit Lab
3.3.3 Tests
Three kinds of tests were administered: a domain knowledge test, a reflection test and a knowledge quiz. The domain knowledge test was administered to examine students’ knowledge acquisition concerning characteristics of series and parallel circuits relevant to the ILS. This test was given to the students as a pre-test and as a post-test. The reflection test was used to gain insights into students’ operational experience and inquiry process from students’ perspective. The knowledge quiz was developed to motivate students to really read the important information useful for their inquiry process and was not used for evaluation purpose.
Domain knowledge test
The domain knowledge test was a paper and pencil test focusing on students’ acquisition of conceptual understanding. The test consisted of 10 multiple-choice questions, 1 drawing question and 1 open question. Six out of the 10 multiple-choice questions were asked in accordance to the 6 hypotheses presented in the ILS, the other 3 asked about basic knowledge on electric circuit and the last question was an additional question about mathematical relation between the electric current of series and parallel circuit. The drawing question and open question concerned the drawing of electric circuit and transfer knowledge about the setup of lamps in a house respectively.
To assess students’ understanding of the pre-defined hypotheses, the so-called “what-if” question format from Swaak and de Jong (2001) was used to present the 6 multiple-choice questions relevant to those presented hypotheses. Condition, action and prediction are the three main parts of a what-if question (Swaak & de Jong, 2001). In this case, condition was illustrated by both texts and pictures to clearly explain the meaning of the questions to students. Besides, as shown in Figure 3, in case student could not understand a simplified diagram immediately, two pictures of the same electric circuit were shown for the same question (one is a physical simulation picture, and one is a simplified diagram of electrical components) to illustrate the electric circuit to be discussed. The action and predicting options were presented in text. Students were asked to select the option that could reflect their prediction on the given condition most. This knowledge test was implemented right before
11
and after students’ inquiry learning (pretest and posttest). The items of these two versions of test were the same from a content point of view, but with different orders of questions and answer options. The content of this test has been checked by students’ teacher, who confirmed that knowledge about electric circuit included in this knowledge test had not yet been taught, and the presentation of the questions was understandable to students.
Figure 3. Sample question presented in the knowledge test
The reliability of the 10 multiple-choice questions was examined with Cronbach’s
alpha. Unfortunately, the results were unacceptable according to common presumption of the adequate level (.30 for pretest and .28 for posttest). The Cronbach’s alpha of the pretest could reach .61 after removal of three items. However, the removed items were three out of six items that closely related to pre-defined hypotheses. The increasing Cronbach’s alpha based on the removal of items would sacrifice meaningful construct covered by the knowledge test.
Mainly two reasons could account for this low reliability. First, multidimensional
constructs were included in the test, which might influence the reliability result. The reliability coefficient was calculated with 10 items, of which 3 items were about basic knowledge on electric circuit, 6 items were closely relevant to the six pre-defined hypotheses, and the last item was an additional question asking about the mathematical relation of electric current of series and parallel circuits. Even the six hypotheses-related questions were not asking about the same point of series or parallel circuit. Although alpha is not a measure of unidimensionality (Schmitt, 1996), it is most appropriately used when all items measure the same construct. Second, the limited number of participants in each experimental group was another suspected factor that could influence Cronbach’s alpha. In total, there were 37 students participated in this research, which were further divided into two experimental groups. Such a small sample might also influence the reliability of the knowledge test.
This study was a preliminary study on the effect of TBV and TBF hypotheses.
Although the problematic Cronbach’s alpha revealed the low reliability of the knowledge test and impeded the generalization of the evaluation results, the results of the knowledge test can still act as prior experience and reference for future relevant research. Hence, all the multiple-choice terms included in the knowledge test were still analyzed in subsequent section.
answer to these two questions in pretest and posttest were both coded by two independent raters. The inter-rater reliability in coding the drawing question for pretest reached .88, and for posttest reached .99. The inter-rater reliability in coding the open question for pretest reached .99, and for posttest reached.91 (Interclass Correlations). The coding scores of one rater were used for further analysis in subsequent result section.
Reflection Test
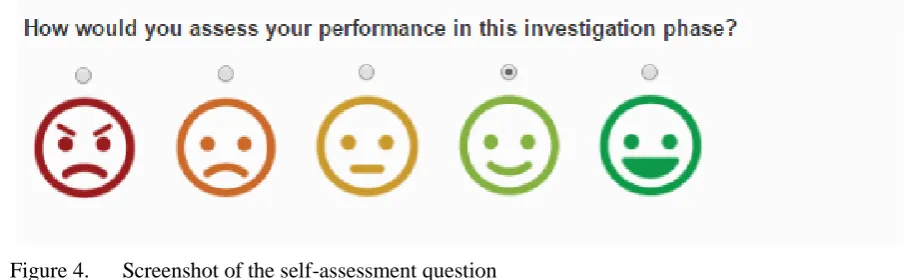
[image:13.595.66.521.377.517.2]The reflection test was included in the ILS and was repeatedly shown at the end of all the six investigation phases. The test mainly included three parts: four 5-point Likert-scale questions (ranging from 1 = totally disagree to 5 = totally agree), concerning about the four inquiry processes (e.g., I can fully understand the meaning of the given hypothesis.); one 5-point self-assessment question from angry to smile (see Figure 4); and two open questions regarding the most difficult parts of current investigation phase and whether the given hypothesis is helpful or not (e.g., In your opinion, which part(s) is (are) the most difficult part(s) of this investigation phase? And why? Explain your reasons here.). Three additional 5-point Likert-scale questions were only included in the first investigation phase to learn more about students’ operational experience from their perspective (e.g., I know how to use the "confidence meter".).
Figure 4. Screenshot of the self-assessment question
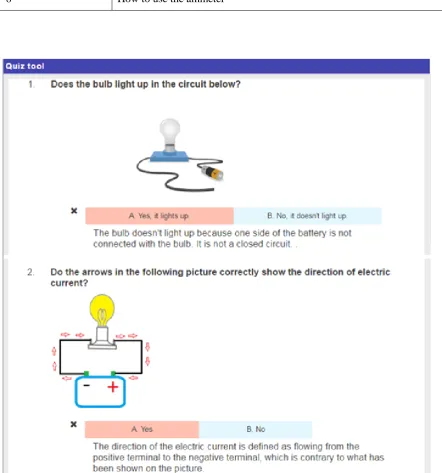
Knowledge quiz
13
Table 1
Overview and main contents of the knowledge quiz
Number of question Main content of questions
1-4 Concept of simple electric circuit
Direction of electric current
Measuring unit of electric current and voltage
5-7 Basic concepts of series and parallel circuit
[image:14.595.65.508.250.724.2]8 How to use the ammeter
3.4 Measuring inquiry process
To examine whether the two forms of pre-defined hypotheses (TBV and TBF) have
different effect on students’ inquiry process, a coding scheme (see Appendix C) was developed that focused on students’ electric circuits design, data collection and conclusions in each investigation phase. A detailed description of the coding and scoring procedure is as follows:
With regards to experiment design, namely circuit design in this case, six expert
electric circuits were drawn based on the six pre-defined hypotheses and were used to define
the basic elements that should be present in students’ electric circuits. Based on the expert electric circuits, a list of key elements that should be considered when drawing an eligible electric circuit was designed, including power supply, type of circuit (series or parallel circuit), number of bulb and type of bulb. Detailed explanations about each coding element were also included in the coding scheme. Electric circuits designed by the students were checked against this coding elements list, and one point was allocated for each element except for the type of circuit. Students were awarded with two points if he/she drew the right type of circuit mentioned in the pre-defined hypothesis. To acquaint students with the characteristics and differences of the electric current flowing through series and parallel circuits, all the pre-defined hypotheses focused on the electric current flowing through either series or parallel circuit. Compared with other elements, understanding and drawing the right type of electric circuit counted more in deciding whether to accept or reject the given hypothesis as well as in finding out the difference between series and parallel circuit. Hence, one more points was assigned to this element.
As for the data collection, the use and the way to use the ammeter in measuring the
electric current were regarded as students’ two main behaviors for data collection, and one
point was allocated for each behavior. To be more specific, as long as a student tried to use the ammeter to measure the electric current, he/she was awarded for one point. If a student knew to measure the electric current flowing through bulbs rather than the electric current flowing through power supply, another one point would be given to him/her. The information source from which evidence of use or correct usage of ammeter could be found was clearly presented in the coding scheme. For instance, the evidence of a student’s usage of ammeter can be found if an ammeter was included in the designed circuit or if the student recorded any value of electric current.
Regarding the coding of the conclusion, students’ expression about whether to accept
or reject the presented hypotheses and whether their conclusions were data-based were the two
15
the electric current of two bulbs in the circuit, their records would be considered as promising behavior to compare the electric current of bulbs.
Students’ inquiry processes saved in the ILSs were all coded by two independent raters.
The inter-rater reliability coefficient in coding inquiry process in terms of electric circuit design reached .91 (Interclass Correlations). Inter-rater reliability in terms of data collection reached .92 (Interclass Correlations) and the inter-rater reliability coefficient regarding conclusion reached .89 (Interclass Correlations). The results presented in subsequent result section were based on the coding of one coder.
3.5 Procedure
Prior to the implementation of experiment, an appointment was made to visit the target
school – Canisius Tubbergen to obtain the permission and support from the school’s side. The domain knowledge test and inquiry learning environment were shown to students’ teacher for checking. Meanwhile, emails were sent to students’ parents to inform them on the main contents of this study and to gain consent from them.
Limited by the time arrangement of the target school, the experiment was conducted
over 3 sessions for each class of students from 28th to 30th September in 2016. All participants
followed the same sequence of events, which lasted for two and a half hours in total (each session 50 minutes).
Students started the first session with a brief introduction to the study, after which they were allowed 20 minutes to complete the pretest of domain knowledge. Students were reminded to answer the questions individually and they were informed that the test would only be used for research purpose. Following the test, students were introduced with the basic operational skills of ILS and what they were asked to do in 10 minutes, of which the concept of confidence meter and the way of how to adjust confidence meter were emphasized. After the introduction, students were guided to start one specific ILS (either TBV or TBF) and required to finish the introduction phase and orientation phase of their ILS in this first session.
At the beginning of the second session, students were reminded with three probable
confusing points, including that hypotheses were presented to them, they did not need to
generate their own hypotheses, there were two different bulbs available in the virtual electric circuit lab, and ammeter could be repeatedly used to measure electric current of different bulb. After that, students were required to start from where they stopped last time and continue to finish all the tasks in hypothesis phases and investigation phase 1- 4.
During the last session, students were told to continue working on their ILS and to
finish investigation phase 5-6 and reflection phases in the first 30 minutes. The last 20 minutes
were left to complete the posttest of domain knowledge.
4.
Results
In this section, the results of the knowledge tests will be firstly reported. This is
4.1 Difference between conditions on knowledge test
Due to different forms and different coding ways of questions for the knowledge test, the total scores for 10 multiple-choice questions and the total score for drawing and open questions were evaluated separetely in subsequent section. Moreover, to take a closer look at the 6 multiple-choice questions (the 6 questions were included in the 10 multiple-choice questions) that in accordance with the 6 pre-defined hypotheses, an additional evaluation was implemented to the scores of these 6 questions.
As an overview of the results on knowledge test, Table 2 illustrated the descriptive
statistics of participants’ scores gained from three kinds of questions between conditions. Table
[image:17.595.67.506.313.507.2]3 presented the descriptive statistics of the scores for the 6 hypothesis-related questions.
Table 2
Mean score (SD) for different kinds of questions in pretest and posttest between conditions
Type of question condition Pretest Posttest Maximum
score
N M(SD) N M(SD)
Multiple-choice
question
TBV 19 5.84(1.71) 19 6.21(.98) 10
TBF 17 6.12(1.54) 18 5.44(1.54) 10
Drawing question TBV 19 .37(1.01) 19 3(1.56) 5
TBF 17 .24(.66) 18 3.28(1.60) 5
Open question TBV 19 .32(.58) 19 1.79(.54) 4
TBF 17 .76(.90) 18 1.61(.70) 4
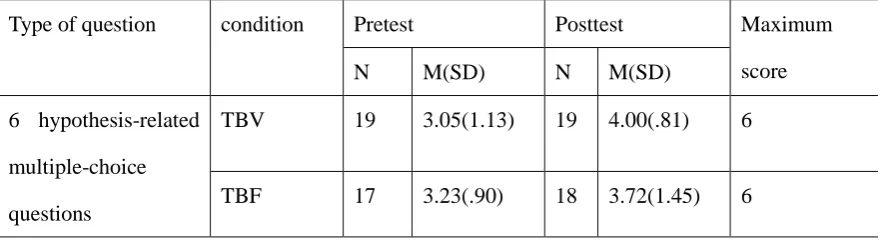
Table 3
Mean score (SD) for the 6 hypothesis-related questions in pretest and posttest between conditions
Type of question condition Pretest Posttest Maximum
score
N M(SD) N M(SD)
6 hypothesis-related
multiple-choice
questions
TBV 19 3.05(1.13) 19 4.00(.81) 6
TBF 17 3.23(.90) 18 3.72(1.45) 6
The normality of continuous variables was checked. In terms of 10 multiple-choice
questions in pretest and posttest results, the Kolmogorov-Smirnov test was significant: D(36)
[image:17.595.65.507.575.696.2]17
inspection of histograms (see Appendix D and Appendix E) showed that the distributions of both variables were bell-shaped and leptokurtic with skewness and kurtosis values both within the 1 threshold (-.26, -.49 and -.34, -.27 respectively), indicating that the normality was assumed. When considering the 6 hypothesis-related separately, the Kolmogorov-Smirnov test was also significant for both pretest and posttest results (D(36) = .27, p < .001, and D(36)
= .27, p < .001 respectively), showing non-normality. Yet, the skewness and kurtosis results
were within the 1 threshold for both pretest and posttest (-.47, -.82 and -.83, .47 respectively), showing the scores of these 6 questions were normally distributed. Hence, parametric tests were used for comparison on the total scores of all multiple-choice questions as well as the total scores of the 6 hypothesis-related questions in subsequent parts.
Regarding the total score of drawing question and open question in the pre-/posttest,
the results of Kolmogorov-Smirnov test was significant D(36) = .35, p < .001, and D(36) = .27,
p < .001 respectively, indicating non-normality. The skewness and kurtosis result for pretest
was beyond the 1 threshold (1.47, 1.12) while that for posttest was within the 1 threshold (-.81, -.38). Converting these scores to z-scores (Ignoring the minus sign, when the z-score is greater than 1.96 then it is significant) by dividing by their respective standard error, the results showed the skewness of both pretest and posttest (3.73 and 2.06 respectively) was significant while the kurtosis were both non-significant (1.46 and .50 respectively). Considering all these, the scores on drawing and open questions in pretest and posttest were both assumed to be not normally distributed, and non-parametric tests would be used for further analysis.
To determine whether TBV and TBF hypotheses have different impacts on students’ knowledge acquisition, an analysis of covariance (ANCOVA) was firstly performed to
analyze the variance of students’ posttest results on all multiple-choice questions while
controlling the pretest results as a covariate. In order to conduct an ANCOVA, the assumption of independence of the covariate (pretest results) from the experimental effect ( TBV or TBF)
and the homogeneity of regression slopes should be met. The result (F(1, 34) = .26, p = .616)
showed that the average scores of pretest were roughly the same for students in two conditions, indicating the first assumption on independence of pretest results was met. The second assumption was examined by looking at the significance value of the covariate by outcome interaction (condition * pretest), if this effect is non-significant, then the assumption of homogeneity of regression slopes was met (Field, 2013). The tests of between-subjects
effects (F(1, 32) = 1.02, p = .320) demonstrated that this second assumption was also met.
Based on this, ANCOVA was conducted and there was no significant effect of TBV and TBF
hypotheses on students’ posttest results after controlling for pretest results, F(1, 33) = 3.39, p
= .075.
The ANCOVA test was also implemented for the scores of the 6 hypothesis-related
questions. The assumption of independence of the pretest from the experimental effect ( F(1,
34) = .28, p = .598) and the homogeneity of regression slopes were both met ( F(1, 32) = .078,
p = .782). The results of ANCOVA also indicated non-significant effect (F(1, 33) = .60, p
= .445) of TBV and TBF hypotheses on students’ knowledge acquisition on hypothesis-related questions.
conditions. The results (U = 155.50, z = -.19, p = .851) showed a non-significant difference between conditions.
4.2 Difference on inquiry process based on reflection test
In this section, the inquiry process was evaluated from students’ perspective, which was based on the data recorded by the reflection test. The descriptive statistics of students’ inquiry experience recorded by three additional Likert-scale questions in orientation phase 1 will be reported first. This will be followed by the results of two open questions, concerning the most difficult parts of the inquiry process and the helpfulness of the pre-defined hypothesis indicated by the students in each investigation phase. At last, the comparison of students’ answers to the four Likert-scale questions related to the four main inquiry process and the self-assessment question between conditions will be presented.
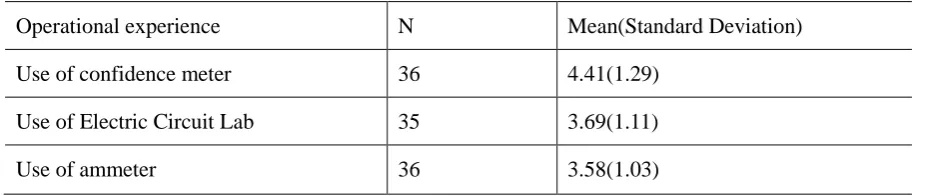
Table 4 illustrates the descriptive statistics of students’ answers on their operational experience in the ILS, which indicated that most students knew how to use the three simulated
[image:19.595.63.526.359.457.2]elements (confidence meter, Electric Circuit Lab and ammeter) relevant to this study.
Table 4
Mean scores (SD) for the Likert-scale question on operational experience
Operational experience N Mean(Standard Deviation)
Use of confidence meter 36 4.41(1.29)
Use of Electric Circuit Lab 35 3.69(1.11)
Use of ammeter 36 3.58(1.03)
Note. Maximum mean score per question was 5 points.
19
Table 5
Descriptive statistics of the most difficult parts of the inquiry process indicated by students in each
investigation phase (students could choose more than one option)
Inquiry
process
N1 Investigation
phase 1
N2 Investigation
phase 2
N3 Investigation
phase 3
N4 Investigation
phase 4
N5 Investigation
phase 5
F P F P F P F P F P
Hypothesis
understanding
35 14 40% 30 9 30% 23 6 26.09% 23 5 21.74% 27 3 11.11%
Circuit design 11 31.43% 7 23.33% 6 26.09% 5 21.74% 4 14.81%
Results
record
17 48.57% 7 23.33% 3 13.04% 6 26.09% 7 25.93%
Data
selection
21 60% 13 43.33% 9 39.13% 10 43.49% 11 40.74%
Drawing
conclusion
9 25.71% 10 33.33 8 34.78% 8 34.78% 10 37.04%
Note. Ni refers to the number of students who answered this question in investigation phase i.
F refers to the frequency of students who regarded the process was difficult in each phase.
P refers to the percentage of students who regarded the process was difficult in each phase (P=F/Ni).
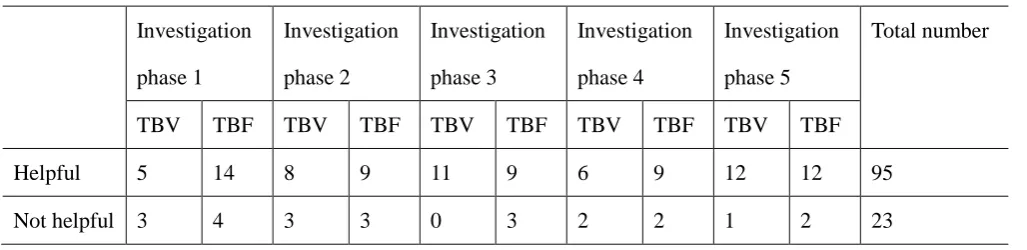
Table 6
Frequency of whether the given hypothesis in each investigation phase was helpful
Investigation phase 1 Investigation phase 2 Investigation phase 3 Investigation phase 4 Investigation phase 5 Total number
TBV TBF TBV TBF TBV TBF TBV TBF TBV TBF
Helpful 5 14 8 9 11 9 6 9 12 12 95
[image:20.595.27.541.598.723.2]The four Likert-scale questions on the four main inquiry process and the self-assessment question were analized to gain insights into students’ own opinions on their
inquiry process for each pre-defined hypothesis. These five questions were repeatedly shown
[image:21.595.67.511.235.499.2]at the end of each investigation phase. The mean score of each question in six investigation phases was used as the basis of comparison. Table 7 presented an overview of the mean score and standard deviation of these questions for both TBV and TBF condition.
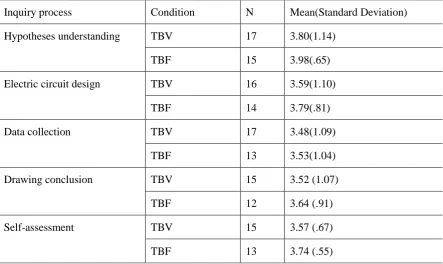
Table 7
Mean scores (SD) for each inquiry process and self-assessment of 6 pre-defined hypotheses
Inquiry process Condition N Mean(Standard Deviation)
Hypotheses understanding TBV 17 3.80(1.14)
TBF 15 3.98(.65)
Electric circuit design TBV 16 3.59(1.10)
TBF 14 3.79(.81)
Data collection TBV 17 3.48(1.09)
TBF 13 3.53(1.04)
Drawing conclusion TBV 15 3.52 (1.07)
TBF 12 3.64 (.91)
Self-assessment TBV 15 3.57 (.67)
TBF 13 3.74 (.55)
Note. Maximum mean score per question was 5 points.
The above descriptive statistics indicated that most students held positive attitude towards their performance on all the inquiry process included in the ILS, and the performance
of TBF group was relatively better than that of TBV group from students’ perspective.
However, the latter conclusion was not confirmed by the results of further statistic test. The normality of all the process variables was checked by the Kolmogorov-Smirnov test. The test results indicated that the electric circuit design, the drawing conclusion and the
self-assessment variable were confirmed as normally distributed (D(26) = .11, p = .200; D(26)
= .12, p = .200; D(26) = .12, p = .200 respectively), while the hypothesis understanding
variable and the data collection variable were not normally distributed (D(26) = .21, p = .006
and D(26) = .19, p = .01 respectively). Therefore, the mean score of the hypothesis
understanding and the data collection process were compared by the Mann-Whitney test, and
that of all the other process varaibles was tested by the independent sample t-test.
To conduct t-test, assumption of equal variances across conditions should be
21
conclusion and self-assessment (F (1, 28) = .51, p = .481; F (1, 25) = .51, p = .480 and F (1,
26) = .43, p = .516 respectively), indicating this assumption was met by all these three
variables. The results of independent sample t-tests revealled that no significant difference
was found on electric circuit design, conclusion as well as students’ self-assessment between conditions, (t(28) = -.54, p = .595; t(25) = -.30, p = .766; (t(26) = -.75, p = .458) respectively. As for the hypothesis understanding variable and the data collection variable, the results of the Mann-Whitney test (U = 123.50, z = -.15, p = .882 and U = 101.00, z = -.40, p = .711 respectively) also demonstrated a non-significant difference between conditions. All these results indicated that TBV and TBF hypotheses did not significantly influence the inquiry process of students from students’ perspective.
4.3 Difference on inquiry process based on coding scores
In this section, students’ inquiry learning process was evaluated from the researcher’s perspective. The total scores students gained from the electric circuit they designed, the
measurement they used and the conclusion they drew for all the six pre-defined hypotheses
[image:22.595.66.533.398.568.2]were coded by raters for this evaluation. An overview of the descriptive statistics is shown in Table 8 to offer a general picture about the coding results.
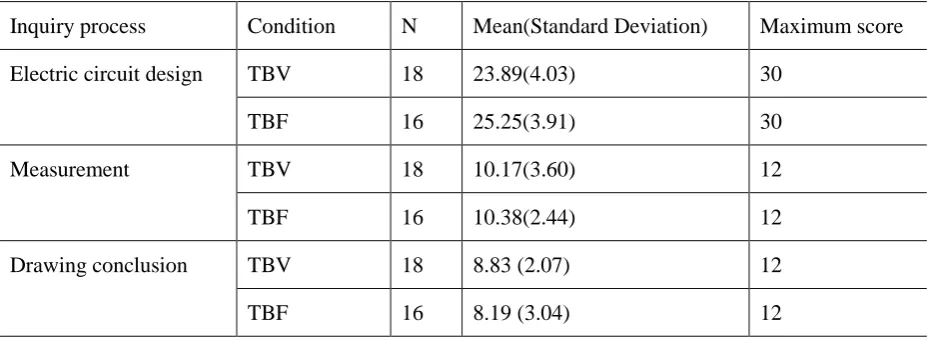
Table 8
Mean (SD) for total scores of each inquiry process of the 6 pre-defined hypotheses
Inquiry process Condition N Mean(Standard Deviation) Maximum score
Electric circuit design TBV 18 23.89(4.03) 30
TBF 16 25.25(3.91) 30
Measurement TBV 18 10.17(3.60) 12
TBF 16 10.38(2.44) 12
Drawing conclusion TBV 18 8.83 (2.07) 12
TBF 16 8.19 (3.04) 12
Independent sample t-tests were also implemented for each inquiry process to check
the significance of the difference between conditions. Yet, the results (t(32) = -1.00, p = .32),
(t(32) = -.20, p= .847), (t(34) = .73, p = .469) respectively) did not discover any significant difference for any inquiry process, expressing that the conditions did not affect the inquiry process that students implemented.
4.4 Influence of students’ belief
Students’ intuitive beliefs on to what extent they believe the given hypothesis would
hypotheses (TBV and TBF) and beliefs in the pre-defined hypotheses (believe and not believe), into consideration at one time, students can be further divided into four groups: students who were presented with TBV hypothesis and believe in that the hypothesis would
be accepted (TBV—B), students who were presented with TBV hypothesis but did not believe
in the hypothesis (TBV—NB), students who were presented with TBF hypothesis and believe
in the hypothesis (TBF—B) and those who were presented with TBF hypothesis and did not
believe in the hypothesis (TBF—NB).
[image:23.595.66.507.438.751.2]Since students’ belief towards the 6 pre-defined hypotheses was recorded relatively independently, and their beliefs on the 6 given hypotheses could vary from phase to phase, their inquiry process for each pre-defined hypothesis would be assessed separately in subsequent parts. The scores a student gained from electric circuit design, data collection and drawing conclusion in each investigation phase were added as a total score for the whole inquiry process, which was regarded as the dependent variable in analyzing the influence of students’ belief. Table 9 summarizes the descriptive statistics for scores coded from inquiry process across groups.The results of knowledge test were not used as the dependent variable. This is because that the knowledge test measured the knowledge students acquired from the ILS as a whole, while the confidence meter measured student’s beliefs on a per-hypothesis basis (and was used 6 times during the ILS). It is thus very difficult and not logical to correspond students’ scores on the knowledge test to the results of each confidence meter.
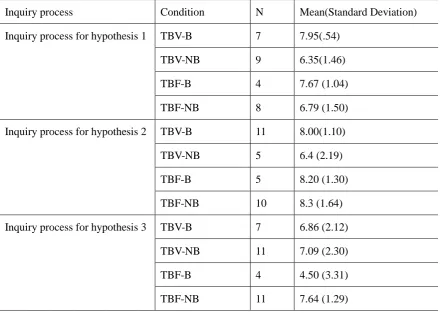
Table 9
Mean score (SD) for inquiry process of each pre-defined hypotheses by conditions
Inquiry process Condition N Mean(Standard Deviation)
Inquiry process for hypothesis 1 TBV-B 7 7.95(.54)
TBV-NB 9 6.35(1.46)
TBF-B 4 7.67 (1.04)
TBF-NB 8 6.79 (1.50)
Inquiry process for hypothesis 2 TBV-B 11 8.00(1.10)
TBV-NB 5 6.4 (2.19)
TBF-B 5 8.20 (1.30)
TBF-NB 10 8.3 (1.64)
Inquiry process for hypothesis 3 TBV-B 7 6.86 (2.12)
TBV-NB 11 7.09 (2.30)
TBF-B 4 4.50 (3.31)
23
Inquiry process for hypothesis 4 TBV-B 7 7.86 (1.07)
TBV-NB 11 6.91 (2.12)
TBF-B 10 5.80 (2.57)
TBF-NB 7 6.71 (2.06)
Inquiry process for hypothesis 5 TBV-B 5 6.40 (2.30)
TBV-NB 14 6.93 (1.64)
TBF-B 6 6.33 (1.37)
TBF-NB 12 7.33 (1.56)
Inquiry process for hypothesis 6 TBV-B 10 8.90 ( .32)
TBV-NB 8 5.63 (2.72)
TBF-B 7 8.28 (1.11)
TBF-NB 10 7.60 (1.65)
Note. The maximum score for inquiry process of each hypothesis was 9 points.
In the following section, the effect of students’ intuitive beliefs on each given hypothesis was tested by the Mann-Whitney test. The Shapiro-Wilk test results indicated that
scores of inquiry process in each investigation phase was not distributed normally: D(34)=.90,
p = .004; D(34) = .79, p < .001; D(34) = .81, p < .001; D(34) = .88, p = .001; D(34)= .91, p
= .010; D(34) = .72, p = .004 respectively. The skewness and kurtosis values for the inquiry
process scores in investigation phase 1,2,3,6 were all beyond 1 threshold (-1.18, 1.30; -1.34, 1.48; -1.48, 2.10; -1.60, 1.87 respectively), confirming non-normality of the inquiry process scores. Therefore, a Mann-Whitney test was used to compare the scores of inquiry process across conditions. To answer the second research question about the impact of students’ intuitive beliefs on pre-defined hypotheses on inquiry process, four sub-questions were discussed first.
The first question we would like to answer was: if a student was presented with TBV
hypotheses, whether students’ belief in the given hypothesis has significant impact on their
inquiry process. By comparing inquiry process scores of students from TBV-B and TBV-NB group for each pre-defined hypothesis with Mann-Whitney test, the inquiry process scores for TBV-B group was significantly different from that of TBV-NB group in testing hypothesis 1
and 6 (U = 6.50 , z = -2.67, p = .005 and U = 6.00 , z = -3.32, p = .001 respectively) while
non-significant difference was found for inquiry process in testing hypothesis 2, 3, 4 and 5 (U
= 14.00, z = -1.60, p = .15; U = 34.50 , z = -.371, p = .724; U = 28.00, z = -.99, p = .375 and U
= 31.50 , z = -.33, p = .754 respectively). These findings revealled that, if students were given
The second question to be answered was: if a student was provided with TBF
hypotheses, whether students’ belief in the given hypothesis has significant impact on their
inquiry process. To answer this question, the Mann-Whitney test was performed with students from TBF-B and TBF-NB group. The results turned out that students’ belief in the TBF hypothesis did not have significant influence on their inquiry process for all the 6 investigation phases: U = 9.50 , z = -1.11, p = .283; U = 21.00 , z = -.63, p = .679; U = 9.00 , z
= -1.74, p = .104; U = 29.50 , z = -.54, p = .601; U = 21.00 , z = -1.43, p = .180 and U = 26.50 ,
z = -.88, p = .417 respectively.
The third question was: when keep students’ belief as constant variable, whether the form of this hypothesis (TBV or TBF) has significant impact on their inquiry process. When comparing the inquiry process scores between TBV-B and TBF-B groups for each pre-defined hypothesis, no significant difference between conditions were found (U = 12.50 , z = -.29, p
= .788; U = 24.00 , z = -.43, p = .743; U = 8.00 , z = -1.15, p = .315; U = 15.50 , z = -1.94, p
= .055; U = 14.50 , z = -.09, p = .931 and U = 23.00 , z = -1.58, p = .270 respectively). Similarly, the TBV-NB and TBF-NB group were also not significantly differ from each other
on their inquiry process (U = 31.50 , z = -.44, p = .673; U = 10.00 , z = -2.08, p =.075; U =
56.00 , z = -.31, p = .797; U = 35.50 , z = -.28, p = .791; U = 73.00 , z = -.58, p = .595 and U =
21.00 , z = -1.72, p = .101 respectively).
5.
Discussion
Pre-defined hypotheses were regarded as effective support in facilitating students’
inquiry learning (Gijlers & de Jong, 2009; Njoo & de Jong, 1993a). The main aim of present study was to compare the effectiveness of two different forms of pre-defined hypotheses within simulation-based inquiry learning: to be verified (TBV) and to be falsified (TBF) hypotheses with unknown outcomes. It was expected that students who received TBF hypotheses would acquire more domain knowledge and performed better in inquiry process (Hypothesis 1). Furthermore, since the pre-defined hypotheses presented to students were not generated by students themselves, their beliefs on to what extent the given hypotheses would be accepted were taken into consideration in the evaluation to see if students’ belief can influence their inquiry process. It was predicted that if the inquiry results conflicted with students’ intuitive beliefs on the pre-defined hypotheses, namely belief-threatening situations were established, the situations were expected to have better effects on students’ inquiry process (Hypothesis 2).
Contrary to our expectations, hypothesis 1 was not supported by the results. Concerning the domain knowledge test, no significant difference was found on domain knowledge acquired by students who were presented with TBF hypotheses and TBV hypotheses. Besides, students’ inquiry process was assessed from both students’ and
researcher’s perspectives, from which the results also turned out to be contradictory to our
25
students’ inquiry process, no significant difference was found on the scores students gained on electric circuit design, data collection and drawing a conclusion respectively.
These findings revealed that TBV and TBF hypotheses do not have a differential effect on students’ knowledge acquisition and inquiry process. A possible explanation for these results might be that presenting students with pre-defined hypotheses cannot compare to the prior knowledge of students’ themselves. Cognitive conflict was found to be effective in facilitating conceptual change when students have a certain amount of prior knowledge on a domain (Limón, 2001). Presenting students with TBF hypotheses aimed at confronting students with contradictory information (the information students gained through their inquiry process is conflict with the prediction mentioned in the pre-defined hypothesis), thus helping students identifying the misconceptions that must be broken down before building up new insights (Van Joolingen et al., 2007). However, presenting students with pre-defined hypotheses can bridge the gap of students’ deficiency in generating testable hypotheses (Gijlers & de Jong, 2009; Njoo & de Jong, 1993a), but may not be equal in importance to the prior knowledge.
Besides, even when students are confronted with contradictory information, their reactions to contradictory information did not always work out as productive (Chan, Burtis, & Bereiter, 1997). Unadapted response which means students do not realize the conflict can also happen (Limón, 2001). Therefore, even though students received TBV or TBF hypotheses, they were likely to follow the description mentioned in the given hypotheses accordingly, and failed to consider the conflict thoroughly.
Another reason could be that students focused more on completing the learning environment rather than discovering ways to test the given hypotheses. An unwanted side effect of inquiry support is that learners try to meet the requirement presented by learning environment while failing to use the support to facilitate deeper insight into the process (Van Joolingen et al., 2007). Although students were guided to test pre-defined hypotheses step by step, the relations between the processes and the inquiry task may not be directly clear for them. There is a chance that students spent more efforts in filling in the required task for each step, failing to deal with the inquiry itself. The side findings from the knowledge quizzes involved in the orientation phases could, to some extent, embody this situation. There were 8 questions in total, except for question 8, almost all the students from both conditions chose the same answer to the same question. To be more specific, nearly all students chose option A to question 1-7, resulting in consistent right or wrong for these 7 questions. This uncommon phenomenon indicated that students may not as expected go through relevant information presented in orientation phase carefully.
Furthermore, more time may be needed for the support to take effect in facilitating
inquiry process and knowledge building. Students were asked to test 6 pre-defined hypotheses
in three separate sessions which lasted for two and a half hours in total. More time may be needed for student to grasp the operational skills of the simulation-based inquiry learning environment, to understand the tasks required in each inquiry phase and to be able to be involved in deep thinking about how to test the given hypotheses.
version of expression is more difficult for them to grasp the meaning, which might impede students’ inquiry process and in turn, influence their knowledge building process.
With regards to hypothesis 2 concerning about the impact of students’ beliefs on the pre-defined hypotheses, the results also yielded unexpected outcome. Considering the form of pre-defined hypotheses (TBV and TBF) and students’ belief in the given hypotheses (Believe (B) or Not Believe (NB)) as two influencing factors, all the students were further divided into
four groups. Comparison on total scores of students’ inquiry learning process in testing each
hypothesis were implemented between different groups of students: namely between the TBV-NB and the TBV-B group, between the TBF-NB and the TBF-B group, between the B-TBV and the B-TBF and between the NB-TBV and the NB-TBF. Yet, none of these comparison tests ended with significant difference, indicating that no matter students were given TBV or TBF hypotheses, students’ beliefs could not significantly influence their inquiry process, and students’ beliefs have the same non-significant impact on students from TBV and TBF group.
These results are contrary to what Klaczynski et al. (1997) and Greenhoot et al. (2004) held. They found that belief-threatening information can motivate students to process extensively and to engage in sophisticated reasoning. The weak results revealed that the conflicting situation students experienced when the outcome of inquiry process conflicted with students’ beliefs in the given hypothesis could not be equal to the “belief-threatening information” that could promote extensive learning. Students’ intuitive beliefs on to what extent the given hypothesis would be accepted might be overestimated as students’ internal belief they hold based on their own prior knowledge. Students’ beliefs recorded by present study are better to be regarded as students’ predictions about the correctness of given hypotheses rather than to be regarded as students’ internal belief or cognition about the given hypotheses.
Another explanation might be that the distribution of the value of the confidence meter
was not scientific enough. Students’ beliefs in the given hypotheses were grouped in to B or
NB based on a cut-point of 0.5, and those who held neutral ideas towards the given hypotheses (those whose confidence meter was 0.5) were grouped into NB group since only small percent of participants chose 0.5, which might influence the results. In fact, the neutral beliefs should be discussed separately to discover a more appropriate and complete findings.
Limitation and future research
This study explored the effect of TBV and TBF hypotheses as well as the impact of beliefs on students’ inquiry process and knowledge acquisition. However, the results failed to
support the assumed effectiveness. Several limitations of this study need to be acknowledged.
First, domain knowledge deserves to be analyzed with better designed items since the reliability among items were shown to be insufficient. Although multidimensional constructs and limited number of participants could, to some extent, account for the low reliability, the generalization of the findings is limited.
Second, the assumption that the target participants of this study had low prior knowledge on the specific domain was questionable. Considering that the characteristics of
electric current flowing through series and parallel circuit were beyond students’ lesson scope,
27
multiple—choice questions. Two reasons could account for this. First, only two alternative options were provided for 6 out of the 10 multiple-choice questions, which increasing the chance of guessing the right answers; Second, the number of question items was not big enough. More question items may be needed to gain deeper insights into students’ knowledge on the domain.
Third, a control group in which students are free to generate their own hypotheses is missing. Because of practical limitation, only two groups of students participated in present study. If a third control condition was included, not only the different effect of TBV and TBF group can be examined, but also whether TBV or TBF hypotheses are effective support for students can be tested.
Furthermore, the introduction of the learning environment was suspected to be insufficient for students to grasp what they were required to do. Although being reminded to read and use the pre-defined hypotheses given in the hypotheses scratchpad directly, still 13 pre-defined hypotheses had been changed by students. In this study, students carried out their inquiry process according to the guidance and explanation in the ILS, only short introduction about the learning environment and operational skills were presented to students face to face. Concrete example about each inquiry phase should be presented to students to familiarize students with the learning environment.
In addition, this research lacked exploration for detailed information on students’ real inquiry process. Limited by the time and source, the scores used for the analysis on students’
inquiry process were coded only based on the final version of their inquiry results shown in
ILS. But students were allowed to engage in the ILS actively and freely, hence, there were some chances that students have changed or removed some elements of their electric circuits after they finished the required inquiry task. This suspicion was confirmed by the fact that some students have recorded all the data needed to draw a conclusion while leaving the Electric Circuit Lab totally empty. Therefore, students’ real inquiry process could not be fully reflected by the coded scores used in present study. Detailed records about students’ inquiry process from log files are suggested to be added in future research for more comprehensive assessments of the whole situation.
Last but not least, this study focused on estimating the different effect of TBV and TBF hypotheses on students’ inquiry learning, failing to discuss the impact of other forms of pre-defined hypotheses, such as hypotheses stated in affirmative or negative sense, hypotheses stated in different level of difficulty. These are the questions that future research could focus on.