July 2, 2017
BACHELOR THESIS
TRANSPORT PHENOMENA IN MONOLAYER
GRAPHENE MEMBRANES
Koen F.A. Jorissen
Faculty of Science and Technology Soft Matter, Fluids and Interfaces group
Exam committee:
M. Ghosh, MSc Dr. J.A. Wood
Abstract
Graphene ion exchange membranes were characterized using permselectivity, permporometry and membrane permeability analysis. Donnan and diffusion based transport was analyzed for KCl, LiCl, K2SO4and CaCl2. Concentration-potential were found for KCl, LiCl and K2SO4. The data
Symbols and Abbreviations
Symbols
v Velocity [ms]
Ci Concentration component i [mM]
T Temperature [K]
Di Diffusion constant of i [ms2]
zi Charge number of i [-] E Electric field [Vm]
λD Debye length [m]
I Ionic strength [mM]
Ji Flux [mol
m2 ]
V Potential [V]
CR Fixed charge concentration [mM]
ζ Membrane selectivity [-] β Membrane performance [-] ui Ion mobility [m
2
v∗s]
δ Membrane thickness [m] γi Ion activity of i [mM]
Constants
R Ideal Gas Constant 8.314molKJ F Faraday Constant 96 485molC e Elementary Charge 1.602∗10−19C kB Boltzmann Constant 1.381∗10−23KJ
ε0 Vacuum permittivity 8.854∗10−12mF
Abbreviations
TMS Teorell-Meyer-Sievers PET Polyethylene-terephthalate PMMA Polymethyl-methacrylate SEM Scanning Electron Microscopy MD Molecular Dynamics
Contents
1 Introduction 1
1.1 Motivation and Background . . . 1
1.2 Topic of Research . . . 2
1.3 Ethics and Social Considerations . . . 2
2 Theory 4 2.1 Physical Phenomena in Electrolytes . . . 4
2.2 Membranes . . . 5
2.3 Non-ideal Membranes . . . 8
2.4 Mechanical and Material Limitations . . . 8
2.5 Dielectric Exclusion . . . 8
3 Experimental Approach 9 3.1 Sample Preparation . . . 9
3.2 Permselectivity . . . 9
3.3 Membrane Permeance . . . 10
3.4 Pore Size and Size Distribution . . . 10
4 Results and Discussion 12 4.1 Pore Size and Size Distribution . . . 12
4.2 Permselectivity . . . 13
4.3 Water Permeance . . . 16
5 Conclusion 18
6 Future Recommendations 19
Bibliography 21
1
|
Introduction
Global fresh water demand is rapidly rising, and this demand is not always met. While this is partly for economic reasons, large coastal areas in Africa and Asia suffer a physical water shortage. This shortage can be met by desalination of seawater[1]. Methods of desalinating water include evaporation, electrodialysis, freezing and reverse osmosis[2]. Both electrodialysis and reverse osmosis processes use membranes to separate salts from water. Reverse osmosis is a pressure driven process, in which water is pumped through the membrane while ions are rejected. The method is commercially viable, although other techniques are more energy efficient[3, 4]. Recently, graphene has been researched as an ion-selective membrane which is expected to be applicable in reverse osmosis processes.
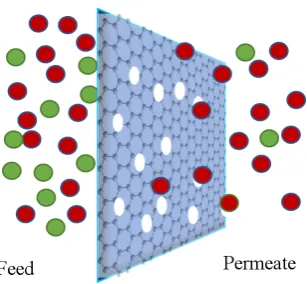
[image:7.595.377.531.402.544.2]1.1
Motivation and Background
Figure 1.1: Graphical representa-tion of a graphene membrane. Graphene is one of about 700 stable two-dimensional,
one atom thick materials currently known[5]. Being one carbon atom thick, graphene has a thickness of 3.5Å[6]. Graphene was first observed in 1948 but only isolated in 2004[6]. Since then, new methods of pro-ducing graphene at higher purities, larger continuous crys-tals and lower costs have rapidly been developing[7]. It has shown great promise for a multitude of appli-cations. Graphene has shown unique electrical proper-ties, high mechanical strength and has been shown to be impermeable to nearly all substances. Due to its unique and promising properties, as well as its physi-cal simplicity as a two-dimensional material, research in graphene has grown exponentially since it was first iso-lated.
Graphene-based membranes such as graphene-oxide and
reduced graphene-oxide have been successfully used in reverse osmosis processes[8]. Their the-oretical and practical efficiency are comparable to commercially available polymer membranes. More recently, porous graphene has been developed as a membrane. Using ion bombardement and etching technologies, size-controlled pores have been created in graphene[9].
through pores in graphene has low friction. A graphic representation of a graphene membrane is given in figure 1.1.
Graphene production over large areas and at low costs is still challenging, though methods are rapidly developing[6]. Therefore, it is reasonable to believe suitable areas of graphene membranes will become commercially viable in the future.
There are two ion rejection principles at work in nanofiltration membranes. These transport limiting phenomena are known as Donnan exclusion and dielectric exclusion[13], and are expanded upon in the theory section. Either cations or anions are selectively passed through the ion exchange membrane. A net charge can not exist between the two phases, so transport driving forces of the ion to which the membrane is selective work against the other ion species’ rejection force.
1.2
Topic of Research
In this thesis, the relevant transport phenomena like Donnan exclusion and dielectric exclusion will be identified for nanoporous graphene. This is done by studying the transport through the membrane with different salt concentrations (tuning the Debye length). Both mono and bivalent salts will be used to identify the effects of dielectric exclusion and Donnan exclusion. Additionally, size distribution of pores and pore distribution will be studied. This can be done through two methods; permporometry and Scanning Electron Microscopy (SEM). The SEM imaging will mainly be used to characterize PET, whereas permporometry will be used to study the graphene membranes (due to SEM resolution restrictions). Through these techniques, the pore size and spacial distribution may be studied. The effects of this variance may then be studied using electrochemistry. The relation between the physical properties of nanoporous graphene to the selectivity of ions will be developed.
1.3
Ethics and Social Considerations
[image:8.595.100.499.531.732.2]If water purification through graphene membranes approaches its theoretical efficiency on an industrial scale, this will have effects on water related politics. It will play a particularly important role in coastal areas of drought, which are abundant in Africa and Asia as can be seen in figure 1.2.
2
|
Theory
Modeling of ion-exchange membranes is well established[14]. Conventional ion exchange mem-branes are orders of magnitude thicker than graphene memmem-branes. Some membrane parameters, such as fixed pore concentration, are less physically correct for a graphene membrane considering its thickness. The low membrane thickness makes the concentration have little meaning. In this theory section, two ion transport models for membranes will be presented. Finally, some theory regarding non-ideality of membranes and the unique properties of graphene will be discussed.
2.1
Physical Phenomena in Electrolytes
In order to understand the processes surrounding an ion-exchange membrane, the transport driving forces and electric screening forces within the membrane must be understood. Commonly used theories describing these forces are introduced.
The Nernst-Planck Equation
One of the most common methods of describing ion transport in fluids is the Nernst-Planck electrodiffusion equation. It describes ion flux for three different additive driving forces. The one-dimensional transport of ion i in an electrolyte is given by equation 2.1[15].
Ji= vCi
|{z} Convection
¯
−DidC¯i dx −Di
dlnγ¯i
dx
| {z }
Di f f usion
−ziD¯iCi F RT
dE dx
| {z }
Migration
(2.1)
The fundamental understanding in the formulation of the Nernst-Planck equation is the additivity (and independence) of the diffusion and electrodiffusion factors. The Nernst Planck equation is the foundation of TMS theory, discussed in section 2.2
Electric Field Screening
The electric field induced by an ion in an electrolyte is screened by both dielectric effects of water and those of other ions. Electrostatic interaction between two charged particles can be described by Coulombs law. In describing the interaction, it is calculated for each ion pair in the system. Two particle interactions scale exponentially with the amount of particles in the system. For larger systems, the amount of interactions grows to be incalculable[16].
longer dependent on their environment. The result is the Debye-Hückel equation[17], equation 2.2.
λD−1=
s
2e2I
ε0kBT
(2.2)
Here the Debye layer is introduced. It is the length in which the electric field induced by the ion decays by 1e. Negative screening allows transport for cations, while anions are repelled. As can be seen in the equation, the Debye length is dependent on ionic strength I. The ionic strength is given byI=12∑
i
ciz2i[mM], and thereby linearly dependent on ion concentration. Fixed charge on the pore edge of a membrane also induces this electric screening. The screening can be approached as in Debye-Hückel.
2.2
Membranes
An ion-selective membrane is a membrane which selectively allows either cation or anion transport. Typically, the thickness of these membranes ranges in the micrometer scale. The transport selectivity is typically governed by charged groups or ions fixated in or on the membrane. Charged groups selectively allow counterion transport (ions with the countercharge) and repel coions (ions with the same charge).
Graphene as a Membrane
Theoretically, a sheet of graphene is impermeable to nearly all matter[6]. In nanoporous graphene, defects have been introduced. These defects function as pores, making the graphene a membrane. During ion bombardment, functional groups are formed on the pore edges. The electric screening induced by these fixed groups can be described by the Debye-Hückel approach, as the Debye-length covers the pores partially.
Charge neutrality
As stated in the introduction, the graphene membrane is cation-selective. For a perfectly selective membrane, this means only cations are transported through the membrane. Electrolytes on both sides of the membrane must remain charge-neutral, as described in equation 2.3[14]
z+Jx,+ =−z−Jx,− (2.3)
in which z is the ion charge number and J is the ion flux through the membrane in direction x. Due to this charge neutrality condition, flux through an ion-selective membrane is always governed by the transport of the coion to the membrane charge. In other words, no net transport takes place through the membrane if either cation or anion is blocked completely.
Resting Membrane Potential
In a perfectly selective membrane, no net ion transport takes place due to the charge neutrality. The diffusion and electric driving forces for counterion transport are counteracted by the coion rejection of the membrane. The different levels of ion transport cause a potential difference over the membrane. The potential is given by equation 2.1 in which convection transport and net ion transport are zero, as well as dlnγi
dx for simplicity. This form is given in equation 2.4.
dE dx =−
RT ziF
1
Ci dCi
In which E is the electric field over the membrane, x the direction of flow, and z the charge number of ion i. Integrating with respect to x and taking the Nernst membrane potentialVNernst=E2−E1
yields the Nernst equilibrium potential, and is given by equation 2.5.
VNernst= RT ziF
lnC2 C1
(2.5)
Because pure water is an insulator, electrolyte conductance is governed by ion mobility and charge capacity. Therefore, the ion flux through the membrane can be measured electrically through a potential.
Teorell-Meyer-Sievers Theory
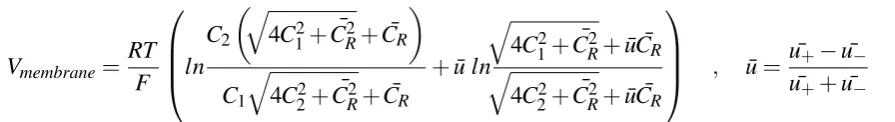
[image:12.595.169.423.318.592.2]A common approach to describing ion selective membranes is the Teorell-Meyer-Sievers (TMS) theory[18], in which the membrane phase is described as a third solution phase with different transport characteristics as in figure 2.1. These transport characteristics are described by the fixed charge concentration on the membrane. In TMS theory, the Donnan potential of the membrane-solution interfaces and diffusion potential within the membrane phase are assumed to make up the total membrane potential as in equation 2.6.
Figure 2.1: Schematic of the TMS model, adapted from [15]
Vmembrane=Vdon,1+Vdon,2+Vdi f f (2.6) The Donnan potential at solution interfaces is given by equation 2.7 and 2.8, based on the Nernst-Planck equation. ¯C1and ¯C2 indicate the concentrations in the membrane phase. ¯CR is the fixed charge concentration within the membrane. The fixed charge concentration and the ion concentration in bulk together form the concentrations ( ¯C1& ¯C2) at the membrane edges in TMS.
Vdon,1= RT F ln
¯
C1 C1 =
RT F ln
q
4C12+C¯R2+C¯R
Vdon,2= RT F ln
C2
¯
C2 = RT
F ln
2C2
q
4C22+C¯R2+C¯R
(2.8)
Assuming ions are linearly distributed across the membrane for the diffusion potential, the diffusion potential is given by equation 2.9. Here the respective ion diffusion coefficients can be substituted for the ion mobilitiesuiassuming ion mobility to be equal to bulk properties.
¯
Vdi f f =RT F
¯
u+−u¯−
¯
u++u¯−
ln
¯
C2
¯
C1 (2.9)
Combining equations 2.6-2.9 yields the total membrane potential as given by TMS theory in equation 2.10.
Vmembrane= RT F ln C2 q
4C12+C¯R2+C¯R
C1
q
4C22+C¯R2+C¯R
+u ln¯
q
4C12+C¯R2+u¯C¯R
q
4C22+C¯R2+u¯C¯R
, u¯=u¯+−u¯−
¯
u++u¯−
(2.10) Within TMS theory, it is assumed that the membrane phase interacts with both solution phases independently, and those have no effect on each other. For a sufficiently thick membrane (λD<<δ),
this holds true.
Membrane Selectivity
Membrane selectivity is defined by equation 2.11, with counter- and coion fluxes to the membrane
JCounter andJCorespectively.
ζ =JCounter−JCo JCounter
(2.11)
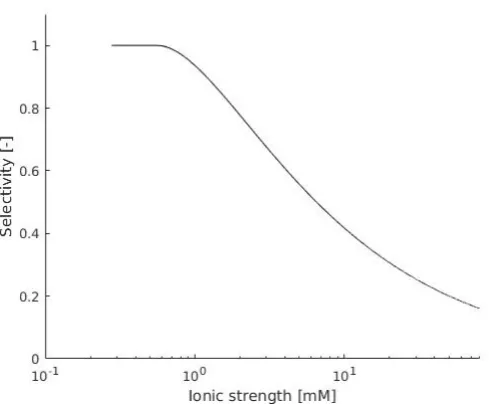
This selectivity can be directly related to the area not covered by screening induced by static charges in the pores. This selectivity based on fixed charge groups within the membrane is known as the Donnan potential. By combining equation 2.2 and 2.11, the membrane selectivity can be related to salt concentration in an ideal membrane with circular pores as in figure 2.2, equation 2.12 is obtained,
ζ = πr
2−π(r−α λ
D)2
[image:13.595.78.526.216.277.2]πr2 (2.12)
Figure 2.2: Debye layer pore coverage.
whereα is a dimensionless scaling factor relating transport driving forces to the screening
effects and r is the pore radius. For this approach, the pores are assumed to be perfectly cylindrical and have homogeneous charge distribution on the pore edge. The equation is plotted in figure 6.1 in the appendix for a pore with a 13 nm radius.
2.3
Non-ideal Membranes
Non-ideal behaviour in a nanofiltration membrane can have multiple indicates. First, surface conduc-tivity of a membrane can yield different electric potentials than the ion flux through the membrane produces. Additionally, defects in the membrane can cause coion leakage. For significant leaks, theoretical potential can not be attained. Defects can occur in handling or creation of the membrane. Distribution of pore size and pore charge can be affected by the ion bombardment process, as well as handling of the membrane and preparation discussed in section 3.1.
The defects are hard to describe mathematically, because of their non-uniform and undefined size, shape or charge characteristics. Therefore the membrane performance factor is introduced. The performance factor is given in equation 2.13 and is a membrane specific property.
β = ζE f f ective ζT heoretical
(2.13)
For ion fluxes J.
Charge Inversion Effects
For some electrolyte-membrane systems, the membrane switches selectivity to the former coion[19]. This effect only takes place in divalent ion systems, and is known as charge inversion. Mechanisms for this phenomenon describe former counterions interaction with the membrane surface, forming an oppositely charged layer on the pore surface. More detailed analysis of this phenomenon is beyond the scope of this thesis.
2.4
Mechanical and Material Limitations
Freestanding graphene was found to have the highest mechanical strength of all materials[20]. This strength deteriorates when pores are introduced and the graphene surface area is increased[21]. Additionally, synthesizing monolayer graphene was found challenging over large areas[22]. Because freestanding graphene is too fragile to function in the membrane environment, it is suspended on a nanoporous PET surface.
2.5
Dielectric Exclusion
3
|
Experimental Approach
Characterizing the graphene membrane and identifying the relevant transport processes is done primarily by electrical but also other analytical methods. First, the sample preparation is described. In the rest of the chapter, the various experiments and associated techniques are explained.
The used graphene membrane has a surface area of about 1 cm2. To prepare the membrane, graphene is transferred onto the PET support and coated with PMMA, as in figure3.1a. The membrane is then bombarded by ions, to create pores in the graphene and tracks in the PET. The graphene pores have an expected diameter of 10-20nm. The graphene membrane is delivered as in figure 3.1a, after ion bombardment.
3.1
Sample Preparation
The PET tracks are increased in size so they do not limit ion transport. The PET layer etched with 3M sodium hydroxide for 30 or more minutes at 50◦C. During these 30 minutes, the PET pores widen to about 80nm, but the graphene membrane layer is protected by the PMMA as in figure 3.1b. After etching, the sodium hydroxide is washed off using double distilled water. The membrane is then immersed in acetone for 45 minutes, removing the PMMA layer as in figure 3.1c. The graphene layer side of the membrane is kept as the top, to minimize transport effect differences due to the PET layer. During analysis, the top of the membrane is always directed at the higher concentration of the two electrolytes in contact.
3.2
Permselectivity
The selectivity of the membrane is defined as in equation 2.11. Within the membrane, two parameters can be determined on the basis of permselectivity. This is measured by the potential over the membrane. The results are qualitatively analyzed according to equation 2.12, and fitted to TMS theory according to equation 3.1, in whichβ and CRare fitting parameters.
Vmembrane=βRT F ln C2 q
4C12+C¯R2+C¯R
C1
q
4C22+C¯2R+C¯R
+u ln¯
q
4C12+C¯R2+u¯C¯R q
4C22+C¯R2+u¯C¯R
(3.1)
(a) Cutout of the membrane before preparation
(b) cutout of the membrane after etching
[image:16.595.243.353.208.314.2](c) Cutout of the membrane after acetone wash
Figure 3.1: Schematic diagram of the membrane preparation phases.
The measurement setup consists of two small containers separated by a membrane, as in figure 3.3. The containers are filled with the two salt solutions of different concentrations and are continuously replenished from a stock. This way, the transport through the membrane does not significantly influence the bulk concentrations. The potential is measured using a potentiometer. Throughout the measurements, the higher concentration is always kept at five times the lower concentration. This way, potential is only dependent on the membrane selectivity and performance. In addition to the membrane potential, the bulk diffusion potential is measured using bare PET in place of the membrane.
3.3
Membrane Permeance
Basic TMS theory does not include convective transport. Additional approaches have been devel-oped to incorporate water transport[26]. It is simpler to assume no water transport through the membrane. This assumption is checked by membrane permeance. Water is put on the membrane under pressure, and the flux through the membrane is weighed using a analytical balance. This way, water transport through the membrane can be measured accurately for multiple pressures.
3.4
Pore Size and Size Distribution
Figure 3.2: TMS-calculated membrane potential for C2
C1=0.1, reproduced from [18]
Figure 3.3: The permselectivity setup
are filled, the distribution of the pore size can be measured by the rate of oxygen permeance change, and the pore size through the Young-Laplace equation from the pressure at which permeance occurs.
Alternatively, the pore sizes can be determined by SEM. In SEM, the surface of the graphene membrane is analyzed by a focussed electron beam. Electron interaction with the carbon atoms of graphene produce signals, which can be analyzed by specialized sensors. SEM provides a graphic depiction of graphene pores. Samples of surface topography can be studied, giving information on the total pore size distribution. Additionally, SEM gives information on pore shapes and spacial distribution over the membrane.
[image:17.595.203.393.309.517.2]4
|
Results and Discussion
In this chapter the experimental results are presented and discussed. Additionally, the results of fitting the membrane performance parameter and fixed charge concentration are presented and discussed.
4.1
Pore Size and Size Distribution
Sadly, no pore size results were obtained. The high-resolution SEM required for analyzing the graphene pores was not available during the research. Low-resolution SEM imaging was available and used, but this way only the PET layer and pores could be seen. Pore characteristics of the PET layer are still interesting in the broader research, but not within the scope of this thesis.
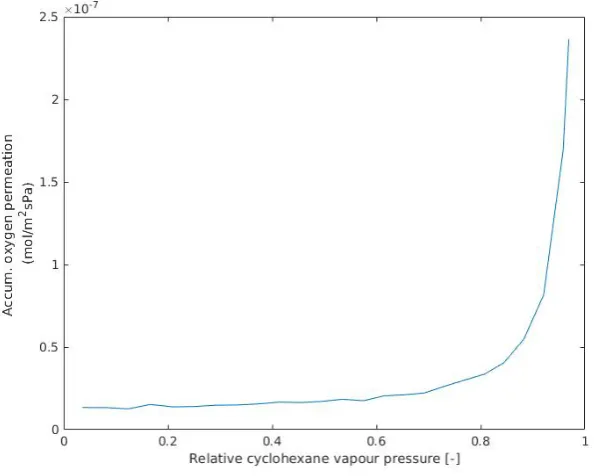
[image:18.595.141.440.433.671.2]The permporometer that was used yielded no results, as can be seen in figure 4.1. If results occured, a transition would occur in the graph. The results give constant membrane leakage, regard-less of partial pressure. Therefore, no Laplace effects and through this no pore sizes were found.
Figure 4.1: Permporometry results
correlated to the feed concentration, without membrane effects. Second, the feed gas can leak through the membrane. Due to large defects in the membrane, the feed gas can flow through the membrane. This, similarly to an insufficient sample area, would cause no Laplace effects to be measured. Without pore size results, the physical properties of the membrane are largely unknown. It is also not possible to distinguish between Donnan and dielectric exclusion within given theory.
4.2
Permselectivity
Membrane permselectivity results can be found in figure 4.2 on page 14. Permselectivity measure-ments were taken for KCL, LiCl, K2SO4and CaCl2. Temperatures during measurement were kept
between 25◦C and 26◦C. Electrolytes on either side of the membrane were continuously refreshed from a one liter bottle. Solution conductivities were checked for both solutions before and after each measurement series. Solution conductivity did not vary significantly before and after permselectivity measurements. This indicated no significant salt exchange between the solutions had taken place, which would make these measurements time progressive due to changing salt concentrations. For each data point, potential over the membrane was measured for a set time. Multiple series were taken for each concentration, of each of which the average was taken as a data point. The error projected is the 95% confidence interval of the repeat error of the series averages. Previous studies within the group have shown irreversible charge inversion to occur for using CaCl2. In order to
continue further experiments with the membrane used for the other salts, a different membrane was used for CaCl2. Bare PET results can be found in table 6.1 in the appendix.
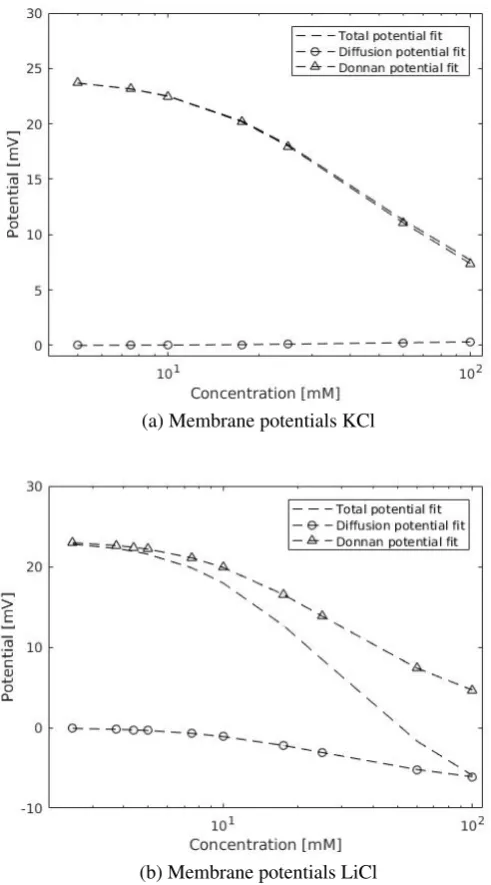
Qualitative results
In figures 4.2 and 4.3, it can be seen that a clear comparable trend is shown for KCl, LiCl and K2SO4. The trends qualitatively match TMS theory and Debye screening pore coverage predictions
in the partly covered regime. From these results, the expected S-curve from theory can not be confirmed. Low concentration potential asymptotically approaches the Donnan potential and the high concentration asymptotically approaches diffusion potential. In the intermediate region, both potentials work towards the total potential. More data points are needed for all solutions in the lower and higher concentration regimes to draw meaningful conclusions. The Donnan potentials are expected to be equal for equal ionic strengths, but different diffusion properties of salts result in different measured membrane potentials.
Figure 4.3 shows results of a different membrane for CaCl2. Qualitatively, the experimental
results greatly differ from the theory. Errors in the measurements are significantly larger than for the other salts and the other membrane. Moreover, no trend in the data points seems to exist. The membrane used for CaCl2 may have significantly larger defects than the one used in the other
salts. This is supported by the bulk diffusion potential presented in table 6.1 in the appendix. The potentials are comparable, as is expected for a non-functioning (leaky) membrane.
The membrane is cationically selective for KCl, LiCl and K2SO4. For CaCl2, the membrane
appears to be anionically selective, or appears to have lost ionic selectivity. Measured potentials varied without concentration-dependent trend around the bulk diffusion potential. The membrane used for CaCl2was not tested using other salts, so it is not possible to say whether the sample had
membrane properties. It has previously been observed that the potential sign switches after being used as a CaCl2membrane. CaCl2selectivity can be measured using a membrane which works for
Figure 4.2: Experimental membrane potentials for KCl, LiCl and K2SO4.
[image:20.595.125.457.476.732.2]Quantitative results: fits to TMS theory
Problems in quantitative results largely overlap with qualitative results. TMS fits can be found in figure 4.4. The fits are also plotted in the appendix, in figure 6.2, together with data points. For LiCl and K2SO4, more measurements were taken at lower concentrations to improve fitting conditions.
Data at higher concentrations is needed to further improve fitting results. The effect of additional data can clearly be seen comparing plot 4.4 a with b & c. In K2SO4and LiCl fits, platforming and
mainly Donnan potential dependence at lower concentrations is found. Diffusion potential becomes more dominant at higher concentrations, whereas Donnan potential approaches 0 here.
Fixed charge concentration in TMS theory should remain constant between salts, being a mem-brane specific property. The fitted fixed memmem-brane charges vary significantly with salt type. As described in section 2.2, TMS theory does not include interface thickness effects. When membrane thickness is smaller than debye length of solutions, the charge term for the membrane phase changes and becomes non-linear. Because of the low membrane thickness in this system, CR loses its
physical meaning. A correction for this term will have to be found, or a different theorem than TMS will have to be applied.
Ion mobilities given in TMS theory are used for the membrane phase. Diffusion coefficients at infinite dilution were taken from literature[25]. In taking these values, it is assumed ionic mobility is equal for bulk and pore phase. Nanopores are known to lower ion diffusion properties due to spacial constraints. It is difficult to predict the effects of a very thin membrane on the diffusion.
Membrane performance as calculated by TMS is higher for K2SO4 than other membranes.
Considering K2SO4measurements go to lower concentrations than LiCl and KCl, it is probable
that Debye screening overlap has not fully occurred at for the latter two salts in the measurements. Measurement errors greatly increase due to instrument limitations at lower concentrations, limiting measurements at these concentrations. The membrane performance should remain constant for different salts according to theory. An alternative explanation for the increased membrane perfor-mance is pH influences. SO42-forms sulfuric acid with hydrogen, altering pH. Effects of the pH
may play a role in the transport.
Fixed Membrane Charge [mM] Membrane performance[-]
LiCl 41.7 0.58
K2SO4 20.3 0.78
KCl 66.7 0.60
Standard Deviation Salts 23.2 0.11
Table 4.1: TMS based membrane properties.
The standard deviations in the parameters can be held as a measure for applicability of the TMS assumptions to this system. Fixed membrane charge error reflects on the description of charge inside the membrane. As predicted in theory, the thickness of the membrane prevents a stable membrane phase from forming (because of screening effects from both solutions influencing the membrane phase). Therefore, the fixed membrane charge gives a high error.
4.3
Water Permeance
Water permeance through the membrane was measured in two ways. Primarily, it was measured through a water permeance setup. Water flux was measured up to 4 bar. No permeance was observed. Literature studies have shown transport to occur from 10 bar[28].
(a) Membrane potentials KCl
(b) Membrane potentials LiCl
[image:23.595.168.414.58.501.2](c) Membrane potentials K2SO4
Figure 4.4: a): LiCl fit to TMS theory b): KCl fit to TMS theory c): K2SO4 fit to TMS theory.
5
|
Conclusion
The selectivity of the graphene membrane was found to be dependent on the ion concentration for KCl, LiCl and K2SO4. Of the predicted S-curve, only the transition section were measured for KCl
and LiCl. No information on pore sizes or pore size distributions were found. No selectivity was found for CaCl2.
The calculated characteristic membrane properties from TMS theory are given in table 4.1. Calculated membrane performance is higher for K2SO4. Whether this is accurate is inconclusive
before KCl and LiCl are measured at the same low ionic strengths as K2SO4. Acidity effects may
also be the cause of the different effectivities. CaCl2was fitted to TMS, due to absence of a trend.
6
|
Future Recommendations
In this thesis, the effects of Donnan exclusion in the membrane have been explored. This chapter will contain a brief recommendations section on each of the methods used, followed by some general recommendations.
Permporometry has not yielded results. Possible causes offered for this are large scale membrane defects and insufficient membrane size in the measurement instrument. It is recommended to use a different permporometer with a smaller measured area, or adjust the one used.
Alternatively, different membranes of the same size can be used. Defects should be different for each membrane, so another membrane may give better results. This performance of a non-defective membrane can in turn be related to permselectivity of such a membrane.
CaCl2permselectivity measurements will have to be redone using another membrane. Ideally,
one would use a membrane which has been proven to work with other salts. This way, membrane defects could be tested as a cause. Alternatively, the used membrane could be tested in a working permporometer (in which the large scale defects should influence results).
More permselectivity data is needed to confirm the S-curve predicted in equation 2.12. Improved accuracy of fit was found for K2SO4and LiCl over KCl at lower concentrations. Accuracy can be
further improved by more data at higher and lower concentrations. Lower concentrations require a different electrode setup, considering the setup used gives large measurement errors at sub-5 millimolar concentrations. Using different electrodes should limit electrode leakage and decrease the measurement error. Fitting may be done using ionic activity rather than concentrations in future fitting, as this was found to improve theoretical results in TMS theory[26].
In addition to the fixed charge concentration and membrane performance, the diffusion character-istics within the membrane can be fitted to TMS theory. Due to the membranes unique dimensions, effects on ion diffusion are difficult to predict. They can be fitted by using the ¯uas a fitting parameter, giving information on the diffusion transport.
The effects of pH have not been published in literature or researched in this work. pH effects on transport graphene may be interesting, and could be the cause for the improved K2SO4selectivity.
It is therefore interesting to vary pH of the solutions.
Bibliography
[1] International Water Management Institute. Comprehensive Assessment of Water Manage-ment in Agriculture. Technical report, United Nations Educational, Scientific and Cultural Organization, Paris, 2007.
[2] Andrea. Cipollina, Giorgio. Micale, and Lucio. Rizzuti. Seawater desalination : conventional and renewable energy processes. 2009. doi: 10.1007/978-3-642-01150-4.
[3] P G Youssef, R K AL-Dadah, and S M Mahmoud. Comparative Analysis of Desalination Technologies. Energy Procedia, 61:2604–2607, 2014. ISSN 1876-6102. doi: http://dx.doi. org/10.1016/j.egypro.2014.12.258.
[4] Gregory P Thiel. Salty solutions. PhysicsToday, 68(6):66, 2015. doi: 10.1063/PT.3.2828.
[5] Michael Ashton, Joshua Paul, Susan B Sinnott, and Richard G Hennig. Topology-Scaling Identification of Layered Solids and Stable Exfoliated 2D Materials. Physical Review Letters, (10):106101, mar 2017. doi: 10.1103/PhysRevLett.118.106101.
[6] Jamie H Warner. Chapter 1 - Introduction BT - Graphene. pages 1–4. Elsevier, 2013. ISBN 978-0-12-394593-8. doi: https://doi.org/10.1016/B978-0-12-394593-8.00001-1.
[7] Jamie H Warner, Franziska Schäffel, Alicja Bachmatiuk, and Mark H Rümmeli. Chapter 4 - Methods for Obtaining Graphene BT - Graphene. pages 129–228. Elsevier, 2013. ISBN
978-0-12-394593-8. doi: https://doi.org/10.1016/B978-0-12-394593-8.00004-7.
[8] Hee-Ro Chae, Jaewoo Lee, Chung-Hak Lee, In-Chul Kim, and Pyung-Kyu Park. Graphene oxide-embedded thin-film composite reverse osmosis membrane with high flux, anti-biofouling, and chlorine resistance. Journal of Membrane Science, 483:128–135, 2015. ISSN 0376-7388. doi: http://dx.doi.org/10.1016/j.memsci.2015.02.045.
[9] Sean C O’Hern, Michael S H Boutilier, Juan-Carlos Idrobo, Yi Song, Jing Kong, Tahar Laoui, Muataz Atieh, and Rohit Karnik. Selective Ionic Transport through Tunable Subnanometer Pores in Single-Layer Graphene Membranes. Nano Letters, 14(3):1234–1241, mar 2014. ISSN 1530-6984. doi: 10.1021/nl404118f.
[10] David Cohen-Tanugi and Jeffrey C Grossman. Nanoporous graphene as a reverse osmosis membrane: Recent insights from theory and simulation. Desalination, 366:59–70, 2015. ISSN 0011-9164. doi: http://dx.doi.org/10.1016/j.desal.2014.12.046.
[11] Ryan C Rollings, Aaron T Kuan, and Jene A Golovchenko. Ion selectivity of graphene nanopores. Nature Communications, 7:11408, apr 2016. doi: 10.1038/ncomms11408.
[13] Daniele Vezzani and Serena Bandini. Donnan equilibrium and dielectric exclusion for char-acterization of nanofiltration membranes. Desalination, 149(1-3):477–483, sep 2002. ISSN 00119164. doi: 10.1016/S0011-9164(02)00784-1.
[14] Toshikatsu Sata and Glyn N Jones.Ion Exchange Membranes. The Royal Society of Chemistry, 2004. ISBN 978-0-85404-590-7. doi: 10.1039/9781847551177.
[15] Y Tanaka. Chapter 4 Theory of Teorell, Meyer and Sievers (TMS Theory). Membrane Science and Technology, 12:59–66, 2007. ISSN 0927-5193. doi: http://dx.doi.org/10.1016/ S0927-5193(07)12004-0.
[16] Andrew Leach. Molecular Modeling: principles and applications. Pearson Education Limited, Harlow, England, 2nd edition, 2001. ISBN 978-0-582-38210-7.
[17] P Atkins and J de Paula. Atkins’ Physical Chemistry. Oxford University Press, 2010. ISBN 9780199543373.
[18] Yoshinobu Tanaka. Ion exchange membranes : fundamentals and applications. ISBN 9780444633194.
[19] Jesus Garcia-Aleman and James M Dickson. ISSN 0376-7388. doi: http://dx.doi.org/10.1016/ j.memsci.2004.02.036.
[20] Changgu Lee, Xiaoding Wei, Jeffrey W Kysar, and James Hone. Measurement of the Elastic Properties and Intrinsic Strength of Monolayer Graphene. Science, 321(5887):385 LP – 388, jul 2008. doi: 10.1126/science.1157996.
[21] Yilun Liu and Xi Chen. Mechanical properties of nanoporous graphene membrane. Journal of Applied Physics, 115(3):34303, jan 2014. ISSN 0021-8979. doi: 10.1063/1.4862312.
[22] Phaedon Avouris and Christos Dimitrakopoulos. Graphene: synthesis and applications.
Materials Today, 15(3):86–97, 2012. ISSN 1369-7021. doi: http://dx.doi.org/10.1016/ S1369-7021(12)70044-5.
[23] Serena Bandini and Daniele Vezzani. Nanofiltration modeling: the role of dielectric exclusion in membrane characterization.Chemical Engineering Science, 58(15):3303–3326, 2003. ISSN 0009-2509. doi: http://dx.doi.org/10.1016/S0009-2509(03)00212-4.
[24] Andriy E Yaroshchuk. Non-steric mechanisms of nanofiltration: superposition of Donnan and dielectric exclusion. Separation and Purification Technology, 22:143–158, 2001. ISSN 1383-5866. doi: http://dx.doi.org/10.1016/S1383-5866(00)00159-3.
[25] W. M. Haynes. Ionic Conductivity and Diffusion at Infinite Dilution. In Handbook of Chemistry and Physics, page Internet Edition. CRC Press/Taylor & Francis, Boca Raton, 97th edition, 2017.
[26] A H Galama, J W Post, H V M Hamelers, V V Nikonenko, and P M Biesheuvel. On the Origin of the Membrane Potential Arising Across Densely Charged Ion Exchange Membranes: How Well Does the Teorell-Meyer-Sievers Theory Work? Journal of Membrane Science and Research, 2(3):128–140, jul 2016. doi: 10.22079/jmsr.2016.20311.
[28] T Humplik, J Lee, SC C O’Hern, BA a Fellman, MA A Baig, SF F Hassan, MA A Atieh, F Rahman, T Laoui, R Karnik, EN N Wang, S C O’Hern, BA a Fellman, MA A Baig, SF F Hassan, MA A Atieh, F Rahman, T Laoui, R Karnik, and EN N Wang. Nanostructured materials for water desalination. Nanotechnology, 22(29):292001, 2011. ISSN 0957-4484. doi: 10.1088/0957-4484/22/29/292001.
[29] David Cohen-Tanugi, Ronan K McGovern, Shreya H Dave, John H Lienhard, and Jeffrey C Grossman. Quantifying the potential of ultra-permeable membranes for water desalination.
Appendix
Bare PET measurements
Concentration C1 [mM] CaCl2 K2SO4 LiCl KCl
7.5 13.0 mV - -
-10 10.2mV 7.0mV -9.3 mV
-25 - 6.9mV - 0.5 mV
100 - - -14.2 mV
-Table 6.1: Bare PET potentials for salts and concentrations.
[image:30.595.132.462.228.302.2]Additional figures
[image:30.595.171.416.405.607.2](a) Membrane potentials KCl
(b) Membrane potentials LiCl
[image:31.595.168.412.58.505.2](c) Membrane potentials K2SO4
![Figure 1.2: Global physical water shortage per river basin, reproduced from [1].](https://thumb-us.123doks.com/thumbv2/123dok_us/9737314.474616/8.595.100.499.531.732/figure-global-physical-water-shortage-river-basin-reproduced.webp)
![Figure 2.1: Schematic of the TMS model, adapted from [15]](https://thumb-us.123doks.com/thumbv2/123dok_us/9737314.474616/12.595.169.423.318.592/figure-schematic-tms-model-adapted.webp)

![Figure 3.2: TMS-calculated membrane potential for C2C1 = 0.1, reproduced from [18]](https://thumb-us.123doks.com/thumbv2/123dok_us/9737314.474616/17.595.203.393.309.517/figure-tms-calculated-membrane-potential-c-c-reproduced.webp)