Feature selection for automated speech scoring
Anastassia Loukina, Klaus Zechner, Lei Chen, Michael Heilman∗
Educational Testing Service 660 Rosedale Rd Princeton, NJ, USA
{aloukina, kzechner, lchen}@ets.org, [email protected]
Abstract
Automated scoring systems used for the eval-uation of spoken or written responses in lan-guage assessments need to balance good em-pirical performance with the interpretability of the scoring models. We compare several methods of feature selection for such scor-ing systems and show that the use of shrink-age methods such as Lasso regression makes it possible to rapidly build models that both satisfy the requirements of validity and in-tepretability, crucial in assessment contexts as well as achieve good empirical performance.
1 Introduction
In this paper we compare different methods of se-lecting the best feature subset for scoring models used in the context of large-scale language assess-ments, with a particular look at the assessment of spoken responses produced by test-takers.
The basic approach to automatically scoring writ-ten or spoken responses is to collect a training cor-pus of responses that are scored by human raters, use machine learning to estimate a model that maps response features to scores from this corpus , and then use this model to predict scores for unseen re-sponses (Page, 1966; Burstein et al., 1998; Landauer et al., 2003; Eskenazi, 2009; Zechner et al., 2009; Bernstein et al., 2010). While this method is often quite effective in terms of producing scoring mod-els that exhibit good agreement with human raters, it can lend itself to criticism from the educational
∗Currently at Civis Analytics
measurement community if it fails to address cer-tain basic considerations for assessment design and scoring that are common practice in that field.
For instance, Ramineni and Williamson (2013) ar-gue that automated scoring not only has to be reli-able (i.e., exhibiting a good empirical performance as demonstrated, for example, by correlations be-tween predicted and human scores), but also valid. One very important aspect of validity is to what ex-tent the automated scoring model reflects important dimensions of the construct measured by the test (a construct is the set of knowledge, skills, and abili-ties measured by a test). For example, a speaking proficiency test for non-native speakers may claim that it assesses aspects such as fluency, pronunci-ation, and content accuracy in a test-taker’s spo-ken response(s). If the features that contribute to the scoring models can be seen as measuring all of these aspects of spoken language well, the model would be considered valid from a construct point of view. However, if certain dimensions of the con-struct are not represented (well) by the feature set used in the scoring model, and/or features contained in the model address aspects not considered to be relevant for measuring the test construct, the con-struct validity of the scoring model would not be considered ideal (cf. also Bernstein et al. (2010) and Williamson et al. (2012) who make similar ar-gument).
Furthermore, relative contributions by features to each construct dimension should be easily obtain-able from the scoring model. To satisfy this require-ment, machine-learning approaches such as support vector machines (SVMs) with non-linear kernels
may be less ideal than a simple straightforward lin-ear regression model, where the contribution of each feature in the model is immediately obvious.
Finally, the contribution of each feature to the final score should be consistent with the relevant constructs: if all of the features in the model are designed to be positively correlated with human scores, the coefficients of all such features in the fi-nal model should be positive as well.
Fulfilling all of these requirements when build-ing automated scorbuild-ing models is not trivial and has, in the past, typically involved the participation and advice of human content and measurement experts whose role it is to optimize the feature set so that it adheres to the aforementioned criteria as much as possible, while still allowing for good empirical per-formance of the resulting automated scoring model (Zechner et al., 2009; Cheng et al., 2014). However, there are certain limitations to this manual process of scoring- model building, not the least of which is the aspect of time it takes to build models with iterative evaluations and changes in the feature set composition.
Alternatively, one can compute a large number of potential features and then use automatic feature se-lection to identify the most suitable subset. This sec-ond approach is commonly used in studies that aim to maximize the performance of machine-learning systems (cf. for example, H¨onig et al. (2010) among many others), but to our knowledge, it has not yet been applied in the assessment context where model performance needs to be balanced with model va-lidity in terms of construct coverage and other con-straints such as feature polarity.
We consider several methods of automatic fea-ture selection commonly applied to linear models (Hastie et al., 2013). These include subset selec-tion methods such as step-wise feature selecselec-tion as well as shrinkage methods such as Lasso regression (Tibshirani, 1996). We focus on feature selection methods that can be scaled to a large number of fea-tures which exclude, for example, the best-subset approach, which becomes unfeasible for more than 30–40 features. We also exclude methods that use derived input such as principal component regres-sion or partial least squares because the contribu-tion of each feature in the final model would be more difficult to interpret. Finally, we consider
fea-ture selection methods which make it possible to re-strict the coefficients to positive values. Such restric-tion is not specific to automated scoring and there-fore various algorithms have been developed to ad-dress this requirement (see, for example, Lipovet-sky (2009) for further discussion). We consider sev-eral of such methods including non-negative least squares regression Lawson and Hanson (1981) and a constrained version of Lasso regression (Goeman, 2010).
In this paper we address the following questions: (a) What methods of automatic feature selection can address all or most of the requirements of automated scoring and therefore are most suitable for this pur-pose? (b) Does more constrained selection affect the performance of such scoring models? (c) How do models based on automated feature selection com-pare to models based on human expert feature selec-tion in terms of empirical performance and construct coverage?
The paper is organized as follows: Section 2 pro-vides a description of the data used in this study, fur-ther details about the feature-selection methods, and the parameter setting for these methods. Section 3 presents the comparison between different feature-selection methods in terms of performance, coeffi-cient polarity, and construct coverage of the selected feature subset. Finally, Section 4 summarizes the re-sults of our experiments.
2 Data and Methodology 2.1 Data
The study is based on spoken responses to an En-glish language proficiency test. During the original test administration, each speaker provided up to six responses. Two of the items required test takers to listen to an audio file and respond to a prompt about the conversation or lecture they heard. For the other two items, the test takers were required to read a short passage and listen to an audio file, and then integrate information from both sources in their re-sponses to that prompt. The remaining two items asked the speakers to discuss a particular topic. All responses consisted of unscripted speech and were no longer than 1 minute each.
ex-ceptions, the training set included one response from each speaker, for a total of 9,956 responses and 9,312 speakers. The evaluation set included a simi-lar number of speakers (8,101), but we used all avail-able responses for each speaker, for a total of 47,642 responses1. There was no overlap of speakers or
prompts between the two sets.
All responses were assigned a holistic proficiency score by expert raters. The scores ranged from 1 (low proficiency) to 4 (high proficiency). The raters evaluated the overall intelligibility of responses, grammar, the use of vocabulary, and topic develop-ment. About 10% of the responses in the evaluation set and all responses of the training set were scored by two raters. The agreement between the two raters was Pearson’sr = 0.63 for the training set and r = 0.62 for the evaluation set.
2.2 Features
For each response, we extracted 75 different features which covered five aspects of language proficiency: fluency, pronunciation accuracy, prosody, grammar, and vocabulary. Some examples of such features include speech rate (fluency), normalized acous-tic model score (pronunciation accuracy), language model score (grammar), and average lexical fre-quency of words used in the response(vocabulary). Several features were closely related: for example, the speech rate was measured in both words per sec-ond and syllables per secsec-ond.
All features are designed to be positively corre-lated with human proficiency scores. For features that have a negative correlation with a proficiency score (such as the number of disfluencies), the val-ues are multiplied by -1 so that the final correlation is always positive.
The features for the baselineEXPERTmodel were
manually selected by an expert in English language learning to fulfill the criteria described in 1. The expert only had access to the training set while do-ing the feature selection. The model included 12 features which represented the five dimensions of language proficiency described above. The features were then used as independent variables in an ordi-nary least squares (OLS) linear regression using the 1A small number of responses originally collected from these speakers were not included in the evaluation set due to their low audio quality or other problems.
proficiency score assigned by the first rater as the dependent variable.
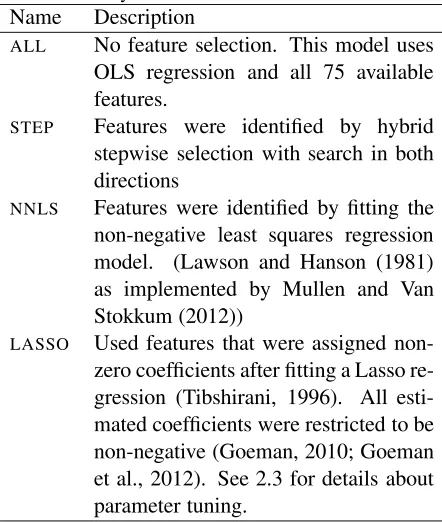
[image:3.612.312.533.182.443.2]We also built scoring models using all 75 features and several methods of automatic feature selection, following (Hastie et al., 2013). These are listed in Table 1.
Table 1: The methods used for automatic feature selec-tion in this study
Name Description
ALL No feature selection. This model uses
OLS regression and all 75 available features.
STEP Features were identified by hybrid
stepwise selection with search in both directions
NNLS Features were identified by fitting the
non-negative least squares regression model. (Lawson and Hanson (1981) as implemented by Mullen and Van Stokkum (2012))
LASSO Used features that were assigned
non-zero coefficients after fitting a Lasso re-gression (Tibshirani, 1996). All esti-mated coefficients were restricted to be non-negative (Goeman, 2010; Goeman et al., 2012). See 2.3 for details about parameter tuning.
We used 10-fold cross-validation on the training set to estimate model performance and tune the pa-rameters for the Lasso regression. The allocation of responses between the folds was the same for all models. In all cases, the feature selection was ap-plied separately to each fold.
The models were evaluated by the correlation be-tween predicted and observed scores, the number of features in the final model, the percentage of fea-tures with positive coefficients, and by the number of constructs that were represented in the automati-cally selected subset model.
2.3 Setting parameters forLASSOmodel
We trained two versions of the LASSO models: LASSOwhereλparameter forL1-regularization was
tuned empirically to achieve the best model fit and
pos-sible set of features without a substantial loss in per-formance.
To set λforLASSO*, we used the algorithm
de-scribed in Park and Hastie (2007) to identify the val-ues ofλthat corresponded approximately to changes in feature sets. This was done separately for each fold.
We then computed the model performance for each feature set and identified the best performing set of each size (in many cases different values ofλ
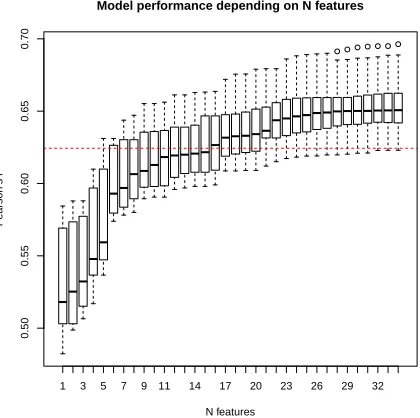
produced several different feature sets with the same number of features). Figure 1 shows the perfor-mance obtained for models with different numbers of features selected byLASSOacross the ten folds.
The figure shows that the number of features (12) in theEXPERTmodel may be insufficient to include
all information covered by the features.2 The
aver-age correlation for models with this number of fea-tures was r = 0.63. The optimal number of fea-tures for this dataset appeared to be around 21–25 features. We therefore setλtopn∗lg(p), wheren
is the number of cases andpis the total number of features. For this dataset, this rule-of-thumb value forced a more aggressive feature selection and pro-duced a model with approximately 25 features.
3 Results
3.1 Model performance
Figure 2 and Table 2 show that the models with au-tomatic feature selection consistently outperformed the baseline EXPERT model (paired t-test with
Holm’s adjustment for multiple comparisons: p < 0.00001for all models). Note that all of these mod-els also used a higher number of features than what was included in theEXPERTmodel.
The models that did not have restrictions on pos-itive coefficients achieved the highest performance. However, half of the coefficients in bothSTEP and ALL were negative. This is partially due to the fact
that many features were highly correlated which re-sulted in what is known as “multicollinearity distor-tion of regression coefficients” (cf. also Lipovetsky (2009) for further discussion). Therefore the mod-els created using these feature-selection methods vi-2The figure shows the performance of the best performing set consisting of 12 features as identified byLASSO. These were
not the same features as selected by the expert
1 3 5 7 9 11 14 17 20 23 26 29 32
0.50
0.55
0.60
0.65
0.70
Model performance depending on N features
N features
P
earson’s r
Figure 1: The performance of models based on LASSO
feature selection by the number of features. The boxplots show the results across 10 folds of the training set. The horizontal line shows the performance atNfeat= 12 (r=
0.63), the size of the subset in theEXPERTmodel.
olated the criterion that the coefficient assigned to each feature must have the same sign as the marginal correlation between that feature and human score.
The methods which restricted feature selection to positive coefficients (NNLS, LASSO and LASSO*)
addressed this problem, but the performance of these models was somewhat lower (r= 0.65 vs. r= 0.67,
p <0.001) which suggests that there is further in-teraction between different features that are not cur-rently captured by a model restricted to positive co-efficients.
There was no significant difference in perfor-mance between NNLS, LASSO and LASSO* but the NNLS and LASSO models included more features
thanLASSO* model, making them more difficult to
interpret. LASSO* appeared to reach the best
com-promise between model complexity and model per-formance.
Finally, we evaluated the extent to which the per-formance ofLASSOmodels was due to the different
methods of coefficient estimation. We used the fea-ture set selected byLASSO* to fit an OLS regression
[image:4.612.315.525.69.278.2]models with coefficients estimated by OLS or penal-ized coefficients, but the two-step approach resulted in models with small negative coefficients in four out of ten folds. Therefore we used the originalLASSO*
[image:5.612.72.266.204.303.2]with penalized coefficients for final evaluation.
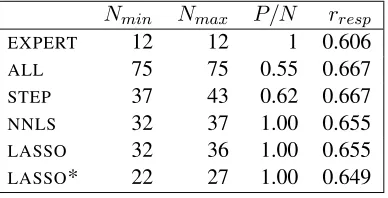
Table 2: Maximum and minimum number of features se-lected by each model (NminandNmax), average ratio of
features assigned positive coefficients to the totalN fea-tures (P/N) and average Pearson’srbetween predicted and observed scoresrrespacross 10 folds
Nmin Nmax P/N rresp
EXPERT 12 12 1 0.606
ALL 75 75 0.55 0.667
STEP 37 43 0.62 0.667
NNLS 32 37 1.00 0.655
LASSO 32 36 1.00 0.655
LASSO* 22 27 1.00 0.649
e
xper
t
all
step
NNLS Lasso Lasso*
0.58 0.60 0.62 0.64 0.66 0.68 0.70
Model performance on the training set
P
[image:5.612.70.285.281.536.2]earson’s r
Figure 2: Model performance (Pearson’s r) across 10 folds. Feature selection was performed separately at each fold. The horizontal line indicates the agreement between two human raters.
3.2 Model performance on unseen data
We then applied these feature selection methods to the whole training set and evaluated their per-formance on the unseen evaluation set. The re-sults were consistent with the rere-sults of the cross-validation and are shown in Table 3.
TheLASSO* model trained on the entire training
set included 25 features, all of which had positive coefficients. The correlation between the predicted and observed scores wasrresp = 0.653, which was
above theEXPERTbaseline (rresp= 0.607).
In addition to response-level agreement, we also computed the agreement for scores aggregated by speaker. During the test administration, the scores for all six responses given by each speaker are summed to compute an overall speaking proficiency score. Therefore, speaker-level agreementrsp was
calculated as the correlation coefficient (Pearson’s
r) between the summed observed scores and the summed predicted scores for each speaker. Fol-lowing operational practice, this was only done for 7,390 speakers, where scores were available for 5 or more responses.3. We found that the model
cre-ated using theLASSO* feature selection also
outper-formed theEXPERT model for speaker-level
agree-ment withrspincreasing from 0.78 to 0.84.
Table 3: Model performance on the unseen evalua-tion set using different feature- selecevalua-tion methods. The agreement between two human raters for this data is
rresp=0.62 for single responses. The human-human
agreement for the aggregated speaker-level score, rsp,
was not available for this particular data since only a small subset of responses were scored by two human raters. Based on other data from the same test,rsp
be-tween two human raters is expected to be around 0.9
Nfeat P/N rresp rsp
EXPERT 12 1 0.61 0.78
ALL 75 0.55 0.67 0.86 STEP 40 0.65 0.67 0.86
NNLS 37 1 0.66 0.85
LASSO 36 1 0.66 0.85
LASSO* 25 1 0.65 0.84
3.3 Construct coverage
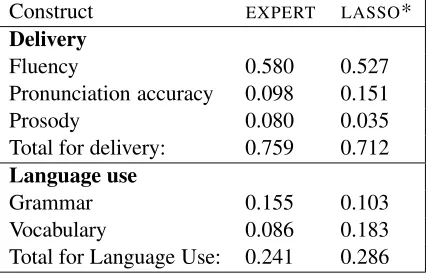
[image:5.612.313.491.458.556.2]Table 4: Relative weights of features representing differ-ent constructs covered by the scoring models.
Construct EXPERT LASSO*
Delivery
Fluency 0.580 0.527
Pronunciation accuracy 0.098 0.151
Prosody 0.080 0.035
Total for delivery: 0.759 0.712 Language use
Grammar 0.155 0.103
Vocabulary 0.086 0.183
Total for Language Use: 0.241 0.286
only consider in detail the features included in the LASSO* model which was selected in 3.1 as the best
compromise between model complexity and model performance.
The selected model included 25 features covering all of the constructs currently represented by the ex-pert model. To evaluate the construct coverage of each model we first computed standardized weights for each features. We then scaled the standardized weights for each model so that their sum equaled 1 and refer to them as “relative weights.” Finally, we computed the sum of relative weights of all features representing a given construct or sub-construct. The results are shown in Table 4.
The two models, EXPERT and LASSO* closely
matched in terms of construct coverage: delivery features in both models accounted for about 70-75% of the final score, with most weight given to fluency features, followed by pronunciation accu-racy and rhythm. Language-use features accounted for 25% of the final score, but the relative weights of sub-constructs differed between the two models: while the EXPERT model assigned more weight to
grammar features, theLASSO* model assigned more
weight to vocabulary features.
4 Discussion
Building automated scoring models for constructed responses, such as spoken or written responses in language assessments, is a complex endeavor. Aside from the obvious desire for high empirical perfor-mance, as measured in terms of agreement between predicted and human scores, a number of
impor-tant considerations from educational measurement should be taken into account as well. They include, foremost, the validity of the scoring model and, in particular, to what extent features that measure cer-tain aspects of the construct are represented in the model, and features that are not related to the con-struct are not. Additionally, the relative contribu-tion of each feature to the score based on the model should be transparent to the test taker and score user. Finally, each feature’s contribution to the score must be in the same polarity as its marginal correlation with the criterion score (human score or dependent variable).
Because of this complexity, scoring models for constructed responses were typically built in the past using human experts who selected features based on these criteria in an iterative fashion, training and evaluating scoring models after each feature set was chosen.
In this paper, we applied different methods of feature selection in order to select the best feature set for the automated scoring of spoken responses to an English language proficiency test. We aimed to simultaneously achieve optimal construct cover-age, maximal interpretability of the resulting scoring model, and good empirical performance.
For research question (a), what methods of feature selection are most suitable for the automated scoring of spoken responses, we found that a model based on Lasso regression fine-tuned to enforce more ag-gressive feature selection reaches a good compro-mise between relatively small number of features and good agreement with human scores. In addition, this model could also satisfy the requirement that all coefficients are positive. Finally, theLASSO* model
represented all constructs included into theEXPERT
model.
model and can be incorporated into a future model by developing new combined features.
Finally, for research question (c), how automatic and expert feature selection compare in terms of empirical performance and construct coverage, we found that in comparison to expert feature selec-tion, computing a large number of features with sub-sequent automatic selection leads to higher perfor-mance (for LASSO*: r = 0.84 vs. r = 0.78 on
the evaluation set for aggregated scores for each test taker) while maintaining construct validity and inter-pretability of the resulting models. Furthermore, the feature subset produced byLASSO* closely matched
theEXPERT model in terms of the relative
contribu-tion of each construct.
To summarize, the application of Lasso regression to feature selection for automated speech scoring made it possible to rapidly build models which both achieved higher performance than the expert base-line and also satisfied the requirements of construct coverage and interpretability of the model posed by the assessment context. In this respect, Lasso re-gression was superior to other common methods of feature selection such as step-wise selection, which could not satisfy all of these requirements.
In this study, the features selected by LASSO*
showed consistently good construct coverage across 10 folds of the training set. Yet it is possible that for a different dataset theLASSO* method may lead
to a feature subset which is considered sub-optimal by an expert. In this case, the automatically selected feature set can be adjusted by the expert to ensure appropriate construct coverage by adding additional features to the model or removing unwanted fea-tures from the original feature set and re-running the model to estimate the coefficients. Of course, such adjustments may lead to a loss in performance, in which case the optimal balance between construct validity and model performance will be determined by other considerations such as the nature of the as-sessment or the role of the automated scoring system in determining the final score.
5 Conclusion
In this paper we compared a range of different methods for the purpose of feature selection for the automated scoring models of spoken language in
the context of language assessment and educational measurement.
Based on a number of criteria as to what consti-tutes scoring models that have not only high empir-ical performance, are valid from a construct point of view, and interpretable for the test taker or score user, we demonstrated that in using the LASSO*
method all criteria can be satisfied: the resulting scoring model has construct coverage commensu-rate to that built by a human expert and its empirical performance is, at the same time, superior.
In future work, we plan to refine the automated feature selection process by using construct con-straints directly in the feature selection procedure. Acknowledgments
We would like to thank Lawrence Davis and Flo-rian Lorenz for their feedback and discussion; Kee-lan Evanini, Jidong Tao and Su-Youn Yoon for their comments on the final draft and Ren´e Lawless for editorial help.
References
Jared Bernstein, Alistaire Van Moere, and Jian Cheng. 2010. Validating automated speaking tests. Language Testing, 27(3):355–377.
Jill Burstein, Karen Kukich, Susanne Wolff, Chi Lu, Martin Chodorow, Lisa Braden-Harder, and Mary Dee Harris. 1998. Automated scoring using a hybrid feature identification technique. In Proceedings of the 36th annual meeting on Association for Computa-tional Linguistics - and 17th InternaComputa-tional Conference on Computational Linguistics, volume 1, pages 206– 210, Morristown, NJ, USA. Association for Computa-tional Linguistics.
Jian Cheng, Yuan Zhao D’Antilio, Xin Chen, and Jared Bernstein. 2014. Automatic Assessment of the Speech of Young English Learners.Proceedings of the 9th Workshop on Innovative Use of NLP for Building Educational Applications, pages 12–21.
Maxine Eskenazi. 2009. An overview of spoken lan-guage technology for education. Speech Communica-tion, 51(10):832–844.
Jelle J. Goeman, Rosa Meijer, and Nimisha Chaturverdi. 2012. Penalized L1 (lasso and fused lasso) and L2 (ridge) penalized estimation in GLMs and in the Cox model. R package version 0.9-42.
Trevor Hastie, Robert Tibshirani, and Jerome Friedman. 2013. The Elements of Statistical Learning: Data Mining, Inference, and Prediction, Second Edition (Springer Series in Statistics). Springer, 2nd edition. Florian H¨onig, Anton Batliner, Karl Weilhammer, and
Elmar N¨oth. 2010. Automatic assessment of non-native prosody for english as L2. Speech Prosody 2010, 100973(1):1–4.
Thomas K. Landauer, D. Laham, and Peter W. Foltz. 2003. Automated scoring and annotation of essays with the Intelligent Essay Assessor. In Mark D. Sher-mis and Jill C. Burstein, editors, Automated essay scoring: A cross-disciplinary perspective, pages 87– 112. Erlbaum, Hillsdale, NJ.
Charles L. Lawson and Richard J. Hanson. 1981.Solving Least Squares Problems. Prentice-Hall, Englewood Cliffs, NJ, January.
Stan Lipovetsky. 2009. Linear regression with special coefficient features attained via parameterization in ex-ponential, logistic, and multinomiallogit forms. Math-ematical and Computer Modelling, 49(7-8):1427– 1435.
Katharine M. Mullen and Ivo H.M. Van Stokkum. 2012. nnls: The Lawson-Hanson algorithm for non-negative least squares (NNLS). R package version 1.4.
Ellis B. Page. 1966. The imminence of... grading essays by computer.The Phi Delta Kappan, 47(5):238–243. Mee Young Park and Trevor Hastie. 2007.
L1-regularization path algorithm for generalized linear models. Journal of the Royal Statistical Society: Se-ries B (Statistical Methodology), 69(4):659–677. Chaitanya Ramineni and David M. Williamson. 2013.
Automated essay scoring: Psychometric guidelines and practices. Assessing Writing, 18(1):25–39, Jan-uary.
Robert Tibshirani. 1996. Regression shrinkages and selection via the Lasso. Journal of the Royal Sta-tistical Society: Series B (StaSta-tistical Methodology), 58(1):267–288.
David M. Williamson, Xiaoming Xi, and F. Jay Breyer. 2012. A framework for evaluation and use of auto-mated scoring. Educational measurement: issues and practice, 31(1):2–13.