Automated Measures of Specific Vocabulary Knowledge from Constructed
Responses (“Use These Words to Write a Sentence Based on this Picture”)
Swapna Somasundaran Educational Testing Services
660 Rosedale Road, Princeton, NJ 08541, USA
Martin Chodorow
Hunter College and the Graduate Center City University of New York,
New York, NY 10065, USA
Abstract
We describe a system for automatically scoring a vocabulary item type that asks test-takers to use two specific words in writing a sentence based on a picture. The system consists of a rule-based component and a machine learned statistical model which uses a variety of construct-relevant features. Specifically, in constructing the statistical model, we investigate if gram-mar, usage, and mechanics features devel-oped for scoring essays can be applied to short answers, as in our task. We also ex-plore new features reflecting the quality of the collocations in the response, as well as features measuring the consistency of the response to the picture. System accuracy in scoring is 15 percentage points greater than the majority class baseline and 10 percentage points less than human perfor-mance.
1 Introduction
It is often said that the best way to see if a per-son knows the meaning of a word is to have that person use the word in a sentence. Despite this widespread view, most vocabulary testing contin-ues to rely on multiple choice items (e.g. (Law-less et al., 2012; Lawrence et al., 2012)). In fact, few assessments use constructed sentence re-sponses to measure vocabulary knowledge, in part because of the considerable time and cost required to score such responses manually. While much progress has been made in automatically scor-ing writscor-ing quality in essays (Attali and Burstein, 2006; Leacock et al., 2014; Dale et al., 2012), the essay scoring engines do not measure profi-ciency in the use of specific words, except perhaps for some frequently confused homophones (e.g., its/it’s, there/their/they’re, affect/effect).
In this paper we present a system for automated scoring of targeted vocabulary knowledge based on short constructed responses in a picture de-scription task. Specifically, we develop a system for scoring a vocabulary item type that is in op-erational use in English proficiency tests for non-native speakers. Each task prompt in this item type consists of two target key words, for which the vo-cabulary proficiency is tested, and a picture that provides the context for the sentence construction. The task is to generate a single sentence, incorpo-rating both key words, consistent with the picture. Presumably, a test-taker with competent knowl-edge of the key words will be able to use them in a well-formed grammatical sentence in the context of the picture.
Picture description tasks have been employed in a number of areas of study ranging from second language acquisition to Alzheimer’s disease (El-lis, 2000; Forbes-McKay and Venneri, 2005). Pic-tures and picture-based story narration have also been used to study referring expressions (Lee et al., 2012) and to analyze child narratives in order to predict language impairment (Hassanali et al., 2013). Evanini et al. (2014) employ a series of pictures and elicit (oral) story narration to test En-glish language proficiency. In our task, the picture is used as a constraining factor to limit the type and content of sentences that can be generated us-ing the given key words.
In the course of developing our system, we ex-amined existing features that have been developed for essay scoring, such as detectors of errors in grammar, usage and mechanics, as well as col-location features, to see if they can be re-used for scoring short responses. We also developed new features for assessing the quality of sentence construction using Pointwise Mutual Information (PMI). As our task requires responses to describe the prompt pictures, we manually constructed tailed textual descriptions of the pictures, and
veloped features that measure the overlap between the content of the responses and the textual de-scription. Our automated scoring system is partly based on deterministic scoring criteria and partly statistical. Overall, it achieves an accuracy of 76%, which is a 15 percentage point improvement over a simple majority class baseline.
The organization of this paper is as follows: Section 2 describes the picture description task and the scoring guide that is used to manually score the picture description responses opera-tionally. It also considers which aspects of scor-ing may be handled best by deterministic proce-dures and which are more amenable to statistical modeling. Section 3 details the construction of a reference corpus of text describing each picture, and Section 4 presents the features used in scor-ing. Section 5 describes our system architecture and presents our experiments and results. Detailed analysis is presented in Section 6, followed by re-lated work in Section 7 and a summary with direc-tions for future research in Section 8.
2 Task Description and Data
The picture description task is an item type that is in actual operational use as part of a test of En-glish. It consists of a picture, along with two key words, one or both of which may be in an inflected form. Test-takers are required to use the two words in one sentence to describe the picture. They may change the inflections of the words as appropriate to the context of their sentence, but they must use some form of both words in one sentence. Requir-ing them to produce a response based on the pic-ture constrains the variety of sentences and words that they are likely to generate.
Trained human scorers evaluate the responses based on appropriate use of grammar and the rel-evance of the sentence to the picture. The opera-tional scoring guide is as follows:
score = 3The response consists of ONE sen-tence that: (a) has no grammatical errors, (b) contains forms of both key words used appro-priately, AND (c) is consistent with the pic-ture.
score = 2 The response consists of one or more sentences that: (a) have one or more grammatical errors that do not obscure the meaning, (b) contain BOTH key words, (but they may not be in the same sentence and
the form of the word(s) may not be accurate), AND (c) are consistent with the picture. score = 1The response: (a) has errors that in-terfere with meaning, (b) omits one or both key words, OR (c) is not consistent with the picture.
score = 0 The response is blank, written in a foreign language, or consists of keystroke characters.
Our decisions about scoring system design are based on the scoring guide and its criteria. Some aspects of the scoring can be handled by simple pattern matching or lookup, while others require machine learning. For example, score 0 is as-signed to responses that are blank or are not in English. This can be detected and scored in a straightforward way. On the other hand, the de-termination of grammaticality for the score points 3, 2 and 1 depends on the presence and severity of grammatical errors. A wide variety of such er-rors appear in responses, including erer-rors of punc-tuation, subject-verb agreement, preposition usage and article usage. The severity of an error depends on how problematic the error is, and the system will have to learn this from the behavior of the trained human scorer(s), making this aspect of the scoring more amenable to statistical modeling.
Similarly, statistical modeling is more suitable for determining the consistency of the response with respect to the picture. According to the scor-ing guide, a response gets a score of 0 or 1 if it is not consistent with the picture, and gets a score of 2 or 3 if it is consistent. Thus, this aspect cannot solely determine the score of a response – it influ-ences the score in conjunction with other language proficiency factors. Further, measures of how rel-evant a response is to a picture are likely to fall on a continuous scale, making a statistical modeling approach appropriate.
As a result of the heterogeneous nature of the problem, our system is made up of a statistical learning component as well as a non-statistical component.
2.1 Data
The data set consists of about 58K responses to 434 picture prompts. The mean response length was 11.26 words with a standard deviation of 5.10. The data was split into 2 development sets (con-sisting of a total of about 2K responses) and a fi-nal train-test set (consisting of the remaining 56K responses) used for evaluation. All 58K responses were human scored using the scoring rubric dis-cussed in Section 2. About 17K responses were double annotated. The inter-annotator agreement, using quadratic weighted kappa (QWK), was 0.83. Score point 3, the most frequent class, was as-signed to 61% of the responses, followed by score point 2 (31%), score point 1 (7.6%) and score point 0 (0.4%).
3 Reference Picture Descriptions
The pictures in our task vary in their complexity. A typical prompt picture might be a photograph of an outdoor marketplace, the inside of an airport terminal, a grocery store, a restaurant or a store room. Because consistency with respect to the pic-ture is a crucial component in our task, we needed a reliable and exhaustive textual representation of each picture. Therefore, we manually constructed a reference text corpusfor each of our 434 pic-ture prompts. We chose to use manual creation of the reference corpus instead of trying automated image recognition because automated methods of image recognition are error prone and would result in a noisy reference corpus. Additionally, auto-mated approaches would, at best, give us a (noisy) list of items that are present in the picture, but not the overall scene or event depicted.
Two annotators employed by a company that specializes in annotation created the reference cor-pora of picture descriptions. The protocol used for creating the reference corpus is shown below:
Part-1: List the items, setting, and events in the picture.
List, one by one, all the items and events you see in the picture. These may be animate ob-jects (e.g. man), inanimate obob-jects (e.g. table) or events (e.g. dinner). Try to capture both the
overall setting (restaurant), as well as the ob-jects that make up the picture (e.g. man, table, food). These are generally (but not necessar-ily) nouns and noun phrases. Some pictures can have many items, while some have only a few. The goal is to list 10-15 items and to cap-ture as many items as possible, *starting with the most obvious ones*.
If the picture is too sparse, and you are not able to list at least 10 items, please indicate this as a comment.
Part:2 Describe the picture
Describe the scene unfolding in the picture. The scene in the picture may be greater than the sum of its parts (many of which you will list in part-1). For example, the objects in a picture could be “shoe” “man” “chair”, but the scene in the picture could be that of a shoe purchase. The description tries to recreate the scene (or parts of the scene) depicted in the picture.
Generate a paragraph of 5-7 sentences de-scribing the picture. Some of these sentences will address what is going on, while some may address relations between items. The propor-tions of these will differ, based on the picture. Make sure that you generate at least one sen-tence containing the two key words.
If the picture is too simple, and you are not able to generate at least 5 sentences, please indicate this as a comment.
The human annotator was given the picture and the two key words. The protocol for creating each reference corpus asked the annotator to first ex-haustively list all the items (animate and inani-mate) in the picture. Then, the annotator was asked to describe the scene in the picture. We used this two step process in order to capture, as much as possible, all objects, relationships between ob-jects, settings and events depicted in the pictures.
insuffi-cient1.
In order to test coverage, we used a small devel-opment set of essays from each prompt and com-pared the coverage of the generated reference cor-pus over the development essays. If the cover-age (proportion of content words in the responses that were found in the reference corpus) was less than 50% (this was the case for about 20% of the prompts), we asked the secondary annotator to create a new reference corpus for the prompt. The two reference corpora for the prompt were then simply combined to form a single reference cor-pus.
4 Features for automated scoring
Because the score points in the scoring guide con-flate, to some degree, syntactic, semantic, and other weaknesses in the response, we carried out a scoring study on a second small development set (comprising of a total of 80 responses from 4 prompts, picked randomly) to gather insight into the general problems in English language profi-ciency exhibited in the responses. For the study, it was necessary to have test-taker responses re-scored by an annotator using an analytic scheme which makes the types and locations of prob-lems explicit. This exercise revealed that, in ad-dition to the factors stated explicitly in the scor-ing guide, there is another factor that results in low comprehension (readability) of the sentence and that reflects lower English proficiency. Specif-ically, the annotator tagged many sentences as be-ing “awkward”. This awkwardness was due to poor choice of words or to poor construction of the sentence. For example, in the sentence “The man is putting some food in bags while he is record-ing for the payment”, “recordrecord-ing for the payment” was marked as an awkward phrase. Based on our annotation of the scores and on the descriptions in the scoring guide, we selected features designed to capture grammar, picture relevance and awkward usage. We discuss each of our feature sets in the following subsections.
4.1 Features for Grammatical Error Detection
Essay scoring engines such as e-raterR (Attali and Burstein, 2006) typically use a number of 1We do not conduct inter-annotator agreement studies as the goal of the double annotation was to create a diverse de-scription.
grammar, usage and mechanics features that de-tect and quantify different types of English usage errors in essays. Examples of some of these error types are: Run-on Sentences,Subject Verb Agree-ment Errors, Pronoun Errors, Missing Posses-sive Errors, Wrong Article Errors, Missing Arti-cle Errors,Preposition Errors,Non-standard Verb or Word Form Errors, Double Negative Errors,
Fragment or Missing Comma Errors, Ill-formed Verb Errors,Wrong Form of Word Errors,Spelling Errors,Wrong Part of Speech Errors, andMissing Punctuation Errors.
In addition to these, essay scoring engines of-ten also use as features the Number of Senof-tences that are Short, the Number of Sentences that are Long, the Number of Passive Sentences, and other features that are relevant only for longer texts such as essays. Accordingly, we selected, from e-rater 113 grammar, word usage, mechanics and lexical complexity features that could be applied to our short response task. This forms ourgrammar fea-ture set.
4.2 Features for Measuring Content Relevance
We generated a set of features that measure the content overlap between a given response and the corresponding reference corpus for the prompt. For this, first the keywords and the stop words were removed from the response and the reference corpus, and then the proportion of overlap was cal-culated between the lemmatized content words of the response and the lemmatized version of the corresponding reference corpus, as follows:
|Response∩Corpus| |Response|
relevance features. Each measures the proportion of overlap as described by the equation above be-tween the lemmatized response and
1. lemmas:the lemmatized reference corpus. 2. cov-lin:the reference corpus expanded using
Lin’s thesaurus.
3. cov-wn-syns:the reference corpus expanded using WordNet Synonyms.
4. cov-wn-hyper: the reference corpus ex-panded using WordNet Hypernyms.
5. cov-wn-hypo: the reference corpus ex-panded using WordNet Hyponyms.
6. cov-all:the reference corpus expanded using all of the above methods.
Mean proportions of overlap ranged from 0.65 for lemmas to 0.97 for cov-all.
The 6 features listed above, along with the prompt id give a total of 7 features that form our
relevancefeature set. We use prompt id as a fea-ture because the extent of overlap can depend on the prompt. Some pictures are very sparse, so, the description of the picture in the response will be short, and will not vary much from the refer-ence corpus. For these, a good amount of overlap between the response and reference corpus is ex-pected. Other pictures are very dense with a large number of objects and items shown. In this case, any single response may describe just a small sub-set of the items and satisfy the consistency criteria, and consequently, even a small overlap between the response and the reference corpus may be suf-ficient.
4.3 Features for Awkward Word Usage In order to measure awkward word usage, we ex-plored PMI-based features, and also investigated whether some features developed for essay scor-ing can be used effectively for this purpose. 4.3.1 PMI-based ngram features
Non-native writing is often characterized by in-appropriate combinations of words, indicating the writer’s lack of knowledge of collocations. For ex-ample, “recording for the payment” might be bet-ter expressed as “enbet-tering the price in the cash reg-ister”. As “recording for the payment” is an inap-propriate construction, it is not likely to be com-mon, for example, in a large web corpus. We use
this intuition in constructing our PMI-based fea-tures.
We find the PMI of all adjacent word pairs (bigrams), as well as all adjacent word triples (trigrams) in the Google 1T web corpus (Brants and Franz, 2006) using the TrendStream database (Flor, 2013).
PMI between word pairs (bigram AB) is defined as:
log2 p(pA(AB).p(B) )
and between word triples (trigram ABC) as
log2 p(Ap).p(ABC(B).p)(C)
The higher the value of the PMI, the more com-mon is the collocation for the word pair/triple in well formed texts. On the other hand, negative values of PMI indicate that the given word pair (or triple) is less likely than chance to occur together. We hypothesized that this would be a good indica-tor of awkward usage, as suggested in (Chodorow and Leacock, 2000).
The PMI values for adjacent words obtained over the entire response are then assigned to bins, with 8 bins for word pairs and another 8 for word triples. Each bin represents a range for PMIp tak-ing real valuesRas follows:
bin1={p∈R|p >20}
bin2={p∈R|10< p≤20}
bin3={p∈R|1< p≤10}
bin4={p∈R|0< p≤1}
bin5={p∈R| −1< p≤0}
bin6 ={p∈R| −10< p≤ −1}
bin7 ={p∈R| −20< p≤ −10}
bin8 ={p∈R|p≤ −20}
Once the PMI values for the adjacent word pairs in the response are generated, we generate two sets of features. The first set is based on the counts of word pairs falling into each bin (for example,
Number of pairs falling intobin1,Number of pairs
falling intobin2and so on). The second set of
fea-tures are based on percentages (for example Per-centage of pairs falling into bin1, Percentage of
pairs falling intobin2 etc.). These two sets result
use percentages in addition to raw counts to ac-count for the length of the response. For example, it is possible for a long sentence to have phrases that are awkward as well as well formed, giving the same counts of phrases in the high-PMI value bins as that of a short sentence that is entirely well formed.
In addition to binning, we also encode as fea-tures the maximum, minimum and median PMI value obtained over all word pairs. The first two features capture the best and the worst word col-locations in a response. The median PMI value captures the overall general quality of the response in a single number. For example, if this is a low number, then the response generally has many bad phrasal collocations. Finally anull-PMIfeature is used to count the number of pairs that had zero entries in the database. This feature is an indica-tor that the given words or word collocations were not found even once in the database. Given the size of the underlying database, this usually hap-pens in cases when words are misspelled, or when the words never occur together.
All features created for bigrams are also created for trigrams. We thus have a total of 40 features, called thepmifeature set.
4.3.2 Features from essay scoring
A number of measures of collocation quality have been proposed and implemented (e.g. (Futagi et al., 2008; Dahlmeier and Ng, 2011)). We use e-rater’s measure of the density of ‘good’ colloca-tions found in the response. Another source of difficulty for non-native writers is the selection of appropriate prepositions. We use the mean proba-bility assigned by e-rater to the prepositions in the response. These two measures, one for the qual-ity of collocations and the other for the qualqual-ity of prepositions, are combined in ourcolprepfeature set.
4.4 Scoring Rubric-based Features
As seen in Section 2, some of the criteria for scor-ing are quite straightforward (e.g. “omits one or both key words”). While these are not sole deter-minants of a score, they are certainly strong influ-ences. Thus, we encode four criteria from the scor-ing guide. These form our final feature set,rubric, and are binary values, answering the questions: Is the first key word from the prompt present in the response? Is the second key word from the prompt present in the response? Are both key words from
[image:6.595.325.510.129.214.2]the prompt present in the response? Is there more than one sentence in the response?
Table 1 provides a list of feature types and the corresponding number of features of each type.
Feature set type Number of Features
grammar 113
relevance 7
pmi 40
colprep 2
rubric 4
Table 1: Feature sets and the counts of features in each set
[image:6.595.307.527.291.497.2]5 System and Evaluation
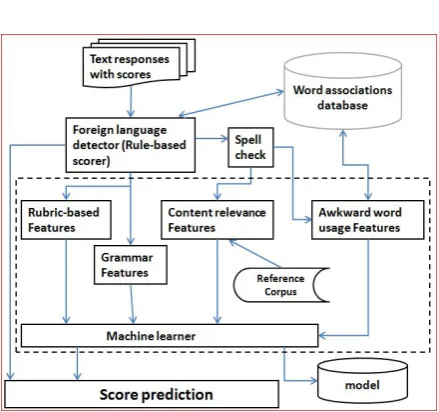
Figure 1: System Architecture
As noted earlier, the system is partly rule-based and partly statistical. Figure 1 illustrates the sys-tem architecture. The rule-based part captures the straightforward deterministic scoring criteria while the machine learning component encodes features described in Section 4 and learns how to weight the features for scoring based on human-scored responses.
a non-English sentence. The threshold was deter-mined by manually inspecting the PMI values ob-tained for sentences belonging to English and non-English news texts. Responses given zero scores by this module are filtered out and do not go to the next stage.
Responses that pass the rule-based scorer are then sent to the statistical scorer. Here, we encode the features discussed in Section 4. Spell checking and correction are carried out before features for content relevance and PMI-based awkward word usage are computed. This is done in order to pre-vent misspellings from affecting the reference cor-pus match or database search. The original text is sent to the Grammar feature generator as it cre-ates features based on misspellings and other word form errors. Finally, we use all the features to train a Logistic Regression model using sklearn. Note that the statistical system predicts all 4 scores (0 through 3). This is because the rule-based system is not perfect; that is, it might miss some responses that should receive zero scores, and pass them over to the next stage.
5.1 Metrics
We report our results using overall accuracy, quadratic weighted kappa (QWK) and score-level precision, recall and f-measure. The precision P of the system is calculated for each score point i as
Pi = |Si|∩SHi| i|
where |Si| is the number of responses given a
score ofiby the system, and|Si∩Hi|is the
num-ber of responses given a score ofiby the system as well as the human rater.
Similarly, recall,R is calculated for each score pointias
Ri = |Si|H∩Hi| i|
F-measure Fi is calculated as the harmonic
mean of the precision Pi and recall Ri at each
score point i. Accuracy is the ratio of the num-ber of responses correctly classified over the total number of responses.
5.2 Results
All of the responses in the train-test set were passed through the rule-based zero-scorer. A total of 210 responses had been scored as zero by the human scorer. The rule-based system scored 222 responses as zeros, of which 184 were correct.
The precisionPrule of the rule-based system is
calculated as
Prule
0 = 184222 = 82.9%
Similarly, Recall is calculated as
Rrule0 = 184210 = 87.6%
The corresponding F-measure is85.2%
The remaining responses pass to the next stage where machine learning is employed. We per-formed 10 fold cross-validation experiments us-ing Logistic Regression as well as Random Forest learners. As the results are comparable, we only report those from logistic regression.
Accuracy in % Agreement (QWK)
Baseline 61.00
-System 76.23 0.63
Human 86.00 0.83
Table 2: Overall system and human accuracy (in percentage) and agreement (using Quadratic Weighted Kappa)
Table 2 reports the results. The system achieves an accuracy of76.23%, which is more than a 15 percentage point improvement over the majority class baseline of 61%. The majority class base-line always predicts a score of 3. Compared to hu-man perforhu-mance, system perforhu-mance is 10 per-centage points lower (human-human agreement is 86%). Quadratic weighted kappa for system-human agreement is also lower (0.63) than for human-human agreement (0.83).
Table 3 reports the precision, recall and F-measure of the system for each of the score points.
Score point Precision Recall F-measure
0 84.2 68.3 72.9
1 78.4 67.5 72.6
2 70.6 50.4 58.8
3 77.8 90.5 83.6
Table 3: Overall system performance at each score point using all features
6 Analysis
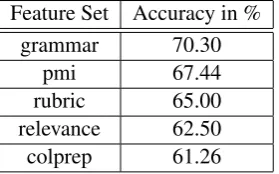
[image:7.595.305.530.287.349.2]systems using first the individual features alone, and then using feature combinations. Table 4 re-ports the accuracy of the learner using individual features alone. We see that, individually, each fea-ture set performs much below the performance of the full system (that has an accuracy of76.23%), which is expected, as each feature set represents a particular aspect of the construct. However, in general, each of the feature-sets (except colprep) shows improvement over baseline, indicating that they contribute towards performance improvement in the automated system.
Grammar features are the best of the individ-ual feature sets at 70% accuracy, indicating that grammatical error features developed for longer texts can be applied to single sentences. The PMI-based feature set is the second best performer, in-dicating its effectiveness in capturing word usage issues. Whilecolprepandpmiboth capture awk-ward usage, pmialone shows better performance (67.44%) than colprep alone (61.26%). Also, when rubric is used alone, the resulting system produces a four percentage point improvement over the baseline, with 65% accuracy, indicating the presence of responses where the test-takers are not able to incorporate one or both words in a sin-gle sentence. The relevance feature set by itself does not show substantial improvement over the baseline. This is not surprising, as according to the scoring guide, a response gets a score of 0 or 1 if it does not describe the picture, and gets a score of 2 or 3 if it is relevant to the picture. Hence, this feature cannot solely and accurately determine the score.
Feature Set Accuracy in % grammar 70.30
pmi 67.44
[image:8.595.113.253.533.620.2]rubric 65.00 relevance 62.50 colprep 61.26
Table 4: System performance for individual fea-tures
Table 5 reports accuracies of systems built us-ing feature set combinations. The first feature set combination, grammar + colprep, is a set of all features obtained from essay scoring. Here we see that addition ofcolprepdoes not improve the per-formance over that obtained by grammar features alone. Further, when colprep is combined with
pmi(colprep+pmi, row 2), there is a slight drop in performance as compared to using pmi-based features alone. These results indicate thatcolprep, while being useful for larger texts, does not trans-fer well to the simple single sentence responses in our task.
Further, in Table 5 we see that the system using a combination of the pmi feature set and the rele-vance feature set (pmi+relevance) achieves an ac-curacy of 69%. Thus, this feature combination is able to improve performance over that using either feature set alone, indicating that while content rel-evance features by themselves do not create an im-pact, they can improve performance when added to other features. Finally, the feature combination of all new features developed for this task (pmi + relevance+ rubric) yields 73% accuracy, which is again better than each individual feature set’s per-formance, indicating that they can be synergisti-cally combined to improve system performance.
Feature Set Accuracy in % (i) grammar + colprep 70.31
(ii) colprep + pmi 67.42 (iii) pmi + relevance 69.05 (iv) pmi + relevance + rubric 73.21
Table 5: System performance for feature combi-nations (i) typically used in essay scoring, (ii) that measure awkwardness, (iii) newly proposed here, (iv) newly proposed plus rubric-specific criteria
7 Related Work
Most work in automated scoring and learner lan-guage analysis has focused on detecting grammar and usage errors (Leacock et al., 2014; Dale et al., 2012; Dale and Narroway, 2012; Gamon, 2010; Chodorow et al., 2007; Lu, 2010). This is done either by means of handcrafted rules or with sta-tistical classifiers using a variety of information. In the case of the latter, the emphasis has been on representing the contexts of function words, such as articles and prepositions. This work is rele-vant inasmuch as errors in using content words, such as nouns and verbs, are often reflected in the functional elements which accompany them, for example, articles that indicate the definiteness or countability of nouns, and prepositions that mark the cases of the arguments of verbs.
mod-els which rely on large web-scale n-gram counts can be effective for the task of context-sensitive spelling correction. Measures of ngram associa-tion such as PMI, log likelihood, chi-square, and t have a long history of use for detecting colloca-tions and measuring their quality (see (Manning and Sch¨utze, 1999) and (Leacock et al., 2014) for reviews). Our application of a large n-gram database and PMI is to detect inappropriate word usage.
Our task also differs from work focusing on evaluating content (e.g. (Meurers et al., 2011; Sukkarieh and Blackmore, 2009; Leacock and Chodorow, 2003)) in that, although we are look-ing for usage of certain content words, we focus primarily on measuring knowledge of vocabulary. Recent work on assessment measures of depth of vocabulary knowledge (Lawless et al., 2012; Lawrence et al., 2012), has argued that knowl-edge of specific words can range from superficial (idiomatic associations built up through word co-occurrence) to topical (meaning-related associa-tions between words) to deep (definitional knowl-edge). Some of our features (e.g. awkward word usage) capture some of this information (e.g., id-iomatic associations between words), but assign-ing the depth of knowledge of the key words is not the focus of our task.
Work that is closely related to ours is that of King and Dickinson (2013). They parse picture descriptions from interactive learner sentences, classify sentences into syntactic types and extract the logical subject, verb and object in order to re-cover simple semantic representations of the de-scriptions. We do not explicitly model the seman-tic representations of the pictures, but rather our goal in this work is to ascertain if a response is relevant to the picture and to measure other fac-tors that reflect vocabulary proficiency.
We employ human annotators and use word similarity measures to obtain alternative forms of description because the proprietary nature of our data prevents us from releasing our pictures to the public. However, crowd sourcing has been used by other researchers to collect human labels for images and videos. For example, Rashtchian et al. (2010) use Amazon Mechanical Turk and Von Ahn and Dabbish (2004) create games to en-tice players to correctly label images. Chen and Dolan (2011) use crowd sourcing to collect multi-ple paraphrased descriptions of videos to create a
paraphrasing corpus.
In a vast body of related work, automated methods have been explored for the generation of descriptions of images (Kulkarni et al., 2013; Kuznetsova et al., 2012; Li et al., 2011; Yao et al., 2010; Feng and Lapata, 2010a; Feng and La-pata, 2010b; Leong et al., 2010; Mitchell et al., 2012). There is also work in the opposite di-rection, of finding or generating pictures for a given narration. Joshi et al. (2006) found the best set of images from an image database to match the keywords in a story. Coyne and Sproat (2001) developed a natural language understand-ing system which converts English text into three-dimensional scenes that represent the text. For a high-stakes assessment, it would be highly unde-sirable to have any noise in the gold-standard ref-erence picture descriptions. Hence we chose to use manual description for creating our reference cor-pus.
8 Summary and Future Directions
We investigated different types of features for au-tomatically scoring a vocabulary item type which requires the test-taker to use two words in writ-ing a sentence based on a picture. We generated a corpus of picture descriptions for measuring the relevance of responses, and as a foundation for feature development, we performed preliminary fine-grained annotations of responses. The fea-tures used in the resulting automated scoring sys-tem include newly developed statistical measures of word usage and response relevance, as well as features that are currently found in essay scoring engines. System performance shows an overall accuracy in scoring that is 15 percentage points above the majority class baseline and 10 percent-age points below human performance.
References
Yigal Attali and Jill Burstein. 2006. Automated essay scoring with e-rater v. 2.0. Journal of Technology, Learning, and Assessment, 4:3.
Shane Bergsma, Dekang Lin, and Randy Goebel. 2009. Web-scale n-gram models for lexical disam-biguation. InIJCAI.
Shane Bergsma, Emily Pitler, and Dekang Lin. 2010. Creating robust supervised classifiers via web-scale
n-gram data. In Proceedings of the 48th Annual
Meeting of the Association for Computational Lin-guistics, pages 865–874. Association for Computa-tional Linguistics.
Thorsten Brants and Alex Franz. 2006. Web 1T
5-gram Version 1. In Linguistic Data Consortium,
Philadelphia.
David L Chen and William B Dolan. 2011. Collect-ing highly parallel data for paraphrase evaluation. In Proceedings of the 49th Annual Meeting of the Association for Computational Linguistics: Human Language Technologies-Volume 1, pages 190–200. Association for Computational Linguistics.
Martin Chodorow and Claudia Leacock. 2000. An un-supervised method for detecting grammatical errors. InProceedings of the Conference of the North Amer-ican Chapter of the Association of Computational Linguistics (NAACL), pages 140–147.
Martin Chodorow, Joel R Tetreault, and Na-Rae Han. 2007. Detection of grammatical errors involving
prepositions. In Proceedings of the fourth
ACL-SIGSEM workshop on prepositions, pages 25–30. Association for Computational Linguistics.
Bob Coyne and Richard Sproat. 2001. Wordseye: an
automatic text-to-scene conversion system. In
Pro-ceedings of the 28th annual conference on Computer graphics and interactive techniques, pages 487–496. ACM.
Daniel Dahlmeier and Hwee Tou Ng. 2011. Cor-recting semantic collocation errors with L1 induced
paraphrases. In Proceedings of the Conference on
Empirical Methods in Natural Language
Process-ing, EMNLP ’11, pages 107–117, Stroudsburg, PA,
USA. Association for Computational Linguistics. Robert Dale and George Narroway. 2012. A
frame-work for evaluating text correction. InLREC, pages 3015–3018.
Robert Dale, Ilya Anisimoff, and George Narroway. 2012. HOO 2012: A report on the preposition and determiner error correction shared task. In Proceed-ings of the Seventh Workshop on Building Educa-tional Applications Using NLP, pages 54–62. Asso-ciation for Computational Linguistics.
Rod Ellis. 2000. Task-based research and language
pedagogy. Language teaching research, 4(3):193–
220.
Keelan Evanini, Michael Heilman, Xinhao Wang, and Daniel Blanchard. 2014. Automated scoring for TOEFL Junior comprehensive writing and speaking. Technical report, ETS, Princeton, NJ.
Yansong Feng and Mirella Lapata. 2010a. How many words is a picture worth? Automatic caption genera-tion for news images. InProceedings of the 48th An-nual Meeting of the Association for Computational Linguistics, ACL ’10, pages 1239–1249, Strouds-burg, PA, USA. Association for Computational Lin-guistics.
Yansong Feng and Mirella Lapata. 2010b. Topic models for image annotation and text illustration. In Human Language Technologies: The 2010 An-nual Conference of the North American Chapter of the Association for Computational Linguistics, HLT ’10, pages 831–839, Stroudsburg, PA, USA. Associ-ation for ComputAssoci-ational Linguistics.
Michael Flor. 2013. A fast and flexible architecture for
very large word n-gram datasets. Natural Language
Engineering, 19(1):61–93.
KE Forbes-McKay and Annalena Venneri. 2005. De-tecting subtle spontaneous language decline in early Alzheimers disease with a picture description task.
Neurological sciences, 26(4):243–254.
Yoko Futagi, Paul Deane, Martin Chodorow, and Joel Tetreault. 2008. A computational approach to de-tecting collocation errors in the writing of non-native
speakers of English. Computer Assisted Language
Learning, 21(4):353–367.
Michael Gamon. 2010. Using mostly native data to correct errors in learners’ writing: A meta-classifier
approach. InHuman Language Technologies: The
2010 Annual Conference of the North American Chapter of the Association for Computational Lin-guistics, pages 163–171. Association for Computa-tional Linguistics.
Khairun-nisa Hassanali, Yang Liu, and Thamar Solorio. 2013. Using Latent Dirichlet Allocation for child narrative analysis. ACL 2013, page 111. Dhiraj Joshi, James Z. Wang, and Jia Li. 2006. The
story picturing engine—a system for automatic text
illustration.ACM Trans. Multimedia Comput.
Com-mun. Appl., 2(1):68–89, February.
Levi King and Markus Dickinson. 2013. Shallow se-mantic analysis of interactive learner sentences. In
Proceedings of the Eighth Workshop on Innovative Use of NLP for Building Educational Applications, pages 11–21, Atlanta, Georgia, June. Association for Computational Linguistics.
Girish Kulkarni, Visruth Premraj, Vicente Ordonez, Sagnik Dhar, Siming Li, Yejin Choi, Alexander C. Berg, and Tamara L. Berg. 2013. Babytalk: Under-standing and generating simple image descriptions.
Polina Kuznetsova, Vicente Ordonez, Alexander C Berg, Tamara L Berg, and Yejin Choi. 2012. Col-lective generation of natural image descriptions. In
Proceedings of the 50th Annual Meeting of the Association for Computational Linguistics: Long Papers-Volume 1, pages 359–368. Association for Computational Linguistics.
Ren´e Lawless, John Sabatini, and Paul Deane. 2012. Approaches to assessing partial vocabulary knowl-edge and supporting word learning: Assessing
vo-cabulary depth. In Annual Meeting of the
Ameri-can Educational Research Association, April 13-17, 2012, Vancouver, CA.
Joshua Lawrence, Elizabeth Pare-Blagoev, Ren´e Law-less, and Chen Deane, Paul andLi. 2012. Gen-eral vocabulary, academic vocabulary, and vocabu-lary depth: Examiningpredictors of adolescent
read-ing comprehension. InAnnual Meeting of the
Amer-ican Educational Research Association.
Claudia Leacock and Martin Chodorow. 2003. C-rater:
Automated scoring of short-answer questions.
Com-puters and the Humanities, 37(4):389–405.
Claudia Leacock, Martin Chodorow, Michael Gamon,
and Joel Tetreault. 2014. Automated Grammatical
Error Detection for Language Learners. Synthesis Lectures on Human Language Technologies. Mor-gan & Claypool.
Choonkyu Lee, Smaranda Muresan, and Karin Stromswold. 2012. Computational analysis of re-ferring expressions in narratives of picture books.
NAACL-HLT 2012, page 1.
Chee Wee Leong, Rada Mihalcea, and Samer Hassan. 2010. Text mining for automatic image tagging. In
Proceedings of the 23rd International Conference on Computational Linguistics: Posters, pages 647–655. Association for Computational Linguistics.
Siming Li, Girish Kulkarni, Tamara L Berg, Alexan-der C Berg, and Yejin Choi. 2011. Composing simple image descriptions using web-scale n-grams. InProceedings of the Fifteenth Conference on Com-putational Natural Language Learning, pages 220– 228. Association for Computational Linguistics.
Dekang Lin. 1998. Automatic retrieval and clustering of similar words. InProceedings of the 17th inter-national conference on Computational linguistics-Volume 2, pages 768–774. Association for Compu-tational Linguistics.
Xiaofei Lu. 2010. Automatic analysis of syntactic
complexity in second language writing.
Interna-tional Journal of Corpus Linguistics, 15(4).
Christopher D. Manning and Hinrich Sch¨utze. 1999.
Foundations of Statistical Natural Language Pro-cessing. MIT Press.
Detmar Meurers, Ramon Ziai, Niels Ott, and Stacey M Bailey. 2011. Integrating parallel analysis mod-ules to evaluate the meaning of answers to reading
comprehension questions. International Journal of
Continuing Engineering Education and Life Long Learning, 21(4):355–369.
Margaret Mitchell, Xufeng Han, Jesse Dodge, Alyssa Mensch, Amit Goyal, Alex Berg, Kota Yamaguchi, Tamara Berg, Karl Stratos, and Hal Daum´e III. 2012. Midge: Generating image descriptions from
computer vision detections. In Proceedings of the
13th Conference of the European Chapter of the As-sociation for Computational Linguistics, pages 747– 756. Association for Computational Linguistics. Cyrus Rashtchian, Peter Young, Micah Hodosh, and
Julia Hockenmaier. 2010. Collecting image
annota-tions using Amazon’s Mechanical Turk. In
Proceed-ings of the NAACL HLT 2010 Workshop on Creating Speech and Language Data with Amazon’s Mechan-ical Turk, pages 139–147. Association for Computa-tional Linguistics.
Jana Zuheir Sukkarieh and John Blackmore. 2009. C-rater: Automatic content scoring for short con-structed responses. InFLAIRS Conference.
Luis Von Ahn and Laura Dabbish. 2004. Labeling
images with a computer game. InProceedings of the
SIGCHI conference on Human factors in computing systems, pages 319–326. ACM.
Wei Xu, Joel Tetreault, Martin Chodorow, Ralph Gr-ishman, and Le Zhao. 2011. Exploiting syntactic and distributional information for spelling
correc-tion with web-scale n-gram models. InProceedings
of the Conference on Empirical Methods in Natu-ral Language Processing, pages 1291–1300. Asso-ciation for Computational Linguistics.
Benjamin Z Yao, Xiong Yang, Liang Lin, Mun Wai Lee, and Song-Chun Zhu. 2010. I2t: Image
pars-ing to text description. Proceedings of the IEEE,