R E S E A R C H
Open Access
A 10-second fluid challenge guided by
transthoracic echocardiography can predict
fluid responsiveness
Yunfan Wu
1, Shusheng Zhou
1, Zhihua Zhou
2and Bao Liu
1*Abstract
Introduction:The accurate assessment of intravascular volume status for the therapy of severe hypovolemia and shock is difficult and critical to critically ill patients. Non-invasive evaluation of fluid responsiveness by the rapid infusion of a very limited amount of volume is an important clinical goal. This study aimed to test whether echocardiographic parameters could predict fluid responsiveness in critically ill patients following a low-volume (50-ml crystalloid solution) infusion over 10 seconds.
Methods:We prospectively studied 55 mechanically ventilated patients. Echocardiography was performed during a 50-ml infusion of crystalloid solution over 10 seconds and a further 450 ml over 15 minutes. Cardiac output (CO), stroke volume (SV), aortic velocity time index (VTI), and left ventricular ejection fraction (LVEF) were recorded. Patients were classified as responders (Rs) if CO increased by at least 15% following the 500-ml volume expansion or were classified as non-responders (NRs) if CO increased by less than 15%. Area under the receiver operating characteristic curves (AUC) compared CO variations after 50 ml over 10 seconds (ΔCO50) and 500 ml over 15 minutes (ΔCO500) and the variation of VTI after infusion of 50 ml of fluid over 10 seconds (ΔVTI50).
Results:In total, 50 patients were enrolled, and 27 (54%) of them were Rs. General characteristics, LVEF, heart rate, and central venous pressure were similar between Rs and NRs. In the Rs group, the AUC forΔCO50 was 0.95 ± 0.03 (P<0.01; best cutoff value, 6%; sensitivity, 93%; specificity, 91%). Moreover,ΔCO50 andΔCO500 were strongly correlated (r= 0.87;P<0.01). The AUC forΔVTI50 was 0.91 ± 0.04 (P<0.01; best cutoff value, 9%; sensitivity, 74%; specificity, 95%).
ΔVTI50 andΔCO500 were positively correlated (r= 0.72;P<0.01).
Conclusion:In critically ill patients, the variation of CO and VTI after the administration of 50-ml crystalloid solution over 10 seconds (ΔCO50 andΔVTI50) can accurately predict fluid responsiveness.
Trial registration:Current Controlled Trials ISRCTN10524328. Registered 12 December 2013.
Introduction
Assessment of intravascular volume status is difficult in critically ill patients. Evidence suggests that only 50% of hemodynamically unstable patients respond to a fluid challenge [1,2]. Moreover, if cardiopulmonary function cannot compensate for the increase in preload, fluid loading may compromise microvascular perfusion and oxygen delivery and cause or aggravate peripheral and pulmonary edema [3,4]. Therefore, inappropriate fluid expansion can increase morbidity and mortality [5-7],
making it important to accurately assess fluid respon-siveness in critically ill patients [8,9].
Research has suggested that volume responsiveness can be defined as a 15% increase in stroke volume (SV) or car-diac output (CO) after a 500-ml infusion [10-12]. Over the last decade, multiple studies have demonstrated that static parameters have limited the predictive value for fluid respon-siveness. These include pulmonary artery occlusion pressure, right ventricular diastolic volume, left ventricular end-diastolic volume, central venous pressure (CVP), and inferior vena cava (IVC) diameter [2,13-15]. Furthermore, dynamic parameters have been extensively studied, leading to greater clinical use, including respiratory changes in aortic blood
* Correspondence:[email protected] 1
Department of Critical Care Medicine, Affiliated Provincial Hospital of Anhui Medical University, No. 17, Lujiang Road, Hefei 230001, Anhui Province, China Full list of author information is available at the end of the article
velocity, superior vena cava collapsibility, IVC collapsibility, and changes in SV and CO due to passive leg raising (PLR) [14,16-19]. In addition, many studies have demonstrated that echocardiography [2,16,18,20] offers a non-invasive, dynamic, and qualitative assessment of volume responsiveness in patients with hemodynamic failure, such as changes in the velocity time integral.
The novel, mini-fluid challenge technique proposed by Mulleret al.[21] demonstrated that a fluid challenge response can be evaluated by using small fluid volumes (100 ml of hydroxyethyl starch) over 1 minute. We hypothesized that a small fluid preload and faster infusion rate can also predict responsiveness. This study aimed to determine whether echo-cardiographic parameters following a 50-ml infusion of crystal-loid solution over 10 seconds can predict fluid responsiveness in critical ill patients with hypovolemic or septic shock.
Methods Patients
Mechanically ventilated adults admitted to the intensive care unit (ICU) with hypovolemic shock, severe sepsis, or septic shock were included from March to October 2013. All patients or their families signed consent forms to participate in this study. The medical ethics commit-tee of Anhui Provincial Hospital approved the protocol.
Patients were required to have at least one sign of inadequate tissue perfusion [22]: acute circulatory failure
defined as a systolic arterial pressure of 90 mm Hg (or a decrease of 40 mm Hg in a patient with hypertension), urine output of below 0.5 ml/kg per hour for over 1 hour, tachycardia (heart rate (HR) of greater than 100 beats per minute), and mottled skin. Clinical diseases were as-sociated with systemic inflammatory response syndrome, septic shock, and controlled massive hemorrhage. The attending physician clinically determined the need for volume expansion (VE). If patients were treated with norepinephrine, the dose remained unchanged from before VE until all hemodynamic measurements were complete. Exclusion criteria were the following: age of less than 18 years, moribund, cardiomyopathy, pulmo-nary edema, increased intracranial pressure, pregnancy, active bleeding, atrial fibrillation, cardiac arrhythmias, and myocardial ischemia or infarction within 1 month before the study.
Measurements
[image:2.595.57.539.427.704.2]Echocardiographic parameters were measured by using a bedside Philips IU22 xMATRIX ultrasound system (Royal Philips Electronics, Amsterdam, The Netherlands) with a 3- to 5-MHz phased-array probe. M-mode (time-motion) echocardiography was employed at the level of the aortic annulus in a two-dimensional view from the parasternal long-axis window (Figure 1). We measured the aortic diameter (D), left ventricular end-diastolic diameter, left
ventricular end-systolic diameter, and HR. Using the in-built software, we determined the left ventricular end-diastolic volume (LEDV) and left ventricular end-systolic volume (LESV). In addition, HR, blood pressure, CVP, and other hemodynamic parameters were recorded throughout the study. The following equations were used to calculate add-itional parameters: SV = [LEDV – LESV]; left ventricular ejection fraction (LVEF, %) = [(SV ÷ LEDV) × 100]; and CO = [SV × HR]. Aortic blood flow and velocity time inte-gral (VTI) were obtained from an apical five-chamber view.
Fluid responsiveness
A 50-ml bolus of crystalloid solution was given to the patient over 10 seconds through an intrathoracic central venous catheter. VTI was recorded during and immedi-ately after bolus administration. The remaining 450 ml of crystalloid solution was infused at a constant rate over 15 minutes, and the VTI was measured again. The mean echocardiographic measurements over three consecutive respiratory cycles were recorded, and parameters were analyzed by using frozen images from M-mode record-ings. Changes in parameters (HR, CVP, VTI, SV, and CO) were measured after the 50-ml infusion over 15 sec-onds and after the full 500 ml over 15 minutes; these
were referred to as Δ[parameter]50 and Δ[parameter]
500, respectively. Patients with an increase in CO after a
500-ml infusion over 15 minutes (ΔCO500) of 15% or
more were classified as responders (Rs), and those with-out an increase were classified as non-responders (NRs) [23]. An experienced ultrasound physician performed all echocardiographic collection, but all measurements were conducted by another physician, who was blinded to the clinical diagnosis.
Statistical analysis
[image:3.595.57.538.100.295.2]The SPSS 16.0 software (SPSS Inc., Chicago, IL, USA) was used for statistical analyses. Normality was tested by using the Shapiro-Wilk test, and comparisons of hemo-dynamic parameters between Rs and NRs were assessed
Table 1 Patient characteristics stratified by fluid responders and non-responders at baseline
Characteristics All participants (n = 50) Responders (n = 27) Non-responders (n = 23) Pvalue
General characteristics
Age, years 60 ± 17 61 ± 15 59 ± 18 0.50
APACHE II score 23 ± 4 24 ± 4 22 ± 4 0.10
Sex, male/female 34/16 19/8 15/8 0.70
Vital signs
HR, beats/mina 89 (68–100) 89 (68–116) 88 (64–95) 0.32
SBP, mm Hg 92 ± 21 86 ± 23 99 ± 16 0.04
CVP, mm Hga 5 (4–6) 5 (4–6) 5 (5–7) 0.40
Echocardiographic measurements
LVEF, % 61.1 ± 11.9 62.2 ± 13.8 60.0 ± 9.5 0.33
VTI, cm 30.9 ± 12.8 25.6 ± 13.8 37.1 ± 8.1 <0.01
SV, mla 78.8 (50.8-97.4) 66.7 (39.5-83.1) 83.1 (74.1-119.7) <0.01
CO, l/mina 8.2 (6.0-12.7) 7.2 (5.5-9.7) 9.7 (7.0-15.5) 0.05
Values are expressed as number (percentage) or as mean ± standard deviation. Percentages are rounded, so the total may not equal 100%.a
Values are expressed as median (interquartile range). APACHE, Acute Physiology and Chronic Health Evaluation; CO, cardiac output; CVP, central venous pressure; HR, heart rate; LVEF, left ventricular ejection fraction; SBP, systolic blood pressure; SV, stroke volume; VTI, aortic velocity time index.
Table 2 Hemodynamic variables were measured at baseline, during volume expansion
Baseline 50 ml VE 500 ml VE Pvalue HR, beats/min
Responders 92 ± 28 91 ± 26 87 ± 27 <0.01
Non-responders 83 ± 17 83 ± 18 79 ± 17 <0.01
SBP, mm Hg
Responders 86 ± 23 87 ± 22 96 ± 21 <0.01
Non-responders 99 ± 16 102 ± 17 105 ± 19 <0.01
LVEF, %
Responders 62.2 ± 13.8 63.6 ± 11.6 64.5 ± 11.5 0.12
Non-responders 60.0 ± 9.5 62.4 ± 10.8 63.0 ± 7.7 0.06
VTI, cm
Responders 25.6 ± 13.8 28.7 ± 15.2 34.4 ± 17.7 <0.01
Non-responders 37.1 ± 8.1 38.2 ± 8.5 40.7 ± 9.0 <0.01
SV, ml
Responders 65.6 ± 26.0 76.1 ± 29.4 93.8 ± 39.4 <0.01
Non-responders 93.3 ± 26.7 97.1 ± 27.6 101.7 ± 28.8 <0.01
CO, l/min
Responders 8.4 ± 4.0 9.3 ± 4.2 10.7 ± 4.5 <0.01
Non-responders 10.7 ± 4.3 10.9 ± 4.4 11.3 ± 4.5 <0.01
[image:3.595.304.539.434.698.2]by using the Mann–WhitneyU test. The Friedman test and Wilcoxon rank-sum test were used to detect changes over time (baseline, after 50 ml, and after 500 ml) within the same group. Linear correlations were tested by using the Spearman rank correlation and Pearson tests for non-normal and non-normal distributions, respectively. Receiver operating characteristic (ROC) curves were constructed to evaluate the ability of each parameter to predict fluid responsiveness after VE by varying the discriminating threshold of each measurement. The area under each ROC curve (AUC) was calculated and expressed as AUC ± stan-dard deviation (SD). Cutoff values were chosen with the highest Youden index, calculated as [1−(1−sensitivity) -(1−specificity)]. Probability (P) values of less than 0.05 were considered statistically significant. Data are presented as mean ± SD if normally distributed or as median (inter-quartile range) if not normally distributed.
Results
In total, 55 patients were included; 5 patients were excluded because adequate images could not be obtained.
Table 1 summarizes the characteristics of the 50 patients with a comparison between Rs (n = 27) and NRs (n = 23). Diagnoses were severe sepsis or septic shock (n = 36), severe trauma (n = 10), gastrointestinal bleeding (n = 3), and dehydration (n = 1). At baseline, general charac-teristics, HR (P= 0.32), LVEF (P= 0.33), and CVP (P= 0.40) were similar between the two groups. Significant differences in the following were predictive of fluid responsiveness: systolic blood pressure (SBP), VTI, SV, and CO. The last three parameters were clearly lower among Rs than NRs at baseline.
Table 2 shows that the hemodynamic parameters are significantly different between the Rs and NRs groups after 50 and 500 ml VE (including HR, SBP, VTI, SV, and CO). The Wilcoxon rank-sum test for hemodynamic parameters at baseline, post-50 ml, and post-500 ml VE was statistically significant, excluding HR between the
baseline and after 50 ml VE in Rs (P= 0.41) and NRs
[image:4.595.57.540.89.228.2](P= 0.18).
[image:4.595.57.540.535.685.2]Figure 2 shows that individual changes in CO and VTI produced by VE at baseline, 10 seconds, and 15 minutes
Figure 2Individual values for cardiac output (CO) (A) and aortic velocity time index (VTI) (B) at baseline, 10 seconds, and 15 minutes in responders and non-responders.
Figure 3(A) Correlation betweenΔVTI50 (%) andΔVTI500 (%). (B)Correlation betweenΔCO50 (%) andΔCO500 (%).ΔCO50, variation of cardiac output after infusion of 50 ml of fluid over 10 seconds;ΔCO500, variation of cardiac output after infusion of 500 ml fluid over 15 minutes;
in the two groups. Correlations were tested by using the Spearman rank correlation (Figure 3). In all patients,
ΔVTI50 was positively and significantly correlated with
ΔVTI500 (r= 0.83;P<0.01) (Figure 3A). Similarly,ΔSV50
strongly and significantly correlated with ΔSV500, as
did ΔCO50 andΔCO500 (r= 0.90;P <0.01) (Figure 3B).
Moreover, ΔVTI50 and ΔCO500 were positively
corre-lated (r= 0.72;P<0.01). The Bland-Altman plot presenting
[image:5.595.60.540.90.239.2]differences between ΔCO50 and ΔCO500 is given in
Figure 4A. The bias was 12%. The 95% limits of agreement
(LOAs) were (−11%, 36%). Figure 4B shows the
Bland-Altman plots of the difference in ΔVTI50 versus
ΔVTI500. The bias was 15%. The 95% LOAs were
(−8%, 38%).
As shown in Figure 5, the AUCs for ΔVTI50,ΔSV50,
and ΔCO50 suggest that all accurately predicted fluid
responsiveness after infusion of 50-ml VE over 10
sec-onds. The AUCs for ΔVTI50, ΔSV50, and ΔCO50
were 0.91 ± 0.04 (P <0.01), 0.96 ± 0.03 (P <0.01), and 0.95 ± 0.03 (P <0.01), respectively. The AUCs for VTI, SV, and CO at baseline had lower accuracy for
pre-dicting fluid responsiveness compared with ΔVTI50
and ΔCO50.
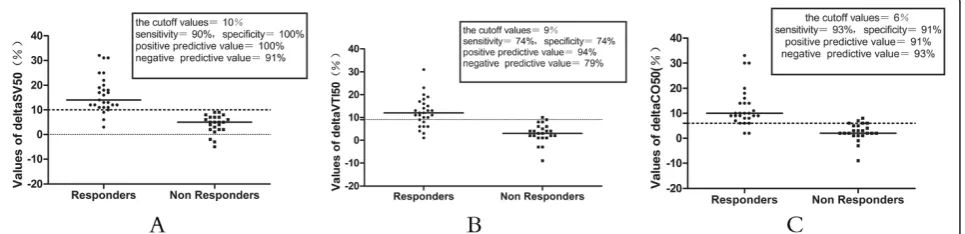
Table 3 and Figure 6 showed that, for ΔVTI50 after
infusion of 50-ml VE over 10 seconds, the optimum cutoff value was 9% (sensitivity, 74%; specificity, 95%). The best AUC cutoff values when predicting fluid
responsiveness were 10% for ΔSV50 (sensitivity, 90%;
specificity, 100%) and 6% for ΔCO50 (sensitivity, 93%;
specificity, 91%), respectively. After 500-ml VE, the best cutoff value was 19% for ΔVTI500 (sensitivity, 89%; specificity, 100%).
Discussion
Fluid resuscitation is the cornerstone of hypovolemic shock, severe sepsis, or septic shock patient management.
However, when patients are on the relatively flat part of the Frank-Starling curve, preload VE can be deleterious. Consequently, monitoring volume responsiveness has become increasingly important in the ICU.
[image:5.595.305.540.461.634.2]Pleural pressure, intra-abdominal pressures, me-chanical ventilation, capillary permeability, and other factors can influence CVP to predict fluid responsive-ness. Previous studies [13,14,24,25] have demonstrated that baseline CVP has a poor ability of predicting fluid responsiveness in critically ill patients. Our study also demonstrated that the initial CVP was not different be-tween the two groups and the AUC for initial CVP was
Figure 4Bland and Altman diagram between variation of cardiac output (A) and variation of velocity time index (B) after 50- or 500-ml volume expansion.ΔCO50, variation of cardiac output after infusion of 50 ml of fluid over 10 seconds.ΔCO500, variation of cardiac output after infusion of 500 ml of fluid over 15 minutes;ΔVTI50, variation of velocity time index after infusion of 50 ml of fluid over 10 seconds.
ΔVTI500, variation of velocity time index after infusion of 500 ml of fluid over 15 minutes; CO, cardiac output; VTI, aortic velocity time index.
Figure 5Receiver operator characteristic (ROC) curves for
low. Moreover, consistent with earlier research [25], the present study found that baseline HR was inadequate for predicting fluid responsiveness. Interestingly, there was
no statistically significant for HR between baseline
and after 50-ml VE in Rs (P= 0.41) and NRs (P= 0.18).
This means that crystalloid distributed rapidly
through the extracellular compartment, which did not affect sympathetic stimulation or cardiac re-flexes. Our study suggested that there was a
signifi-cant difference in SBP between Rs and NRs.
However, the literature suggests that SBP does not reliably predict a patient’s response to fluid adminis-tration, which was affected by drugs, stress, pain, fever, anemia, intrinsic heart disease, and many other factors [26].
Recently, dynamic echocardiographic parameters
ΔSV, ΔCO, and ΔVTI induced by VE or PLR have
gained increased attention; moreover, VE and PLR can reliably predict fluid responsiveness regardless of the ventilation mode or underlying cardiac rhythm in the majority of ICU patients [18,27-30]. However, PLR is susceptible to the effects of increased intra-abdominal pressure and cannot be used in patients with fracture or following surgery [31,32]. Because of such limita-tions, a more secure and convenient method of predict-ing fluid response is required to reduce unnecessary
medical intervention. In echocardiography, SV was also
determined as VTI × [π (D2) ÷ 4]. With D being
con-stant in a given patient, VTI and SV changes are expected to be equal. Over the past decade, a number
of reports have correlated ΔVTI with fluid
responsive-ness [18,29,33-35]. In our study, the ΔVTI500 (AUC,
0.95 ± 0.03) had a high accuracy for predicting fluid responsiveness.
As demonstrated by the Frank-Starling curve, the be-ginning of the fluid challenge induces a more signifi-cant increase in stroke volume on the steep portion of the curve because of a preload reserve in the left ven-tricular function. Mulleret al. [21] proposed the mini-fluid challenge technique and demonstrated that a mini-fluid challenge response can be evaluated by using small fluid volumes. Inspired by this, we hypothesized that a 50-ml infusion of crystalloid over 10 seconds could predict fluid responsiveness. Although this fluid regime was arbitrarily chosen, it was based on the peak increase in intravascular volume with lactated crystalloid solution occurring immediately after completion of the rapid fluid infusion [36,37] and the low clinical risk of crystalloid solution [22,38].
In the present study, the relatively high correlation
coefficient between ΔVTI50 andΔVTI500 was r= 0.83
[image:6.595.56.537.100.183.2](P <0.01) and the correlation between ΔCO50 and
Table 3 Accuracy of echocardiographic parameters for predicting fluid responsiveness
AUC Cutoff values Sensitivity Specificity Positive predictive value Negative predictive value
ΔVTI50 0.91 ± 0.04 9% 74% 95% 94% 79%
ΔVTI500 0.95 ± 0.03 19% 89% 100% 100% 90%
ΔCO50 0.95 ± 0.03 6% 93% 91% 91% 93%
ΔSV50 0.96 ± 0.03 10% 90% 100% 100% 91%
ΔSV500 1.00 15% 100% 100% 100% 100%
ΔCO50, variation of cardiac output after infusion of 50 ml of fluid over 10 seconds;ΔSV50, variation of stroke volume after infusion of 50 ml of fluid over 10 seconds;ΔSV500, variation of stroke volume after infusion of 500 ml fluid over 15 minutes;ΔVTI50, variation of velocity time index after infusion of 50 ml of fluid over 10 seconds;ΔVTI500, variation of velocity time index after infusion of 500 ml of fluid over 15 minutes; AUC, area under the receiver operating characteristic curves.
[image:6.595.58.541.558.675.2]ΔCO500 wasr= 0.90 (P <0.01), respectively. Moreover, Bland-Altman-like analysis of the same data indicated that there was a good concordance for two measure-ments. This was associated with a trend that a higher VE can lead to a higher change of CO.
The ROC analysis of echocardiographic parameters revealed that a response to 50-ml crystalloid bolus over 10 seconds enables accurate prediction of fluid
respon-siveness, particularly ΔVTI50 and ΔCO50. The AUCs
for these echocardiographic parameters were above 0.90.
The best AUC cutoff for ΔCO50 when predicting fluid
responsiveness was 6% (sensitivity, 93%; specificity, 91%), suggesting that a mini-fluid challenge of 50-ml crystalloid bolus over 10 seconds enables accurate
bed-side prediction of a 15% increase in ΔCO500 in 27
adults. In Figure 5, we also proved that these dynamic echocardiographic indices after 50-ml VE had greater predictive value for fluid responsiveness than static echocardiographic indices (i.e., those measured at base-line). Above all, our data support the hypothesis that the response to a mini-fluid challenge can predict responsiveness to a larger challenge. This means that a low fluid volume can be used to predict responsiveness and decrease the deleterious effect of an unnecessary
fluid infusion in NRs. In our study, ΔCO50 had
higher statistical accuracy than ΔVTI50. However,
echocardiography measured VTI only with pulsed Doppler from the apical five-chamber view, which means that VTI was quicker and easier to perform
than CO. Multiple studies have considered that ΔVTI
can accurately and sensitively predict fluid responsive-ness [18,29,33,35,39].
This present study has several limitations. First, the patient sample was small and may limit the external validity. Second, because our study excluded patients with cardiac arrhythmias, we do not know its appli-cability in this setting. Third, transthoracic echocardi-ography has many specific limitations: It is technically demanding, and many ICUs may lack suitably skilled operators. The sharpness of ultrasound images will be affected by obesity, chest deformity, high abdominal pressure, patient positioning, and other factors. Fourth, we did not assess the impact of measuring time. This assessment deserves further studies.
Conclusions
In contrast to the study by Muller et al. [21], the
present research had shown that even small fluid chal-lenges over shorter periods can be sufficient in predict-ing fluid responsiveness among critically ill patients. In conclusion, we believe our study provides new insights into effective prediction of fluid responsiveness by
ΔCO50 and ΔVTI50 after 50-ml crystal solution over
10 seconds.
Key messages
Echocardiography offers a convenient, non-invasive, dynamic, and qualitative assessment of volume responsiveness in the ICU.
By using a smaller fluid volume and faster infusion rate than ever before, the study wanted to find a relatively accurate and sensitive fluid challenge technique with more decrease morbidity and mortality.
The variation of CO and VTI measured by transthoracic echocardiography after the administration of 50-ml crystalloid solution over 10 seconds is able to reliably predict fluid responsiveness among critically ill patients.
Despite a lower sensitivity and several limitations, the mini-fluid challenge technique may provide a new research perspective for effective and rapid prediction of fluid responsiveness in the future.
Abbreviations
Δ:Delta;ΔCO50: variation of cardiac output after infusion of 50 ml of fluid over 10 seconds;ΔCO500: variation of cardiac output after infusion of 500 ml of fluid over 15 minutes;ΔSV50: variation of stroke volume after infusion of 50 ml of fluid over 10 seconds;ΔSV500: variation of stroke volume after infusion of 500 ml of fluid over 15 minutes;ΔVTI50: variation of velocity time index after infusion of 50 ml of fluid over 10 seconds;ΔVTI500: variation of velocity time index after infusion of 500 ml of fluid over 15 minutes; AUC: area under the receiver operating characteristic curves; CO: cardiac output; CVP: central venous pressure; D: aortic diameter; HR: heart rate; ICU: intensive care unit; IVC: inferior vena cava; LEDV: left ventricular end-diastolic volume; LESV: left ventricular end-systolic volume; LOA: limit of agreement; LVEF: left ventricular ejection fraction; NR: non-responder; PLR: passive leg raising; R: responder; ROC: receiver operating characteristic; SBP: systolic blood pressure; SD: standard deviation; SV: stroke volume; VE: volume expansion; VTI: aortic velocity time index.
Competing interests
The authors declare that they have no competing interests.
Authors’contributions
YW performed the data collection and drafted the manuscript. ZZ performed the statistical analysis and assisted in the drafting of the manuscript. SZ and BL conceived of the study, participated in its design, and coordinated the study. All authors read, revised, and approved the final manuscript.
Authors’information
YW, SZ and BL work at the Department of Critical Care Medicine, Affiliated Provincial Hospital of Anhui Medical University. ZZ works at the Department of Critical Care Medicine, Affiliated Hospital of Neurology Institute, Anhui University of Traditional Chinese Medicine.
Acknowledgments
We thank the patients for their participation in the study and the medical and nurse staff for their collaboration in the realization of this work.
Author details
1
Department of Critical Care Medicine, Affiliated Provincial Hospital of Anhui Medical University, No. 17, Lujiang Road, Hefei 230001, Anhui Province, China.2Department of Critical Care Medicine, Affiliated Hospital of Neurology Institute, Anhui University of Traditional Chinese Medicine, No. 357, Yangtze river middle road, Hefei 230061, Anhui Province, China.
References
1. Marik PE, Cavallazzi R, Vasu T, Hirani A:Dynamic changes in arterial waveform derived variables and fluid responsiveness in mechanically ventilated patients: a systematic review of the literature.Crit Care Med 2009,37:2642–2647.
2. Levitov A, Marik PE:Echocardiographic assessment of preload
responsiveness in critically ill patients.Cardiol Res Pract2012,2012:819696. 3. Cordemans C, De Laet I, Van Regenmortel N, Schoonheydt K, Dits H, Huber
W, Malbrain ML:Fluid management in critically ill patients: the role of extravascular lung water, abdominal hypertension, capillary leak, and fluid balance.Ann Intensive Care2012,2:S1.
4. Rivers EP, Jaehne AK, Eichhorn-Wharry L, Brown S, Amponsah D: Fluid therapy in septic shock.Curr Opin Crit Care2010,16:297–308. 5. Boyd JH, Forbes J, Nakada TA, Walley KR, Russell JA:Fluid resuscitation in
septic shock: a positive fluid balance and elevated central venous pressure are associated with increased mortality.Crit Care Med2011, 39:259–265.
6. Wiesenack C, Fiegl C, Keyser A, Prasser C, Keyl C:Assessment of fluid responsiveness in mechanically ventilated cardiac surgical patients. Eur J Anaesthesiol2005,22:658–665.
7. Machare-Delgado E, Decaro M, Marik PE:Inferior vena cava variation compared to pulse contour analysis as predictors of fluid
responsiveness: a prospective cohort study.J Intensive Care Med2011, 26:116–124.
8. Smith SH, Perner A:Higher vs. lower fluid volume for septic shock: clinical characteristics and outcome in unselected patients in a prospective, multicenter cohort.Crit Care2012,16:R76.
9. Bayer O, Reinhart K, Kohl M, Kabisch B, Marshall J, Sakr Y, Bauer M, Hartog C, Schwarzkopf D, Riedemann N:Effects of fluid resuscitation with synthetic colloids or crystalloids alone on shock reversal, fluid balance, and patient outcomes in patients with severe sepsis: a prospective sequential analysis.Crit Care Med2012,40:2543–2551.
10. Critchley LA, Lee A, Ho AM:A critical review of the ability of continuous cardiac output monitors to measure trends in cardiac output. Anesth Analg2010,111:1180–1192.
11. Thiel SW, Kollef MH, Isakow W:Non-invasive stroke volume measurement and passive leg raising predict volume responsiveness in medical ICU patients: an observational cohort study.Crit Care2009,13:R111. 12. Guinot PG, Zogheib E, Detave M, Moubarak M, Hubert V, Badoux L,
Bernard E, Besserve P, Caus T, Dupont H:Passive leg raising can predict fluid responsiveness in patients placed on venovenous extracorporeal membrane oxygenation.Crit Care2011,15:R216.
13. Marik PE, Cavallazzi R:Does the central venous pressure predict fluid responsiveness? An updated meta-analysis and a plea for some common sense.Crit Care Med2013,41:1774–1781.
14. Cavallaro F, Sandroni C, Antonelli M:Functional hemodynamic monitoring and dynamic indices of fluid responsiveness.Minerva Anestesiol2008, 74:123–135.
15. Shujaat A, Bajwa AA:Optimization of preload in severe sepsis and septic shock.Crit Care Res Pract2012,2012:761051.
16. Mandeville JC, Colebourn CL:Can transthoracic echocardiography be used to predict fluid responsiveness in the critically ill patient? A systematic review.Crit Care Res Pract2012,2012:513480.
17. Prekker ME, Scott NL, Hart D, Sprenkle MD, Leatherman JW:Point-of-care ultrasound to estimate central venous pressure: a comparison of three techniques.Crit Care Med2013,41:833–841.
18. Brun C, Zieleskiewicz L, Textoris J, Muller L, Bellefleur JP, Antonini F, Tourret M, Ortega D, Vellin A, Lefrant JY, Boubli L, Bretelle F, Martin C, Leone M: Prediction of fluid responsiveness in severe preeclamptic patients with oliguria.Intens Care Med2013,39:593–600.
19. Choi DY, Kwak HJ, Park HY, Kim YB, Choi CH, Lee JY:Respiratory variation in aortic blood flow velocity as a predictor of fluid responsiveness in children after repair of ventricular septal defect.Pediatr Cardiol2010, 31:1166–1170.
20. Dinh VA, Ko HS, Rao R, Bansal RC, Smith DD, Kim TE, Nguyen HB:Measuring cardiac index with a focused cardiac ultrasound examination in the ED. Am J Emerg Med2012,30:1845–1851.
21. Muller L, Toumi M, Bousquet PJ, Riu-Poulenc B, Louart G, Candela D, Zoric L, Suehs C, de La Coussaye JE, Molinari N, Lefrant JY:An increase in aortic blood flow after an infusion of 100 ml colloid over 1 minute can predict
fluid responsiveness: the mini-fluid challenge study.Anesthesiology2011, 115:541–547.
22. Dellinger RP, Levy MM, Rhodes A, Annane D, Gerlach H, Opal SM, Sevransky JE, Sprung CL, Douglas IS, Jaeschke R, Osborn TM, Nunnally ME, Townsend SR, Reinhart K, Kleinpell RM, Angus DC, Deutschman CS, Machado FR, Rubenfeld GD, Webb SA, Beale RJ, Vincent JL, Moreno R, Surviving Sepsis Campaign Guidelines Committee including the Pediatric S:Surviving sepsis campaign: international guidelines for management of severe sepsis and septic shock: 2012.Crit Care Med2013,41:580–637.
23. Monnet X, Teboul JL:Volume responsiveness.Curr Opin Crit Care2007, 13:549–553.
24. Cecconi M, Parsons AK, Rhodes A:What is a fluid challenge?Curr Opin Crit Care2011,17:290–295.
25. Cecconi M, Monti G, Hamilton MA, Puntis M, Dawson D, Tuccillo ML, Della Rocca G, Grounds RM, Rhodes A:Efficacy of functional
hemodynamic parameters in predicting fluid responsiveness with pulse power analysis in surgical patients.Minerva Anestesiol2012,78:527–533. 26. Vincent JL, Weil MH:Fluid challenge revisited.Crit Care Med2006,
34:1333–1337.
27. Cavallaro F, Sandroni C, Marano C, La Torre G, Mannocci A, De Waure C, Bello G, Maviglia R, Antonelli M:Diagnostic accuracy of passive leg raising for prediction of fluid responsiveness in adults: systematic review and meta-analysis of clinical studies.Intensive Care Med2010,36:1475–1483. 28. Preau S, Dewavrin F, Soland V, Bortolotti P, Colling D, Chagnon JL,
Durocher A, Saulnier F:Hemodynamic changes during a deep inspiration maneuver predict fluid responsiveness in spontaneously breathing patients.Cardiol Res Pract2012,2012:191807.
29. Lukito V, Djer MM, Pudjiadi AH, Munasir Z:The role of passive leg raising to predict fluid responsiveness in pediatric intensive care unit patients. Pediatr Crit Care Med2012,13:e155–160.
30. Teboul JL, Monnet X:Prediction of volume responsiveness in critically ill patients with spontaneous breathing activity.Curr Opin Crit Care2008, 14:334–339.
31. Mahjoub Y, Touzeau J, Airapetian N, Lorne E, Hijazi M, Zogheib E, Tinturier F, Slama M, Dupont H:The passive leg-raising maneuver cannot accurately predict fluid responsiveness in patients with intra-abdominal hypertension. Crit Care Med2010,38:1824–1829.
32. Monnet X, Teboul JL:Passive leg raising.Intensive Care Med2008, 34:659–663.
33. Broch O, Renner J, Gruenewald M, Meybohm P, Hocker J, Schottler J, Steinfath M, Bein B:Variation of left ventricular outflow tract velocity and global end-diastolic volume index reliably predict fluid responsiveness in cardiac surgery patients.J Crit Care2012,27:325. e327-313.
34. Skulec R, Cermak O, Skalicka H, Kolar J:Variability of aortic blood flow predicts fluid responsiveness in spontaneously breathing healthy volunteers.Kardiol Pol2009,67:265–271.
35. Feissel M, Teboul JL, Merlani P, Badie J, Faller JP, Bendjelid K:
Plethysmographic dynamic indices predict fluid responsiveness in septic ventilated patients.Intens Care Med2007,33:993–999.
36. McIlroy DR, Kharasch ED:Acute intravascular volume expansion with rapidly administered crystalloid or colloid in the setting of moderate hypovolemia.Anesth Analg2003,96:1572–1577.
37. Verheij J, van Lingen A, Beishuizen A, Christiaans HM, de Jong JR, Girbes AR, Wisselink W, Rauwerda JA, Huybregts MA, Groeneveld AB:Cardiac response is greater for colloid than saline fluid loading after cardiac or vascular surgery.Intensive Care Med2006,32:1030–1038.
38. Perel P, Roberts I, Ker K:Colloids versus crystalloids for fluid resuscitation in critically ill patients.Cochrane Database Syst Rev2013,2:CD000567. 39. Slama M, Masson H, Teboul JL, Arnout ML, Susic D, Frohlich E, Andrejak M:
Respiratory variations of aortic VTI: a new index of hypovolemia and fluid responsiveness.Am J Physiol Heart Circ Physiol2002,283:H1729–1733.
doi:10.1186/cc13891