On the Contribution of Discourse Structure
on Text Complexity Assessment
Elnaz Davoodi Concordia University Department of Computer Science
and Software Engineering Montr´eal, Qu´ebec, Canada H3G 2W1
Leila Kosseim Concordia University Department of Computer Science
and Software Engineering Montr´eal, Qu´ebec, Canada H3G 2W1
Abstract
This paper investigates the influence of discourse features on text complexity as-sessment. To do so, we created two data sets based on the Penn Discourse Treebank and the Simple English Wikipedia cor-pora and compared the influence of coher-ence, cohesion, surface, lexical and syn-tactic features to assess text complexity. Results show that with both data sets co-herence features are more correlated to text complexity than the other types of fea-tures. In addition, feature selection re-vealed that with both data sets the top most discriminating feature is a coherence fea-ture.
1 Introduction
Measuring text complexity is a crucial step in au-tomatic text simplification where various aspects of a text need to be simplified in order to make it more accessible (Siddharthan, 2014). Despite much research on identifying and resolving lexical and syntactic complexity (e.g. Kauchak (2013), Rello et al. (2013), Bott et al. (2012), Carroll et al. (1998), Barlacchi and Tonelli (2013), ˇStajner et al. (2013)), discourse-level complexity remain under-studied (Siddharthan, 2006; Siddharthan, 2003). Current approaches to text complexity assessment consider a text as a bag of words or a bag of syn-tactic constituents; which is not powerful enough to take into account deeper textual aspects such as flow of ideas, inconsistencies, etc. that can influ-ence text complexity.
For example, according to Williams et al. (2003), Example 1.a below is more complex than Example 1.b even though both sentences use ex-actly the same nouns and verbs.
Example 1.a.Although many people find speed
reading hard, if you practice reading, your skills will improve.
Example 1.b. Many people find speed reading hard. But your skills will improve if you practice reading.
Apart from the choice of words or the way these words form syntactically sound constituents, the way these constituents are linked to each other can influence its complexity. In other words, discourse information plays an important role in text com-plexity assessment.
The goal of this paper is to analyse the influ-ence of discourse-level features for the task of au-tomatic text complexity assessment and compare their influence to more traditional linguistic and surface features used for this task.
2 Background
A reader may find a text easy to read, cohesive, coherent, grammatically and lexically sound or on the other hand may find it complex, hard to follow, grammatically heavy or full of uncommon words. Focusing only on textual characteristics and ig-noring the influence of the readers, Siddharthan (2014) definestext complexityas a metric to mea-sure linguistic complexities at different levels of analysis: 1) lexical (e.g. the use of less frequent, uncommon and even obsolete words), 2) syntac-tic (e.g. the extortionate or improper use of pas-sive sentences and embedded clauses), and 3) dis-course (e.g. vague or weak connections between text segments).
Text complexity should be distinguished from
text readability. Whereas text complexity is independent, text readability is reader-centric. According to Dale and Chall (1949), the readability of a text is defined by its complexity as well as characteristics of the readers, such as their background, education, expertise, level of
terest in the material and external elements such as typographical features (e.g. text font size, high-lights, etc.). It is crucial that a reader have access to a text with the appropriate readability level (e.g. Collins-Thompson (2014), Williams et al. (2003)). An article which would be perceived as easy to read by a more educated or an expert reader may be hard to follow for a reader with a lower educa-tional level.
Traditionally, the level of complexity of a text has mostly been correlated with surface features such as word length (the number of characters or number of syllables per word) or sentence length. One of the most well-known readability indexes, the Flesch-Kincaid index (Kincaid et al., 1975), measures a text’s complexity level and maps it to an educational level. Traditional complexity mea-sures (e.g. (Chall, 1958; Klare and others, 1963; Zakaluk and Samuels, 1988)) mostly consider a text as a bag of words or bag of sentences and rely on the complexity of a text’s building blocks (e.g. words or phrases). This perspective does not take discourse properties into account. Web-ber and Joshi (2012) define discourse using fours aspects:position of constitutes,order,contextand
adjacency. Such discourse information plays an important role in text complexity assessment. Tra-ditional methods do not consider the flow of in-formation in terms of word ordering, phrase adja-cency and connection between text segments; all of which can make a text hard to follow, non-coherent and more complex.
More recently, some efforts have been made to improve text complexity assessment by con-sidering richer linguistic features. For example, Schwarm and Ostendorf (2005) and Callan and Eskenazi (2007) used language models to predict readability level by using different language mod-els (e.g. a language model for children using chil-dren’s book, a language model for more advanced readers using scientific papers, etc.).
Discourse features can refer to text cohesion and coherence. Text cohesion refers to the gram-matical and lexical links which connect linguis-tic entities together; whereas text coherence refers to the connection between ideas. Several the-ories have been developed to model both cohe-sion (e.g. centering theory (Grosz et al., 1995)) and coherence (e.g. Rhetorical Structure Theory (Mann and Thompson, 1987), DLTAG (Webber, 2004)). Pitler and Nenkova (2008) examined a set
of cohesion features based on an entity-based ap-proach (Barzilay and Lapata, 2008) and pointed out that these features were not significantly cor-related with text complexity level. However to our knowledge, the influence of coherence on text complexity has not been studied.
3 Complexity Assessment Model
The goal of this study is to evaluate the influ-ence of coherinflu-ence features for text complexity as-sessment. To do so, we have considered various classes of linguistic features and build a pairwise classification model to compare the complexity of pairs of texts using each class of feature. For ex-ample, given the pair of sentences of Example 1.a and 1.b (see Section 1), the classifier will indicate if 1.a is simpler or more complex than 1.b.
3.1 Data Sets
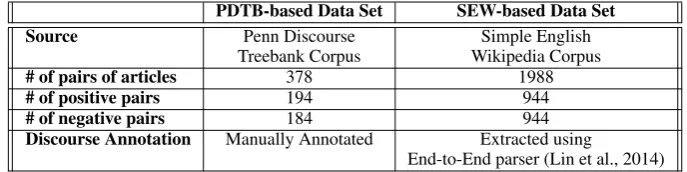
To perform the experiments, we created two differ-ent data sets using standard corpora. The first data set was created from the Penn Discourse Treebank (PDTB) (Prasad et al., 2008); while, the other was created from the Simple English Wikipedia (SEW) corpus (Coster and Kauchak, 2011). These two data sets are described below and summarized in Table 1.
3.1.1 The PDTB-based Data Set
Since we aimed to analyze the contribution of dif-ferent features, we needed a corpus with difdif-ferent complexity levels where features were already an-notated or could automatically be tagged. Surface, lexical, syntactic and cohesion features can be easily extracted; however, coherence features are more difficult to extract. Standard resources typ-ically used in computational complexity analysis such as the Simple English Wikipedia (Coster and Kauchak, 2011), Common Core Appendix B1and Weebit (Vajjala and Meurers, 2012) are not anno-tated with coherence information; hence these fea-tures would have to be induced automatically us-ing a discourse parser (e.g. Lin et al. (2014), Laali et al. (2015)).
In order to have better quality discourse annota-tions, we used the data set generated by Pitler and Nenkova (2009). This data set contains 30 articles from the PDTB (Prasad et al., 2008) which are annotated manually with both complexity level and discourse information. The complexity level
PDTB-based Data Set SEW-based Data Set Source Penn Discourse Simple English
Treebank Corpus Wikipedia Corpus
# of pairs of articles 378 1988
# of positive pairs 194 944
# of negative pairs 184 944
Discourse Annotation Manually Annotated Extracted using
[image:3.595.126.470.62.148.2]End-to-End parser (Lin et al., 2014) Table 1:Summary of the two data sets.
of the articles is indicated on a scale of 1.0 (easy) to 5.0 (difficult). Using this set of articles, we built a data set containing pairs of articles whose complexity levels differed by least n points. In order to have a balanced data set, we setn= 0.7. As a result, our data set consists of 378 instances with 194 positive instances (i.e. same complexity level where the difference between the complexity scores is smaller or equal to 0.7) and 184 negative instances (i.e. different complexity levels where the difference between complexity scores is larger than 0.7). Then, each pair of articles is represented as a feature vector where the value of each feature is the difference between the values of the corresponding feature in each article. For example, for a given pair of articles< a1, a2 >, the corresponding feature vector will be:
Va1,a2=< F1a1−F1a2, F2a1−F2a2, ..., Fna1−Fna2>
where Va1,a2 represents the feature vector of a
given pair of articles< a1, a2>,Fia1corresponds
to the value of the ith feature for article a1 and
Fia2 corresponds to the value of theithfeature for
articlea2andnis the total number of features (in our casen= 14(see Section 3.2)).
Because the Pitler and Nenkova (2009) data set is a subset of the PDTB, it is also annotated with discourse structure. The annotation work of the PDTB is based on the DLTAG frame-work (Webber, 2004). In this frameframe-work, 100 dis-course markers (e.g. because, since, although, etc.) are treated as predicates that take two guments: Arg1 and Arg2, where Arg2 is the ar-gument that contains the discourse marker. The PDTB annotates both explicit and implicit dis-course relations. Explicit relations are explicitly signalled with a discourse marker. On the other hand implicit relations do not use an explicit dis-course marker; however the reader still can infer the relation connecting the arguments. Example 2.a taken from Prasad et al. (2008) shows an ex-plicit relation which is changed to an imex-plicit one
in Example 2.b by removing the discourse marker
because.
Example 2.a. If the light is red, stop because otherwise you will get a ticket.
Example 2.b. If the light is red, stop. Other-wise you will get a ticket.
In addition to labeling discourse relation real-izations (i.e. explicit or implicit) and discourse markers (e.g.because,since, etc.), the PDTB also annotates the sense of each relation using three levels of granularity. At the top level, four classes of senses are used: TEMPORAL, CONTINGENCY, COMPARISONand EXPANSION. Each class is ex-panded into 16 second level senses; themselves subdivided into 23 third-level senses. In our work, we considered the 16 relations at the second-level of the PDTB relation inventory2.
3.1.2 The SEW-based Data Set
In order to validate our results, we created a larger data set but this time with induced discourse infor-mation. To do so, a subset of the Simple English Wikipedia (SEW) corpus (Coster and Kauchak, 2011) was randomly chosen to build pairs of ar-ticles. The SEW corpus contains two sections that are 1) article-aligned and 2) sentence-aligned. We used the article-aligned section which contains around 60K aligned pairs of regular and simple ar-ticles. Since this corpus is not manually annotated with discourse information, we used the End-End parser (Lin et al., 2014) to annotate it. In to-tal, we created 1988 pairs of articles consisting of 994 positive and 994 negative instances. Similarly to the PDTB-based data set, each positive instance represents a pair of articles at the same complex-ity level (i.e. either both complex or both simple).
On the other hand, for each negative instance, we chose a pair of aligned articles from the SEW cor-pus (i.e. a pair of aligned articles containing one article taken from Wikipedia and its simpler ver-sion taken from SEW).
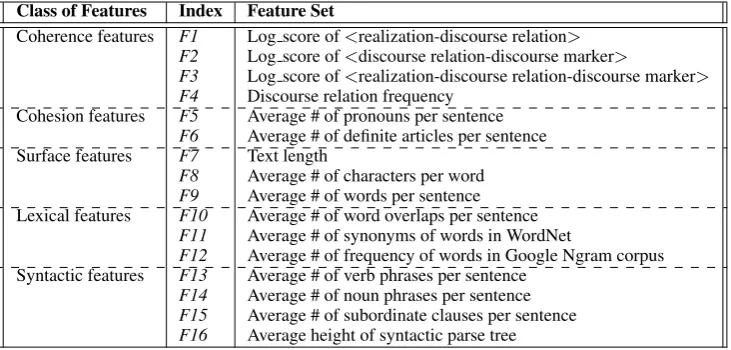
3.2 Features for Predicting Text Complexity To predict text complexity, we have considered 16 individual features grouped into five classes. These are summarized in Table 2 and described below.
3.2.1 Coherence Features
For a well written text to be coherent, utterances need to be connected logically and semantically using discourse relations. We considered coher-ence features in order to measure the association between this class of features and text complexity levels. Our coherence features include:
F1. Pairs of<realization, discourse relations> (e.g.<explicit, contrast>).
F2. Pairs of <discourse relations, discourse markers>, where applicable (e.g. <contrast, but>).
F3. Triplets of <discourse relations, realiza-tions, discourse markers>, where applicable (e.g. <contrast, explicit, but>).
F4. Frequency of discourse relations.
Each article was considered as a bag of dis-course properties. Then for features F1, F2 and
F3, the log score of the probability of each article is calculated using Formulas (1) and (2). Consid-ering a particular discourse feature (e.g. pairs of <discourse relations, discourse markers>), each article may contain a combination of n occur-rences of this feature withkdifferent feature val-ues. The probability of observing such article is calculated using the multinomial probability mass function as shown in Formula (2). In order prevent arithmetic underflow and be more computationally efficient, we used the log likelihood of this proba-bility mass function as shown in Formula (1).
log score(P) =log(P(n)) +log(n!)+ k
X
i=1
(xilog(pi)−log(xi!)) (1)
P =P(n)x n!
1!...xk!P1...Pk (2)
P(n) is the probability of an article withn in-stances of the feature we are considering,xiis the
number of times a feature has itsithvalue andPi
is the probability of a feature to have itsithvalue
based on all the articles of the PDTB. For example, for the featureF1 (i.e. pair of <realization, dis-course relation>), consider an article containing <explicit, contrast>, <implicit, causality> and <explicit, contrast>. In this case, nis the total number ofF1features we have in the article (i.e. n= 3), andP(n)is the probability of an article to have 3 such features across all PDTB articles. In addition,x1 = 2because we have two <explicit,
contrast> pairs andP1 is the probability of ob-serving the pair<explicit, contrast>over all pos-sible pairs of <realization, discourse relation>. Similarly,x2 = 1andP2is the probability of ob-serving<implicit, causality>pair over all possi-ble pairs of<realization, discourse relation>. 3.2.2 Cohesion Features
Cohesion is an important property of well-written texts (Grosz et al., 1995; Barzilay and Lapata, 2008). Addressing an entity for the first time in a text is different from further mentions to the en-tity. Proper use of referencing influences the ease of following a text and subsequently its complex-ity. Pronoun resolution can affect text cohesion in the way that it prevents repetition. Also, according to Halliday and Hasan (1976), definite description is an important characteristic of well-written texts. Thus, in order to measure the influence of cohe-sion on text complexity, we considered the follow-ing cohesive devices.
F5. Average number of pronouns per sentence.
F6.Average number of definite articles per sen-tence.
3.2.3 Surface Features
Surface features have traditionally been used in readability measures such as (Kincaid et al., 1975) to measure readability level. Pitler and Nenkova (2009) showed that the only significant surface feature correlated with text complexity level was the length of the text. As a consequence, we inves-tigated the influence of surface features by consid-ering the following three surface features:
F7. Text length as measured by the number of words.
F8. Average number of characters per word.
Class of Features Index Feature Set
Coherence features F1 Log score of<realization-discourse relation>
F2 Log score of<discourse relation-discourse marker>
F3 Log score of<realization-discourse relation-discourse marker>
F4 Discourse relation frequency Cohesion features F5 Average # of pronouns per sentence
F6 Average # of definite articles per sentence Surface features F7 Text length
F8 Average # of characters per word F9 Average # of words per sentence Lexical features F10 Average # of word overlaps per sentence
F11 Average # of synonyms of words in WordNet
F12 Average # of frequency of words in Google Ngram corpus Syntactic features F13 Average # of verb phrases per sentence
[image:5.595.117.483.62.237.2]F14 Average # of noun phrases per sentence F15 Average # of subordinate clauses per sentence F16 Average height of syntactic parse tree
Table 2:List of features in each class.
3.2.4 Lexical Features
In order to capture the influence of lexical choices across complexity levels, we considered the fol-lowing three lexical features:
F10. Average number of word overlaps per sen-tence.
F11. Average number of synonyms of words in WordNet.
F12. Average frequency of words in the Google N-gram (Web1T) corpus.
The lexical complexity of a text can be influ-enced by the number of words that are used in con-secutive sentences. This means that if some words are used repetitively rather than introducing new words in the following sentences, the text should be simpler. This is captured by featureF10: “ Av-erage # of word overlaps per sentence” which cal-culates the average number of word overlaps in all consecutive sentences.
In addition, the number of synonyms of a word can be correlated to its complexity level. To ac-count for this feature, F11: “Average # of syn-onyms of words in WordNet” is introduced to cap-ture the complexity of the words (Miller, 1995). Moreover, the frequency of a word can be an in-dicator of its simplicity. Also, feature F12: “ Av-erage # of frequency of words in Google N-gram corpus” is used based on the assumption that sim-pler words are more frequently used. In order to measure the frequency of each word, we used the Google N-gram corpus (Michel et al., 2011). Thus, pairs of articles at the same complexity level tend to have similar lexical features compared to pairs of articles at different complexity levels.
3.2.5 Syntactic Features
According to Kate et al. (2010), syntactic struc-tures seem to affect text complexity level. As Barzilay and Lapata (2008) note, more noun phrases make texts more complex and harder to understand. In addition, Bailin and Grafstein (2001) pointed out that the use of multiple verb phrases in a sentence can make the communica-tive goal of a text more clear as explicit discourse markers will be used to connect them; however it can also make a text harder to understand for less educated adults or children. The Schwarm and Os-tendorf (2005) readability assessment model was built based on a trigram language model, syntac-tic and surface features. Based on these previous work, we used the same syntactic features which includes:
F13. Average number of verb phrases per sen-tence.
F14. Average number of noun phrases per sen-tence.
15. Average number of subordinate clauses per sentence.
F16. Average height of syntactic parse tree.
These features were determined using the Stan-ford parser (Toutanova et al., 2003).
3.3 Results and Analysis
Feature set No. features SEW-based p-value Stat. Sign PDTB p-value Stat. Sign
Data Set Data Set
Baseline N/A 50.00% N/A N/A 51.23% N/A N/A
All features 16 94.96% N/A N/A 69.04% N/A N/A
Coherence only 4 93.76% 0.15 = 64.02% 0.45 =
Cohesion only 2 66.09% 0.00 ⇓ 57.93% 0.01 ⇓
Surface only 3 83.45% 0.00 ⇓ 51.32% 0.00 ⇓
Lexical only 3 78.20% 0.00 ⇓ 46.29% 0.00 ⇓
Syntactic only 4 79.32% 0.00 ⇓ 62.16% 0.24 =
All-Coherence 12 86.70% 0.00 ⇓ 62.43% 0.08 ⇓
All-Cohesion 14 95.32% 0.44 = 68.25% 0.76 =
All-Surface 13 95.10% 0.43 = 68.25% 0.61 =
All-Lexical 13 95.42% 0.38 = 64.81% 0.57 =
[image:6.595.73.529.63.210.2]All-Syntactic 12 94.30% 0.31 = 66.40% 0.67 =
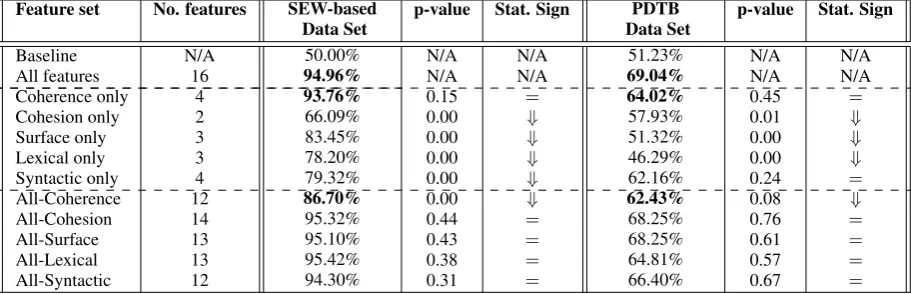
Table 3:Accuracy of Random Forest models built using different subset of features.
various classifiers on our data sets (see Section 3.1) using 10-fold cross-validation. In order to test the statistical significance of the results, we conducted a two-sample t-test (with a confidence level of 90%) comparing the models built using each feature set to the model trained using all fea-tures. A statistically significant decrease (⇓) or no difference (=) is specified in the column labeled Stat. Sign.
Our baseline is to consider no feature and sim-ply assign the class label of the majority class. As indicated in Table 3, the baseline is about 50% for both data sets. When all features are used, the accuracy of the classifier trained on the SEW-based data set is 94.96% and the one trained on the PDTB-based data set is 69.04%.
Considering only one class of features, the models trained using coherence features on both data sets outperformed the others (93.76% and 64.02%) and their accuracy are statistically as high as using all features together. However one must also note that there is a significant difference be-tween the number of features (4 for coherence only vs. 16 for all features). Indeed, in both data sets, cohesion features are more useful than lexical features and less than syntactic features.
Furthermore, it is interesting to note that sur-face features seem to be more discriminating in the SEW articles rather than in PDTB articles; how-ever, viceversa is true about cohesion features. In addition, the decrease in the accuracy of all classi-fiers trained on the SEW using only one feature except coherence features is statistically signifi-cant. The same is true about the models trained on the PDTB with the only difference being the one trained using only syntactic features which performs as well as the one trained using all the features (62.16% vs. 69.04%).
The last section of Table 3 shows the classifica-tion results when excluding only one class of fea-tures. In this case, removing coherence features leads to a more significant drop in performance compared to the other classes of features. The classifier trained using all features except the co-herence features achieves an accuracy of 86.70% and 62.43% on the SEW and PDTB corpus respec-tively. This decrease in both models is statistically significant; however the changes in the accuracy of other classifiers trained using all features exclud-ing only one class is not statistically significant.
3.4 Feature Selection
In any classification problem, feature selection is useful to identify the most discriminating fea-tures and reduce the dimensionality and model complexity by removing the least discriminating ones. In this classification problem, we built sev-eral classifiers using different subsets of features; however, identifying how well a feature can dis-criminate the classes would be helpful in building a more efficient model with fewer number of fea-tures.
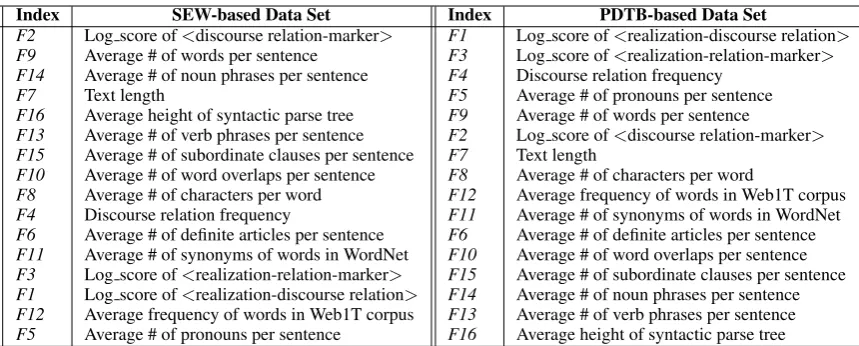
Using our pairwise classifier built with all the features, we ranked the features by their informa-tion gain. Table 4 shows all the features used in the two models using all the features trained on the PDTB-based data set and the SEW-based data set.
10-Index SEW-based Data Set Index PDTB-based Data Set
F2 Log score of<discourse relation-marker> F1 Log score of<realization-discourse relation>
F9 Average # of words per sentence F3 Log score of<realization-relation-marker>
F14 Average # of noun phrases per sentence F4 Discourse relation frequency
F7 Text length F5 Average # of pronouns per sentence
F16 Average height of syntactic parse tree F9 Average # of words per sentence
F13 Average # of verb phrases per sentence F2 Log score of<discourse relation-marker>
F15 Average # of subordinate clauses per sentence F7 Text length
F10 Average # of word overlaps per sentence F8 Average # of characters per word
[image:7.595.82.512.60.233.2]F8 Average # of characters per word F12 Average frequency of words in Web1T corpus F4 Discourse relation frequency F11 Average # of synonyms of words in WordNet F6 Average # of definite articles per sentence F6 Average # of definite articles per sentence F11 Average # of synonyms of words in WordNet F10 Average # of word overlaps per sentence F3 Log score of<realization-relation-marker> F15 Average # of subordinate clauses per sentence F1 Log score of<realization-discourse relation> F14 Average # of noun phrases per sentence F12 Average frequency of words in Web1T corpus F13 Average # of verb phrases per sentence F5 Average # of pronouns per sentence F16 Average height of syntactic parse tree
Table 4: Features ranked by information gain
fold cross-validation. Using onlyF1: “log score of <realization, discourse relation>” to classify the PDTB-based data set, we achieved an accuracy of 56.34%. This feature on its own outperformed the individual class of surface features and lexical features and performed as well as combining the features of the two classes (four features). It also performed almost as well as the two cohesion fea-tures (F5,F6). In addition, using only the feature
F2: “log score of<discourse relation, discourse marker>” on the SEW corpus resulted in an ac-curacy of 77.26% which is much higher than the accuracy of the classifier built using the class of cohesion and almost as good as lexical features.
4 Conclusion
In this paper we investigated the influence of vari-ous classes of features in pairwise text complexity assessment on two data sets created from standard corpora. The combination of 16 features, grouped into five classes of surface, lexical, syntactic, co-hesion and coherence features resulted in the high-est accuracy. However the use of only 4 coherence features performed statistically as well as using all features on both data sets.
In addition, removing only one class of features from the combination of all the features did not af-fect the accuracy; except for coherence features. Removing the class of coherence features from the combination of all features led to a statisti-cally significant decrease in accuracy. Thus, we can conclude a strong correlation between text co-herence and text complexity. This correlation is weaker for other classes of features.
Acknowledgement
The authors would like to thank the anonymous reviewers for their feedback on the paper. This work was financially supported by NSERC.
References
Alan Bailin and Ann Grafstein. 2001. The linguistic assumptions underlying readability formulae: A cri-tique.Language & Communication, 21(3):285–301. Gianni Barlacchi and Sara Tonelli. 2013. Ernesta: A sentence simplification tool for children’s stories in Italian. In Proceeding of Computational Linguis-tics and Intelligent Text Processing (CICLing-2013), pages 476–487.
Regina Barzilay and Mirella Lapata. 2008. Modeling local coherence: An entity-based approach. Compu-tational Linguistics, 34(1):1–34.
Stefan Bott, Luz Rello, Biljana Drndarevic, and Ho-racio Saggion. 2012. Can Spanish be simpler? LexSiS: Lexical simplification for Spanish. In Pro-ceesing of Coling, pages 357–374.
Jamie Callan and Maxine Eskenazi. 2007. Combining lexical and grammatical features to improve read-ability measures for first and second language texts. InProceedings of NAACL HLT, pages 460–467. John Carroll, Guido Minnen, Yvonne Canning,
Siob-han Devlin, and John Tait. 1998. Practical simpli-fication of English newspaper text to assist aphasic readers. In Proceedings of the AAAI-98 Workshop on Integrating Artificial Intelligence and Assistive Technology, pages 7–10.
Jeanne Sternlicht Chall. 1958. Readability: An ap-praisal of research and application. Number 34. Ohio State University Columbus.
future research. ITL-International Journal of Ap-plied Linguistics, 165(2):97–135.
William Coster and David Kauchak. 2011. Simple English Wikipedia: A new text simplification task. In Proceedings of the 49th Annual Meeting of the Association for Computational Linguistics: Human Language Technologies (ACL-HLT): Short papers-Volume 2, pages 665–669, Portland, Oregon, June.
Edgar Dale and Jeanne S Chall. 1949. The concept of readability.Elementary English, 26(1):19–26.
Barbara J Grosz, Scott Weinstein, and Aravind K Joshi. 1995. Centering: A framework for modeling the lo-cal coherence of discourse. Computational linguis-tics, 21(2):203–225.
Michael AK Halliday and Ruqaiya Hasan. 1976. Co-hesion in English.English, Longman, London.
Rohit J Kate, Xiaoqiang Luo, Siddharth Patwardhan, Martin Franz, Radu Florian, Raymond J Mooney, Salim Roukos, and Chris Welty. 2010. Learning to predict readability using diverse linguistic features. InProceedings of the 23rd International Conference on Computational Linguistics, pages 546–554.
David Kauchak. 2013. Improving text simplification language modeling using unsimplified text data. In Proceeding of ACL (Volume 1: Long Papers), pages 1537–1546.
J. Peter Kincaid, Robert P. Fishburne Jr, Richard L. Rogers, and Brad S. Chissom. 1975. Derivation of new readability formulas (automated readability index, fFog count and Flesch reading ease formula) for navy enlisted personnel. Technical report, DTIC Document.
George Roger Klare et al. 1963. Measurement of read-ability. Iowa State University Press.
Majid Laali, Elnaz Davoodi, and Leila Kosseim. 2015. The CLaC Discourse Parser at CoNLL-2015. In Proceedings of the 19th Conference on Computa-tional Natural Language Learning: Shared Task, CoNLL, pages 56–60, Beijing, China.
Ziheng Lin, Hwee Tou Ng, and Min-Yen Kan. 2014. A PDTB-styled end-to-end discourse parser. Natural Language Engineering, 20(2):151–184.
William C Mann and Sandra A Thompson. 1987. Rhetorical structure theory: A framework for the analysis of texts. Technical report, IPRA Papers in Pragmatics 1.
Jean-Baptiste Michel, Yuan Kui Shen, Aviva Presser Aiden, Adrian Veres, Matthew K Gray, Joseph P Pickett, Dale Hoiberg, Dan Clancy, Peter Norvig, Jon Orwant, et al. 2011. Quantitative analysis of culture using millions of digitized books. Science, 331(6014):176–182.
George A Miller. 1995. Wordnet: a lexical database for english. Communications of the ACM, 38(11):39–41.
Emily Pitler and Ani Nenkova. 2008. Revisiting readability: A unified framework for predicting text quality. In Proceedings of the Conference on Em-pirical Methods in Natural Language Processing (EMNLP), pages 186–195, Honolulu, October.
Emily Pitler and Ani Nenkova. 2009. Using syntax to disambiguate explicit discourse connectives in text. In Proceedings of the ACL-IJCNLP 2009 Confer-ence Short Papers, pages 13–16, Suntec, Singapore.
Rashmi Prasad, Nikhil Dinesh, Alan Lee, Eleni Milt-sakaki, Livio Robaldo, Aravind Joshi, and Bonnie L. Webber. 2008. The Penn discourse treebank 2.0. In Proceedings of the 6th International Conference on Language Resources and Evaluation (LREC), Mar-rakesh, Morocco, June.
Luz Rello, Ricardo Baeza-Yates, Laura Dempere-Marco, and Horacio Saggion. 2013. Frequent words improve readability and short words improve under-standability for people with dyslexia. In Human-Computer Interaction–INTERACT 2013, pages 203– 219.
Sarah E Schwarm and Mari Ostendorf. 2005. Read-ing level assessment usRead-ing support vector machines and statistical language models. In Proceedings of the 43rd Annual Meeting on Association for Com-putational Linguistics (ACL), pages 523–530, Ann Arbor, June.
Advaith Siddharthan. 2003. Preserving discourse structure when simplifying text. InProceedings of the European Natural Language Generation Work-shop (ENLG), 11th Conference of the European Chapter of the Association for Computational Lin-guistics (EACL’03), pages 103–110.
Advaith Siddharthan. 2006. Syntactic simplification and text cohesion. Research on Language & Com-putation, 4(1):77–109.
Advaith Siddharthan. 2014. A survey of research on text simplification. ITL-International Journal of Ap-plied Linguistics, 165(2):259–298.
Sanja ˇStajner, Biljana Drndarevic, and Horacio Sag-gion. 2013. Corpus-based sentence deletion and split decisions for Spanish text simplification. Com-putaci´on y Sistemas, 17(2):251–262.
Sowmya Vajjala and Detmar Meurers. 2012. On im-proving the accuracy of readability classification us-ing insights from second language acquisition. In Proceedings of the Seventh Workshop on Building Educational Applications Using NLP, pages 163– 173.
Bonnie Webber and Aravind Joshi. 2012. Discourse structure and computation: past, present and future. In Proceedings of the ACL-2012 Special Workshop on Rediscovering 50 Years of Discoveries, pages 42– 54.
Bonnie Webber. 2004. D-LTAG: Extending lexical-ized tag to discourse. Cognitive Science, 28(5):751– 779.
Sandra Williams, Ehud Reiter, and Liesl Osman. 2003. Experiments with discourse-level choices and read-ability. In Proceedings of the 9th European Work-shop on Natural Language Generation (ENLG-2003), pages 127–134, Budapest, Hungary, April. Beverly L Zakaluk and S Jay Samuels. 1988.