UNDERSTANDING
EXPLOSIONS
Daniel A. Crowl
Depart ment of Chem i cal Engi neer ing Mich i gan Tech no log i cal Uni ver sity
Center for Chemical Process Safety
of
the
3 Park Avenue
New York, New York 10016-5991
All rights reserved. No part of this pub li ca tion may be repro duced, stored in a retrieval system, or trans mit ted in any form or by any means, elec tronic, mechan i cal, pho to copy ing, record ing, or oth er wise with out the prior per mis sion of the copy right owner. AIChE™and CCPS® are trade marks owned by the Amer i can Insti tute of Chem i cal Engi neers. These trade marks may not be used with out the prior express writ ten con sent of the Amer i can Insti tute of Chem i cal Engi neers. The use of this prod uct in whole or in part for com mer cial use is pro hib ited with out prior express writ ten con sent of the Amer i can Insti tute of Chem i cal Engi neers. To obtain appro pri ate license and per mis sion for such use con tact Scott Berger, 212-591-7237, [email protected].
Library of Congress Cataloging-in-Publication Data: CIP data applied for
ISBN 0-8169-0779-X CCPS Pub li ca tion G-61
It is sin cerely hoped that the infor ma tion pre sented in this volume will lead to an even more impres sive safety record for the entire indus try. How ever, the Amer i can Insti tute of Chem i cal Engi neers, its con sul tants, CCPS Sub com mit tee mem bers, their employ ers, and their employ ers’ offi cers and direc tors and Mich i gan Tech no log i cal Uni ver sity and Daniel A. Crowl dis claim making or giving any war ran ties or rep re sen ta tions, express or implied, includ ing with respect to fit ness, intended pur pose, use or mer chant abil ity, and/or cor rect ness or accu racy of the con tent of the infor ma tion pre sented in this doc u ment. As between (1) Amer i can Insti tute of Chem i cal Engi neers, its con sul tants, CCPS Sub com mit tee mem bers, their employ ers, and their employ ers’ offi cers and direc tors and Mich i gan Tech no log i cal Uni ver sity and Pro fes sor Daniel A. Crow (2) the user of this doc u ment acceptsany legal lia bil ity or responsibility whatsoever for the consequences of its use or misuse.
PRINTED IN THE UNITED STATES OF AMERICA 10 9 8 7 6 5 4 3 2 1
PREFACE
For over 40 years the Amer i can Insti tute of Chem i cal Engi neers (AIChE) has been involved with pro cess safety and loss con trol in the chem i cal, pet ro chem i cal, hydro car bon pro cess and related indus tries and facil i ties. The AIChE pub li ca tions are infor ma tion resources for the chem i cal engi neer ing and other pro fes sions on the causes of pro cess inci dents and the means of pre vent ing their occur rences and mit i gat ing their con se quences.
The Center for Chem i cal Pro cess Safety (CCPS), a Direc tor ate of the AIChE, was estab lished in 1985 to develop and dis sem i nate infor ma tion for use in pro mot -ing the safe oper a tion of chem i cal pro cesses and facil i ties and the pre ven tion of chem i cal pro cess inci dents. With the sup port and direc tion of its advi sory and man age ment boards, CCPS estab lished a mul ti fac eted pro gram to address the need for pro cess safety tech nol ogy and man age ment sys tems to reduce poten tial expo sures to the public, the envi ron ment, per son nel and facil i ties. This pro gram entails the devel op ment, pub li ca tion and dis sem i na tion of Guide lines relat ing to spe cific areas of pro cess safety; orga niz ing, con ven ing and con duct ing sem i nars, sym po sia, train ing pro grams, and meet ings on pro cess safety-related mat ters; and coop er at ing with other orga ni za tions and insti tu tions, inter na tion ally and domes ti -cally to pro mote pro cess safety. Within the past sev eral years CCPS extended its pub li ca tion pro gram to include a “Con cept Series” of books. These books are focused on more spe cific topics than the longer, more com pre hen sive Guide lines series and are intended to complement them. With the issuance of this book, CCPS has published nearly 70 books.
CCPS activ i ties are sup ported by the fund ing and tech ni cal exper tise of over 80 cor po ra tions. Sev eral gov ern ment agen cies and non profit and aca demic insti tu -tions par tic i pate in CCPS endeavors.
In 1989 CCPS pub lished the land mark Guide lines for the Tech ni cal Man age
-ment of Chem i cal Pro cess Safety. This book pres ents a model for pro cess safety
man age ment built on twelve dis tinct, essen tial and inter re lated ele ments. The fore -word to that book states:
For the first time all the essen tial ele ments and com po nents of a model of a tech ni -cal man age ment pro gram have been assem bled in one doc u ment. We believe the Guide lines pro vide the umbrella under which all other CCPS Tech ni cal Guide -lines will be pro mul gated.
This Con cept Series book Under stand ing Explo sions sup ports sev eral of the twelve ele ments of pro cess safety enun ci ated in Guide lines for the Tech ni cal Man
-age ment of Chem i cal Pro cess Safety includ ing pro cess risk man -age ment, inci dent
inves ti ga tion, pro cess knowl edge and doc u men ta tion, and enhance ment of pro cess safety knowl edge.
In 1976, a mono graph “Fun da men tals of Fire and Explo sion,” authored by D. R. Stull of the Dow Chem i cal Com pany, was pub lished as part of the AIChE Mono graph Series (Volume 73, No. 10). Stull’s work has long been out of print and no other pub li ca tion has been avail able to replace it. AIChE and CCPS rec og -nized the need for a sim i lar, but updated, util i tar ian work built upon the foun da tion pro vided by Stull and autho rized the writing of this book.
ACKNOWLEDGMENTS
The Amer i can Insti tute of Chem i cal Engi neers and the Center for Chem i cal Pro cess Safety express their grat i tude to all the mem bers of the Vapor Cloud Explo -sions Sub com mit tee for their gen er ous efforts and tech ni cal con tri bu tions in the prep a ra tion of this Con cept Series Book.
Mr. John Dav en port, for merly of Indus trial Risk Insur ers, and now a CCPS Staff Con sul tant, and Mr. Robert Linney of Air Prod ucts and Chem i cals ini tially chaired the Vapor Cloud Explo sions Sub com mit tee. Dr. Jan Windhorst of Nova Chem i cals later assumed the chair man ship. The other sub com mit tee mem bers were John V. Birtwistle, RRS Engi neer ing PLC; Wil liam Thornberg, HSB Indus -trial Risk Insur ers; Albert G. Dietz, Jr., U.S. Depart ment of Energy; Alexi I. Dimopoulos, ExxonMobil Research & Engi neer ing Com pany; Cheryl A. Grounds, Baker Engi neer ing and Risk Con sul tants, Inc.; Peter Hoffman, Celan ese Cor po ra tion; Randy Hawkins, Celan ese Cor po ra tion, Robert A. Mancini, BP Amoco Cor po ra tion; Larry J. Moore, FM Global; Walter L. Frank, ABS Con sult -ing; Ephraim Scheier, BP Amoco Cor po ra tion; Samuel A. Rodgers, Honeywell Inter na tional Incor po rated; David G. Clark, E. I. DuPont de Nemours & Com pany, and Gerald Meyers, U.S. Depart ment of Energy. The con tri bu tions of David Kirby and R. F. Schwab are also acknowl edged. Martin E. Gluckstein was the CCPS staff liai son and was respon si ble for the over all admin is tra tion and coor di na tion of the pro ject.
The author is Pro fes sor Daniel A. Crowl of Mich i gan Tech no log i cal Uni ver -sity. Chad V. Mashuga drew almost all of the fig ures and assem bled the tables while a grad u ate stu dent at Mich i gan Tech no log i cal Uni ver sity. Dr. Mashuga is cur rently employed by the BASF Corporation.
Before pub li ca tion, all CCPS books are sub jected to a thor ough peer review pro cess. CCPS also grate fully acknowl edges the thought ful com ments and sug -ges tions of the Peer Reviewers:
Quentin A. Baker, Baker Engi neer ing and Risk Con sul tants, Inc. Daniel Bour geois, Proc tor and Gamble Engi neer ing
Rudy Frey, Kellogg Brown and Root
Stan Grossel, Pro cess Safety and Design, Inc. Shah Khajeh Najafi, SAFER Sys tems LLC
PREFACE ix
ACKNOWLEDGMENTS xi
1
INTRODUCTION 1
1.1. Acci dent Loss His tory 3
1.2. The Acci dent Pro cess (AIChE, 2000) 4
1.3. A Case His tory—Flixborough, Eng land 4
1.4. Hazard Iden ti fi ca tion and Eval u a tion 6
1.5. Inher ently Safer Design 7
2
FUNDAMENTALS OF FIRES AND EXPLOSIONS 9
2.1. Gases and Vapors 13
2.1.1. Flammability Dia gram 18
2.1.2. Esti mat ing Flammability Limits 28 2.1.3. Tem per a ture Effect on Flammability 30 2.1.4. Pres sure Effect on Flammability 31 2.1.5. Flammability of Gas eous Mix tures 31 2.1.6. Min i mum Igni tion Ener gies 32 2.1.7. Autoignition Tem per a ture 34
2.1.8. Exam ple Appli ca tions 34
2.2. Liq uids 37
2.2.1. Flashpoints of Mix tures of Liq uids 40
2.2.2. Exam ple Appli ca tions 42
2.3. Aero sols and Mists 43
2.4. Dusts 43
2.5. Hybrid Mix tures 48
2.6. Kinet ics and Thermochemistry 48
2.6.1. Cal cu lated Adi a batic Flame Tem per a tures (CAFT) 50
2.6.2. Exam ple Appli ca tion 52
2.7. Gas Dynam ics 54
2.7.1. Det o na tions and Def la gra tions 58 2.7.2. Esti mat ing Peak Side-on Overpressures 61
2.7.3. Exam ple Appli ca tions 62
2.7.4. Pres sure Piling and Def la gra tion to Det o na tion Tran si tion 63
2.8. Phys i cal Explo sions 64
2.8.1. BLEVEs 65
2.8.2. Rapid Phase Tran si tion Explo sions 67
2.9. Vapor Cloud Explo sions 68
2.9.1. TNT Equiv a lency 70
2.9.2. TNO Multi-Energy Method 71
2.9.3. Baker–Strehlow–Tang Method (AIChE, 1999a) 77 2.9.4. Com pu ta tional Fluid Mechan ics (CFD) Method 82
2.9.5. Exam ple Appli ca tions 83
2.10. Run away Reac tions 85
2.10.1. Steady-State and Dynamic Reac tor Behav ior 88 2.10.2. Exper i men tal Char ac ter iza tion 92
2.11. Con densed Phase Explo sions 94
2.12. Fire balls, Pool, Flash, and Jet Fires 96
2.13. Explo sion Effects 98
2.13.1. Ther mal Expo sure 98
2.13.2. Overpressure Expo sure 99
2.14. Igni tion Sources 103
2.14.1. Static Elec tric ity 105
3
PREVENTION AND MITIGATION OF EXPLOSIONS 113
3.1. Addi tional Ref er ences 113
3.2. Inher ently Safer Design 113
3.3. Using the Flammability Dia gram
to Avoid Flam ma ble Atmo spheres 117
3.4. Inerting and Purg ing 120
3.4.1. Vacuum Purg ing 121
3.4.2. Pres sure Purg ing 123
3.4.3. Com bined Pres sure–Vacuum Purg ing 124
3.4.4. Sweep Purg ing 126
3.4.5. Siphon Purg ing 127
3.4.6. Advan tages and Dis ad van tages of the Var i ous
Inerting Pro ce dures 127
3.4.7. Inert Gas Blan ket ing of Stor age Ves sels 128 3.4.8. Inert Purg ing and Blan ket ing during Drum ming Oper a tions 128
3.5. Exam ple Appli ca tion 130
3.6. Explo sion Vent ing 132
3.7. Ground ing and Bond ing 132
3.8. Ven ti la tion 138
3.9. Sprin kler and Deluge Sys tems 139
3.10. Charg ing and Drum ming Flam ma ble Liq uids 142
3.11. Exam ple Appli ca tion 142
3.12. Charg ing Pow ders 145
3.13. Elec tri cal Equip ment in Haz ard ous (Clas si fied) Areas 148
3.13.1. Pro tec tion Tech niques 156
Appen dix A
DETAILED EQUATIONS FOR FLAMMABILITY DIAGRAMS 161
Part A: Equa tions Useful for Gas Mix tures 161
Part B: Equa tions Useful for Plac ing Ves sels
Into and Out of Ser vice 165
Appen dix B
EQUATIONS FOR DETERMINING THE ENERGY OF EXPLOSION 169
B.1. Exam ple Appli ca tion 171
Appen dix C
Appen dix D
PROCEDURE FOR EXAMPLE 3.2 177
Appen dix E
COMBUSTION DATA FOR DUST CLOUDS 191
REFERENCES 193
GLOSSARY 203
INDEX 209
1
INTRODUCTION
Fires and explo sions in the pro cess indus tries, although rare, do occur and can cause loss of life, damage to the envi ron ment, loss of equip ment and inven tory, busi ness inter rup tion, and loss of public trust. Explo sions may occur at fixed site facil i ties, and also during trans por ta tion. They can also occur in other indus tries besides the chem i cal indus try, includ ing food pro cess ing, util i ties, pulp and paper, and pharmaceuticals, to name a few.
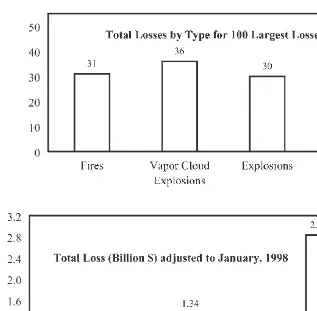
An anal y sis of the larg est inci dents in the chem i cal pro cess indus tries, ranked by total cap i tal losses shows that fires and explo sions account for almost all of the major losses, as shown in the top of Figure 1.1. Figure 1.1 also shows the total cap -i tal losses over 5 year per-i ods, adjusted to Jan u ary 1998 dol lars to account for infla tion. These sta tis tics show an upward trend in total acci dent costs. Clearly, fires and explo sions are respon si ble for most of these large losses.
Damage from an explo sion is caused by the result ing blast wave, ther mal energy, flying frag ments and debris, or the sub se quent fire. Most of the damage due to explo sions at a fixed site is usu ally lim ited to on-site effects. How ever, an explo sion or fire can also result in a toxic release which can have addi tional off-site impacts. Toxic releases are dis cussed in more detail else where (AIChE, 1989; Fthenakis, 1993; AIChE, 1996a; AIChE, 1997; AIChE, 1999a; AIChE, 2000).
The dif fer ence between a fire and an explo sion depends on the time frame in which these events occur. Fires are typ i cally much slower events involv ing the com bus tion of mate ri als. Explo sions are due to the sudden release of energy over a very short period of time and may or may not involve com bus tion or other chem i -cal reac tions. It is pos si ble for a fire to lead to an explo sion and an explo sion might lead to a fire and sec ond ary explo sions if com bus ti ble gases or liquids are involved.
Most people under stand what an explo sion is, but a detailed tech ni cal def i ni -tion is not simple, and many def i ni -tions are avail able. AIChE/CCPS (AIChE, 1994) defines an explo sion as “a release of energy that causes a blast.” They sub se -quently define a “blast” as “a tran sient change in the gas den sity, pres sure, and veloc ity of the air sur round ing an explo sion point.” Crowl and Louvar (Crowl and Louvar, 2002) define an explo sion as “a rapid expan sion of gases result ing in a rap -idly moving pres sure or shock wave.” A fur ther dis tinc tion for an explo sion is that
the pres sure or shock wave is of suf fi cient mag ni tude to cause potential damage or injury.
In sum mary, the three essen tial char ac ter is tics of an explo sion are:
1. Sudden energy release
2. Rap idly moving blast or shock wave
3. Blast mag ni tude large enough to be potentially haz ard ous
This book deals with explo sions. The pur pose of the book is to pro vide infor -ma tion to those involved with the design, oper a tion, -main te nance and -man age ment of chem i cal pro cesses. After read ing this book the reader should under stand the nature of explo sions and the prac ti cal meth ods required to pre vent explo sions and to pro tect against their con se quences. This book pro vides only lim ited detail on cur rent explo sion the o ries or models—many books and jour nal arti cles are avail -able (see the Ref er ences).
[image:12.504.37.354.35.346.2]2 1 Introduction
Anyone with a back ground in engi neer ing, chem is try or a related tech nol ogy should be able to read and apply this book. In par tic u lar, chem i cal plant oper a tors, plant main te nance per son nel, pro cess engi neers, design engi neers, and plant man -age ment per son nel should find this book useful. Others involved with first response and home land safety and secu rity could also use this book.
This book will pro vide the reader with an under stand ing of:
• The fun da men tal basis for explo sions, from a prac ti cal stand point. • How to char ac ter ize the explo sive and flam ma ble behav ior of mate ri als. • The dif fer ent types of explo sions.
• Hazard rec og ni tion related to fires and explo sions.
• The prac ti cal meth ods to pre vent an explo sion or min i mize the prob a bil ity or con se quence of an explo sion during the rou tine use of flam ma ble, com -bus ti ble, and/or reac tive mate ri als.
• Ref er ences for addi tional study.
This book has two parts. The first part (Chap ter 2) describes the fun da men tals of explo sions. This includes the param e ters used to char ac ter ize flammability and explo sions of dif fer ent mate ri als, the var i ous types of fires and explo sions, and how explo sions and fires cause damage. Exam ples are pro vided to show how the fun da men tals relate to real-world prob lems. The second part (Chap ter 3) describes the common, prac ti cal meth ods used to pre vent explo sions. Exam ples are pro vided here to dem on strate application of these methods.
1.1. Acci dent Loss His tory
In 1998 (USBL, 1999) there were 6010 acci den tal deaths on the job in the U.S. for all man u fac tur ing sec tors and job types. These fatal i ties are sum ma rized in Table 1.1 accord ing to cause. The lead ing cause of death was by trans por ta tion acci dents, which were respon si ble for 44% of all fatal work inju ries. Fires and explo -sions accounted for only 3% of the total fatal i ties.
1.2. The Acci dent Pro cess (AIChE, 2000)
Acci dents begin with an inci dent, which usu ally results in loss of con trol of mate -rial or energy. The inci dent could be the rup ture of a tank by a fork lift, a ther mal run away reac tion, a leak in a flange due to cor ro sion of the con nect ing bolts, and so forth. A sce nario describes the sequence of events that lead to the final con se quence(s), or inci dent out come(s), of the acci dent. For exam ple, con sider the inci -dent of a tank fail ure result ing in the sudden loss of con tain ment of a flam ma ble liquid. Sub se quent dis per sion and mixing with air to form a flam ma ble mix ture may be fol lowed by fire or explo sion. The result ing explo sion pro duces an inci -dent out come of a blast wave which causes damage, or acci dent effects on the sur round ings.
1.3. A Case His tory—Flixborough, Eng land
The Flixborough acci dent of June of 1974 will be used to dem on strate the steps in the acci dent pro cess. This acci dent is selected here since it was exten sively inves ti -gated, an inquiry with a detailed report was com pleted (Parker, 1975) and it involved the release and explo sion of a large amount of flam ma ble vapor. Many dis cus sions of the acci dent are avail able else where (Lees, 1986, 1996)
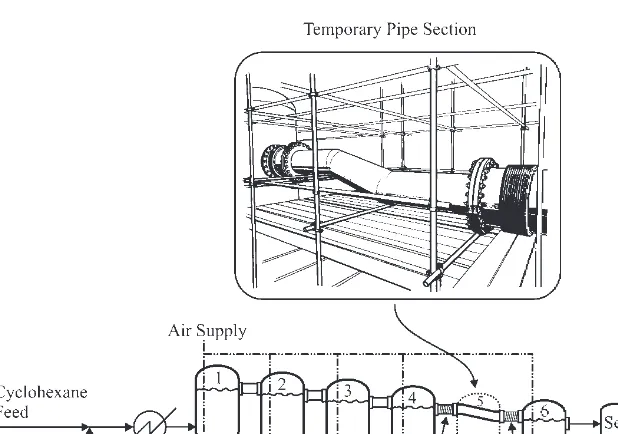
The Flixborough plant was designed to man u fac ture caprolactam, a pre cur sor in the pro duc tion of nylon. In one part of the pro cess, cyc lo hex ane is oxi dized to a mix ture of cyclohexanone and cyclohexanol. This reac tion occurred in a series of six reac tors shown in Figure 1.2. The pro cess was main tained at a tem per a ture of 155°C and a pres sure of 7.9 atm to pre vent the liquid from boiling.
The liquid inven tory in the reac tor system was large since the con ver sion and yield were low. The total cyc lo hex ane liquid holdup in the reac tion train was 120
4 1 Introduction
TABLE 1.1
Sum mary of Work-Related Fatal i ties By Cause for 1998 (USBL, 1999)
Cause Total Percent
Transportation accidents 2630 44
Homicide/suicide 960 16
Contact with objects and equipment 941 16
Falls 702 12
Exposure to harmful substances and environments 572 9
Fires and Explosions 205 3
metric tonnes. The lines between each vessel were orig i nally 28 inches in diam e -ter, with the liquid flow ing by grav ity from one vessel to the next.
About a month before the inci dent, a ver ti cal crack was found in reac tor 5. In order to main tain pro duc tion the reac tor was removed and a tem po rary bypass line was installed. The tem po rary, Z-shaped line was con structed of 20-inch diam e ter pipe with a flex i ble bel lows at each end con nect ing reac tors 4 and 6. The entire assem bly was sup ported on a tem po rary scaf fold, as shown in the cutout of Figure 1.2. This tem po rary design was sketched on a work room floor and was not reviewed by a qual i fied engi neer.
It is hypoth e sized that the tem po rary pipe assem bly failed pri mar ily due to repeated flex ing of the bel lows from pro cess pres sure changes caus ing the pipe to rotate some what due to its shape. The pipe assem bly was also inad e quately sup -ported. The pro cess was depressurized almost instantly, result ing in the release and vapor iza tion of an esti mated 30 metric tonnes of flam ma ble liquid. The vapor mixed with the sur round ing air and, about 45 sec onds after the release, the vapor cloud was ignited, lead ing to the explosion.
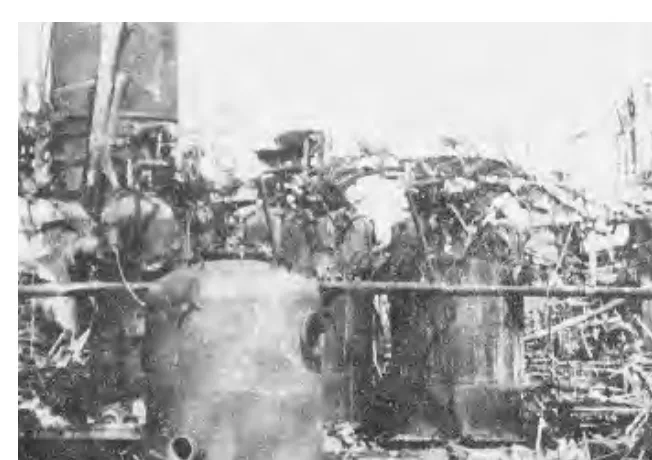
[image:15.504.41.350.36.253.2]were injured. Most of the fatal i ties occurred in the con trol room when the roof of the build ing col lapsed. The acci dent occurred during a weekend—if it had occurred during normal work ing hours the admin is tra tion build ing would have been filled with people and the fatal ity count would most likely have been greater. Figure 1.3 shows the result ing damage in the reac tor area due to the explo sion.
The sub se quent inves ti ga tion (Parker, 1975) found the fol low ing defi cien cies:
• The design of the tem po rary piping sec tion was sub stan dard and did not meet the design spec i fi ca tions of the orig i nal pro cess.
• A safety review or haz ards anal y sis was not per formed on the tem po rary piping sec tion, as would be required today by man age ment of change. • The plant site con tained exces sive inven to ries of flam ma ble mate ri als,
which con trib uted to the acci dent after the ini tial blast.
1.4. Hazard Iden ti fi ca tion and Eval u a tion
A hazard is “an inher ent phys i cal or chem i cal char ac ter is tic of a mate rial, system, pro cess or plant that has the poten tial for caus ing harm” (AIChE, 1992a). This includes haz ards asso ci ated with tem per a ture, pres sure, flammability, tox ic ity, etc. Many haz ards are fixed and con tin u ously pres ent, such as chem i cal tox ic ity, but others occur due to pro cess pro ce dures and pro cess con di tions (such as high pres sure).
[image:16.504.34.360.35.265.2]6 1 Introduction
An acci dent results when an inci dent occurs to acti vate a hazard. The inci dent could involve an oper at ing or main te nance pro ce dure, soft ware, a mate rial defect, cor ro sion, etc. More details on how this occurs are found else where (AIChE, 1992b). In the Flixborough acci dent, the fail ure of the tem po rary pipe sec tion acti -vated the hazard asso ci ated with the flam ma ble prop er ties of the chemicals.
The pur pose of hazard iden ti fi ca tion is to deter mine the haz ards. Until a hazard is iden ti fied, it cannot be removed, con trolled or mit i gated. Many acci -dents, such as Flixborough, occur as a result of improper haz ards iden ti fi ca tion.
Hazard eval u a tion is defined as “the anal y sis of the sig nif i cance of haz ard -ous sit u a tions asso ci ated with a pro cess or activ ity.” This includes a number of qual i ta tive meth ods which are dis cussed fully else where (AIChE, 1992a).
1.5. Inher ently Safer Design
A chem i cal pro cess is con sid ered inher ently safer if “it reduces or elim i nates the haz ards asso ci ated with mate ri als and oper a tions used in the pro cess, and this reduc tion or elim i na tion is per ma nent and insep a ra ble” (Bol linger, Clark et al., 1996).
Inher ently safer con cepts can be applied at any point in the life cycle of a pro -cess, from con cep tual design to pro cess decom mis sion ing. How ever, the larg est ben e fits are real ized when inher ently safer design prin ci ples are applied during the early stages.
2
FUNDAMENTALS OF FIRES AND EXPLOSIONS
The explo sive behav ior of a mate rial depends on many vari ables, includ ing its phys i cal state (solid, liquid or gas; powder or mist), its phys i cal prop er ties (heat capac ity, vapor pres sure, heat of com bus tion, etc.) and its reac tiv ity. The type of fire or explo sion that results also depends on a number of fac tors, includ ing
• the mate rial’s ini tial con di tions of use or stor age • the way in which the mate rial is released • how the mate rial is dis persed and mixed with air • when and how the mate rial is ignited.
Figure 2.1 shows the major clas si fi ca tions of explo sions. It is pos si ble for more than one clas si fi ca tion type to occur in any par tic u lar inci dent. These clas si fi -ca tions will be dis cussed in more detail later in this text. Table 2.1 shows spe cific exam ples of the different types.
A phys i cal explo sion occurs due to the sudden release of mechan i cal energy, such as by releas ing a com pressed gas, and does not involve a chem i cal reac tion. Phys i cal explo sions include vessel rup tures, boil ing liquid expand ing vapor explo -sions (BLEVE) and rapid phase tran si tion explo -sions. The mechan i cal energy con tained by the mate rial in the vessel is released. A vessel rup ture explo sion occurs when a pro cess vessel con tain ing a pres sur ized mate rial fails sud denly. The fail ure can be due to a number of mech a nisms, includ ing mechan i cal fail ure, cor -ro sion, heat expo sure, cycli cal fail ure, etc. A BLEVE occurs when a vessel con -tain ing a liquified gas stored above its normal boil ing point fails cat a stroph i cally. The vessel fail ure results in sudden flash ing of the liquid into vapor, with sub se -quent damage due to the rap idly expand ing vapor, ejec tion of liquid and vessel con tents and frag ment impact. A fire ball may result if the mate rial is com bus ti ble. A rapid phase tran si tion explo sion occurs when a mate rial is exposed to a heat source, caus ing a rapid phase change and resulting change in material volume. A
chem i cal explo sion requires a chem i cal reac tion, which could be a com bus tion reac tion, a decom po si tion reac tion, or some other rapid exo ther mic reac tion. A uni form reac tion is a reac tion that occurs uni formly through space in a reac tion mass, such as a reac tion which occurs in a con tin u ous stirred tank reac tor (CSTR). An exam ple of an explo sion caused by this type of reac tion is the run away reac -tion or ther mal run away. A run away reac tion occurs when the heat released by the reac tion exceeds the heat removal, result ing in a tem per a ture and pres sure increase which may be suf fi cient to rup ture the pro cess con tain ment. A prop a gat -TABLE 2.1
Exam ples of Var i ous Types of Explo sions
Type of Explo sion Exam ples
Rapid phase transition: • Hot oil pumped into vessel containing water. • Valve in pipeline opened, exposing water to hot oil.
BLEVE: • Corrosive failure of a hot water heater. • Propane tank rupture.
Vessel Rupture: • Mechanical failure of a vessel containing high pressure gas. • Overpressuring of a vessel containing a gas.
• Failure of a relief device during overpressure.
Uniform reaction: • Thermal runaway of a continuous stirred tank reactor.
Propagating reaction: • Combustion of flammable vapors in a fuel tank. • Combustion of flammable vapors in a pipeline.
ing reac tion is a reac tion which prop a gates spa tially through the reac tion mass, such as the com bus tion of a flam ma ble vapor in a pipe line, a vapor cloud explo -sion, or the decom po si tion of an unsta ble solid. Prop a gat ing reac tions are fur ther clas si fied as det o na tions or def la gra tions, depend ing on the speed at which the reac tion front prop a gates through the unreacted mass. For det o na tions, the reac -tion front moves equal to or faster than the speed of sound in the unreacted medium and for deflagrations it moves at a speed less than the speed of sound.
Chem i cal explo sions can occur in either the vapor, liquid, or solid phases. Chem i cal explo sions which occur in the liquid or solid phases are some times called con densed phase explo sions. These are sig nif i cant due to the high energy den sity in the materials.
The damage from a fire or explo sion is due to a number of impact mech a -nisms. This includes pres sure effects, ther mal expo sure, pro jec tiles and loss of mate rial con tain ment. For explo sions, pres sure effects are the most common. Any com bi na tion of these impacts is pos si ble based on the par tic u lars of the accident.
The fol low ing acci dent descrip tions will dem on strate the rela tion ships between the var i ous explo sion types:
Acci dent No. 1
An exo ther mic reac tion was con ducted in a large batch reac tor. The reac tion tem -per a ture was con trolled by cool ing water, which was sup plied through coils within the reac tor. The reac tants were all flam ma ble. The normal oper at ing tem per a ture of the reac tor was above the normal boil ing point of the reac tants, so the vessel was pres sur ized to keep the reac tants in the liquid state.
Due to an oper a tional prob lem, the cool ing water supply was inter rupted, result ing in an increase in tem per a ture within the reac tor. This caused the reac tion rate to increase and more heat to be gen er ated. The result was a run away reac tion, caus ing the tem per a ture within the reac tor to increase very rapidly.
The pres sure within the reac tor also increased due to the increased vapor pres -sure of the liq uids and the gen er a tion of gas eous prod ucts due to a decom po si tion reac tion. The reac tor vessel was equipped with a spring oper ated relief device, but the relief was under sized. Even tu ally, the pres sure increased beyond the fail ure pres sure of the vessel and it burst catastrophically.
Most of the liquid within the reac tor almost imme di ately flashed to vapor due to the decrease in pres sure. The vapor mixed with air form ing a flam ma ble mix -ture. The hot sur face of a bare lightbulb in an adja cent area pro vided an igni tion source, result ing in a vapor cloud explosion.
In this acci dent, three events occurred: a ther mal run away that devel oped suf -fi cient pres sure to burst the reac tor, caus ing a phys i cal explo sion by rup ture of the vessel and the flash ing of the liquid, and a def la gra tion from the prop a gat ing com -bus tion of the vapor cloud. Damage to the sur round ings was caused by the blast
wave from the ini tial vessel burst, fol lowed by blast wave, ther mal and pro jec tile damage from the vapor cloud explo sion. The ini tial vessel burst may also have caused projectile damage.
Acci dent No. 2 (Clay ton and Grif fin, 1994)
A large stor age vessel in a juice and pack ing plant con tained 66,000 lb of liquified carbon diox ide. The vessel was equipped with an inter nal heat ing coil and a relief device. Sev eral weeks before the acci dent, the heat ing coils failed in the off state, result ing in a very low tem per a ture excur sion of the vessel.
With out warn ing, and with out acti va tion of the relief device, the vessel failed cat a stroph i cally, destroy ing the plant and kill ing three employ ees. The vessel pieces rock eted more than 1000 feet into an adja cent river.
An inves ti ga tion con cluded that on the day of the acci dent the heat ing coils appar ently failed on, result ing in over heat ing and overpressuring of the vessel. It was con jec tured that the relief device did not oper ate since it was plugged with ice—this had been observed in other instal la tions. It was fur ther con cluded that a poor-qual ity weld had been weak ened by the pre vi ous low tem per a ture excur sion and the cat a strophic fail ure was ini ti ated at this weld.
This acci dent involved the phys i cal explo sion of a nonreactive mate rial. The damage from this acci dent was caused by the shock wave from the fail ing vessel fol lowed by rapid flash ing and expansion of the carbon dioxide liquid.
Acci dent No. 3 (USCSHIB, 1998)
An 18,000 gallon stor age tank sup plied pro pane for a turkey farm. At approx i -mately 11 pm two youths were riding an all ter rain vehi cle (ATV) and struck both the vapor and liquid lines from the tank. The liquid line was com pletely sev ered from the tank at a loca tion where it was con nected to a manual shut-off valve directly beneath the tank. An excess flow valve con nected to the liquid line failed to func tion since the line size was too small to pro vide ade quate flow to acti vate it. Escap ing pro pane from the dam aged lines formed a vapor cloud and igni tion occurred a few min utes after the line rup ture. The likely igni tion source was a pro -pane vapor izer about 40 feet away from the tank.
The vol un teer fire depart ment responded and arrived on the scene at 11:21 p.m. The plan was to let the fire burn itself out and at the same time to water down the adja cent build ings to pre vent the spread of the fire. At approx i mately 11:28 the tank exploded. Two fire man located 100 feet away from the tank were killed by a large tank frag ment. Seven others were injured. The tank and asso ci ated piping frag mented into at least 36 pieces.
and the emer gency response pro ce dure by the vol un teer fire depart ment did not pro vide an ade quate hazard zone around the tank.
This is an exam ple of a phys i cal explo sion involv ing a flam ma ble mate rial result ing in a clas sic BLEVE. The fire expo sure weak ened the walls of the vessel and caused it to fail cat a stroph i cally. Damage in this inci dent was due pri mar ily to the result ing fragments.
2.1. Gases and Vapors
Figure 2.2 shows the fire tri an gle describ ing the require ments for a fire of a gas or vapor. The three require ments are fuel, oxi dant and an igni tion source. If all three com po nents are pres ent, a fire/explo sion could result. If any of the three com po -nents are removed, then a fire or explo sion is not pos si ble.
The most common oxi dant for a fire or explo sion is air. Other mate ri als can pro vide oxygen, such as hydro gen per ox ide, perchloric acid, ammo nium nitrate and metal and organic per ox ides. Other mate ri als can take the role of an oxi dizer, includ ing chlo rine and flu o rine. Exo ther mic decom po si tion, with out oxygen, is also pos si ble, for example, with eth yl ene oxide or acetylene.
In the past, fire pro tec tion focused pri mar ily on removal of the igni tion source. Prac ti cal expe ri ence has shown that this approach is not robust enough. Igni tion sources are pres ent almost every where, and it takes very little energy to ignite a flam ma ble gas or vapor. The cur rent prac tice to pre vent fires and explo sions is to con tinue with the elim i na tion of igni tion sources, while focus ing efforts more strongly on pre vent ing flammable mixtures.
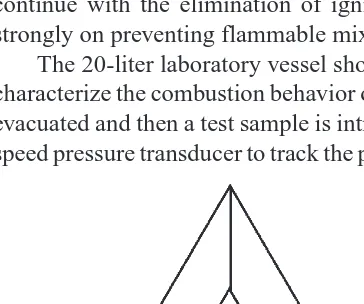
The 20-liter lab o ra tory vessel shown in Figure 2.3 is a typ i cal device used to char ac ter ize the com bus tion behav ior of gases, vapors and dusts. The vessel is first evac u ated and then a test sample is intro duced. The vessel is equipped with a high speed pres sure trans ducer to track the pres sure during the com bus tion pro cess. The
[image:22.504.42.224.401.553.2]2.1. Gases and Vapors 13
mix ture is ignited by an igniter device in the center of the vessel. The igni tion can be achieved by a spark, an explod ing fuse wire, a hot wire or a chemical igniter.
Figure 2.4 is a plot of the pres sure versus time behav ior of this burn ing gas. In this case the gas is methane—although this behav ior is typ i cal for most flam ma ble gases and vapors. After the ini tial igni tion the pres sure rises rap idly to a max i mum
Figure 2.3. An appa ra tus for col lect ing explo sion data for gases and vapors.
pres sure, fol lowed by a much slower decrease in pres sure as the com bus tion prod -ucts are quenched and cooled.
The com bus tion pro cess dem on strated by the pres sure his tory on Figure 2.4 is called a def la gra tion. A def la gra tion is a com bus tion pro cess where the reac tion front moves at a speed less than the speed of sound in the unreacted gases. The reac tion front for a def la gra tion is prop a gated pri mar ily by con duc tion and dif fu -sion of the energy and free rad i cal spe cies into the unreacted gas. This is dis tinct from a det o na tion, where the reac tion front moves faster than the speed of sound in the unreacted gases. For a det o na tion, the reac tion front is prop a gated pri mar ily by com pres sive heat ing of the unreacted gases ahead of the reac tion front. The tech ni cal dif fer ence between a def la gra tion and det o na tion might appear small. How ever, the two types of explo sions have very dif fer ent behav iors, with out -comes that may or may not be the same. These dif fer ences will be discussed in more detail in Section 2.7 on Gas Dynamics.
Def la gra tions are more common than det o na tions in explo sions of flam ma ble vapors or gases. A def la gra tion to det o na tion tran si tion (DDT) is pos si ble under cer tain cir cum stances (see Section 2.7).
Figure 2.5 shows two param e ters that are used to char ac ter ize the explo sive behav ior for deflagrative explo sions. The first vari able is the max i mum pres sure during the unvented com bus tion, Pmax. The second vari able is the max i mum slope of the pres sure curve, (dP/dt)max. Stud ies have shown that the max i mum explo sion pres sure remains essen tially con stant, but the max i mum slope of the pres sure curve (i.e., pres sure rate) decreases as the test volume increases, all other fac tors
2.1. Gases and Vapors 15
being held con stant. The change in pres sure rate is rep re sented by the fol low ing empir i cal formula (Bartknecht, 1981).
K dP
dt V
G =
max / 1 3
(2-1)
The param e ter KG is called the def la gra tion index. The com bus tion is con sid -ered more vio lent the higher the value of the def la gra tion index.
The def la gra tion index is com puted from the data from Figure 2.5 for this oxygen enriched meth ane mix ture as fol lows:
K dP
dt V
G 3
7.6 bar
0.024 s m
=
=
max
/ ( . )
1 3 0 020 1 3/ =86 0. bar m/s
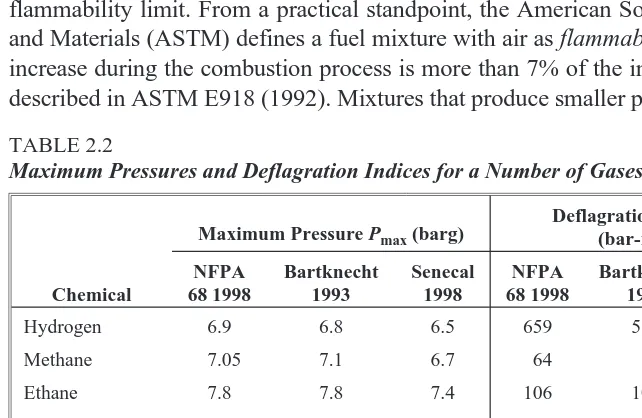
The max i mum pres sure, Pmax, and the def la gra tion index, KG, are impor tant in char ac ter iz ing the behav ior of the com bus tion and in design ing pro tec tion sys -tems. Typ i cal values are shown in Table 2.2. The max i mum pres sure values are fairly con sis tent between research ers. How ever, there is wide vari abil ity in the def la gra tion indi ces reported by dif fer ent inves ti ga tors, most likely the result of sen si -tiv ity to gas com po si tion, humid ity, igni tion strength, etc. (Mashuga and Crowl, 1998). Nei ther the max i mum pres sure nor the def la gra tion index are inher ent phys i cal prop er ties of the chem i cal, but are impor tant quan ti ties derived from specific experimental procedures and conditions.
Figure 2.6 is a plot of the max i mum pres sure, Pmax, as a func tion of meth ane con cen tra tion in air. As the meth ane con cen tra tion decreases, a point is reached
where the con cen tra tion is too lean to sup port com bus tion. This is called the lower flammability limit (LFL). As the meth ane con cen tra tion is increased, a point is reached where the mix ture is too rich in fuel to sup port com bus tion. This is called the upper flammability limit (UFL). The upper and lower flammability limits are also called the upper and lower explo sion limits, UEL and LEL. Note that the flammability limits are nor mally defined with respect to fuel mix tures with air, but they can also be defined for other gas mix tures, such as with oxygen enriched air or even pure oxygen. Flammability limits will differ widely in enriched oxygen atmo spheres or with other oxi dants such as chlo rine. Other inert gases besides nitro gen, such as carbon diox ide or argon, will affect the flammability limits. The limits are nor mally also spec i fied for ambi ent tem per a ture and pres sure. Increased tem per a ture or pres sure will typ i cally expand the flammability limits—some mix -tures which are not flam ma ble at ambi ent tem per a ture and pres sure may become flammable at increased temperature or pressure.
A ref er ence is some times made to a deton able limit, which is the lim it ing con cen tra tion at which a det o na tion can occur in a gas mix ture. These limits are fre quently con fused with explo sion limits. The deton able limits are not well-defined and are highly sen si tive to the spe cific appa ra tus and igni tion source and are not routinely used.
From a tech ni cal stand point, it is dif fi cult to pro vide a pre cise def i ni tion to a flammability limit. From a prac ti cal stand point, the Amer i can Soci ety for Test ing and Mate ri als (ASTM) defines a fuel mix ture with air as flam ma ble if the pres sure increase during the com bus tion pro cess is more than 7% of the ini tial pres sure, as described in ASTM E918 (1992). Mix tures that pro duce smaller pres sure increases
[image:26.504.34.355.350.559.2]2.1. Gases and Vapors 17
TABLE 2.2
Max i mum Pres sures and Def la gra tion Indi ces for a Number of Gases and Vapors
Maximum Pressure Pmax (barg)
Deflagration Index KG
(bar-m/sec) Chemical NFPA 68 1998 Bartknecht 1993 Senecal 1998 NFPA 68 1998 Bartknecht 1993 Senecal 1998
Hydrogen 6.9 6.8 6.5 659 550 638
Methane 7.05 7.1 6.7 64 55 46
Ethane 7.8 7.8 7.4 106 106 78
Butane 8.0 8.0 92 92
Isobutane 7.4 67
Propane 7.9 7.9 7.2 96 100 76
Pentane 7.65 7.8 104 104
Ethylene 8.0 171
Methyl Alcohol 7.5 7.2 75 94
Ethyl Alcohol 7.0 78
(or none at all) are called not flam ma ble. The flammability limits are defined at the fuel con cen tra tions where the pres sure increase is exactly 7%. Other def i ni tions and meth ods (Checkel, Ting et al., 1995) to deter mine the flammability limits are avail able. Flammability limits for a number of common mate ri als are pro vided in Appen -dix C. Flammability limit data are nor mally avail able on mate rial safety data sheets (MSDS) pro vided by the chem i cal man u fac turer. An excel lent sum mary of flammability limits is pro vided by Britton (2002a).
Another dif fi culty in char ac ter iz ing flammability is that the param e ters (flammability limits, def la gra tion index and all other param e ters) are not fun da men tally based. They are actu ally phenomenological descriptors based on a par tic -u lar exper i men tal appa ra t-us and pro ce d-ure. Th-us, the exper i men tal appa ra t-us and pro ce dure frequently becomes the issue.
Other quan ti ties some times reported for gas or vapor com bus tion are the flame speed, fun da men tal burn ing veloc ity, burn ing veloc ity, lam i nar burn -ing veloc ity and tur bu lent burn ing veloc ity. Wide vari abil ity exists in the def i ni -tions and usage of these terms.
Glassman (1996) defines the flame speed as the speed at which the com bus -tion wave moves rel a tive to the unburned gases in the direc -tion normal to the wave sur face. He states that this is also called the burn ing veloc ity, normal com bus tion veloc ity, or flame veloc ity. He also describes sev eral exper i men tal pro ce dures to deter mine flame speeds.
NFPA 68 (1998) defines the fun da men tal burn ing veloc ity as the “burn ing veloc ity of a lam i nar flame under stated con di tions of com po si tion, tem per a ture and pres sure of the unburned gas.”
Grossel (2002) pro vides con sid er ably more detail on these def i ni tions. He states:
Burn ing veloc ity is the speed at which the flame front prop a gates rel a tive to the unburned gas. This dif fers from flame speed. The lam i nar burn ing veloc ity is the speed at which a lam i nar (planar) com bus tion wave prop a gates rel a tive to the unburned gas mix ture ahead of it. The fun da men tal burn ing veloc ity is sim i lar, but gen er ally not iden ti cal to the observed lam i nar burn ing veloc ity. This is because (the fun da men tal burn ing veloc ity) is a char ac ter is tic param e ter refer ring to stan dard ized unburned gas con di tions (nor mally 1 atm and 25°C), and which has been cor rected for nonidealities in the mea sure ment. The tur bu lent burn ing veloc ity exceeds the burn ing veloc ity mea sured under lam i nar con di tions to a degree depend ing on the scale and inten sity of tur bu lence in the unburned gas.
Clearly, care must be exer cised in the usage of these terms.
2.1.1. Flammability Dia gram
For com po si tion effects, a gen eral way to rep re sent the flammability of a gas or vapor is by a tri an gu lar dia gram, as shown in Figure 2.7. Con cen tra tions of fuel, oxygen and inert (in volume or mole %) are plot ted on the three axis. Each apex of the tri an gle rep re sents either 100% fuel, oxygen, or nitro gen. The tick marks on the scales show the direc tion in which the scale moves across the figure. Thus, point A rep re sents a mix ture com posed of 60% meth ane, 20% oxygen and 20% nitro gen. The zone enclosed by the dashed line rep re sents all mix tures which are flam ma ble. Since point A lies out side the flam ma ble zone, a mix ture of this com -po si tion would not be flam ma ble.
The air line on Figure 2.7 rep re sents all pos si ble com bi na tions of fuel plus air. The air line inter sects the nitro gen axis at 79% nitro gen (and 21% oxygen) which is the com po si tion of pure air. The upper and lower flammability limits (in air) are shown as the inter sec tion of the flammability zone bound ary with the air line.
The stoichiometric line rep re sents all stoichiometric com bi na tions of fuel plus oxygen. The com bus tion reac tion can be writ ten in the form,
(1) Fuel + z O2→ Com bus tion prod ucts (2-2)
where z is the stoichiometric coef fi cient for oxygen. The inter sec tion of the stoichiometric line with the oxygen axis (in volume % oxygen) is given by
100 1
z z +
(2-3)
The stoichiometric line is drawn from this point to the pure nitro gen apex.
2.1. Gases and Vapors 19
Expres sion (2-3) is derived by real iz ing that, on the oxygen axis, no nitro gen is pres ent. Thus, the moles pres ent are fuel (1 mole) plus oxygen (z moles). The total moles are thus 1 + z and the mole or volume per cent of oxygen is given by Expres sion (2-3) above.
An impor tant point on Figure 2.7 is the lim it ing oxygen con cen tra tion (LOC), shown as point LOC on the Figure. The LOC is deter mined by draw ing a line just tan gent to the nose of the flammability zone and par al lel to the fuel axis. The LOC is the oxygen con cen tra tion below which fire or explo sion is not pos si ble for any mix tures. The LOC is fre quently called the min i mum oxygen con cen tra tion (MOC), the max i mum oxygen con cen tra tion (MOC), the max i mum safe oxygen con cen tra tion (MSOC), or other names. The LOC depends on the fuel, tem per a ture, pres sure and inert spe cies. Values of the LOC for a number of common mate -ri als are pro vided in Table 2.3. Also shown in the table are LOC values using carbon diox ide as the inert species—these values are different from the nitrogen values.
The shape and size of the flammability zone on a flammability dia gram changes with a number of param e ters, includ ing the fuel, tem per a ture, pres sure and inert spe cies. Thus, the flammability limits and LOC also change with these param e ters.
Appen dix A derives sev eral equa tions that are useful for work ing with flammability dia grams. These results show that:
1. If two gas mix tures, R and S, are com bined, the result ing mix ture com po si tion lies on a line con nect ing the points R and S on the flammability dia -gram. The loca tion of the final mix ture on the straight line depends on the rel a tive moles in the mix tures com bined—if mix ture S has more moles, the final mix ture point will lie closer to point S. This is iden ti cal to the lever rule, which is used for phase dia grams.
2. If a mix ture R is con tin u ously diluted with mix ture S, the mix ture com po -si tion will follow along the straight line between points R and S on the flammability dia gram. As the dilu tion con tin ues, the mix ture com po si tion will move closer and closer to point S. Even tu ally, at infi nite dilu tion, the mix ture com po si tion will be at point S.
3. For sys tems having com po si tion points that fall on a straight line pass ing through an apex cor re spond ing to one pure com po nent, the other two com -po nents are pres ent in a fixed ratio along the entire line length.
4. The LOC can be esti mated by read ing the oxygen con cen tra tion at the inter sec tion of the stoichiometric line and a hor i zon tal line drawn through the LFL (see Appen dix A). This is equiv a lent to the equa tion
LOC = z(LFL) (2-4)
2.1. Gases and Vapors 21
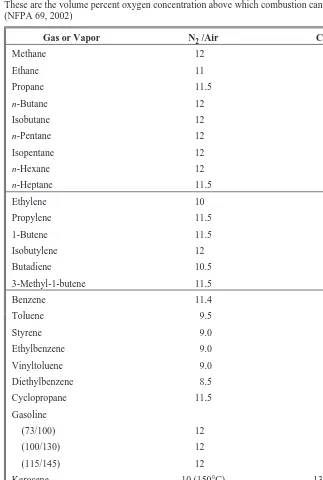
TABLE 2.3
Lim it ing Oxygen Con cen tra tions (LOC)
These are the volume per cent oxygen con cen tra tion above which com bus tion can occur. (NFPA 69, 2002)
Gas or Vapor N2 /Air CO2 /Air
Methane 12 14.5
Ethane 11 13.5
Propane 11.5 14.5
n-Butane 12 14.5
Isobutane 12 15
n-Pentane 12 14.5
Isopentane 12 14.5
n-Hexane 12 14.5
n-Heptane 11.5 14.5
Ethylene 10 11.5
Propylene 11.5 14
1-Butene 11.5 14
Isobutylene 12 15
Butadiene 10.5 13
3-Methyl-1-butene 11.5 14
Benzene 11.4 14
Toluene 9.5 —
Styrene 9.0 —
Ethylbenzene 9.0 —
Vinyltoluene 9.0 —
Diethylbenzene 8.5 —
Cyclopropane 11.5 14
Gasoline
(73/100) 12 15
(100/130) 12 15
(115/145) 12 14.5
Kerosene 10 (150°C) 13 (150°C)
JP-1 fuel 10.5 (150°C) 14 (150°C)
JP-3 fuel 12 14.5
JP-4 fuel 11.5 14.5
Natural gas 12 14.5
n-Butyl chloride 14 —
12 (100°C) —
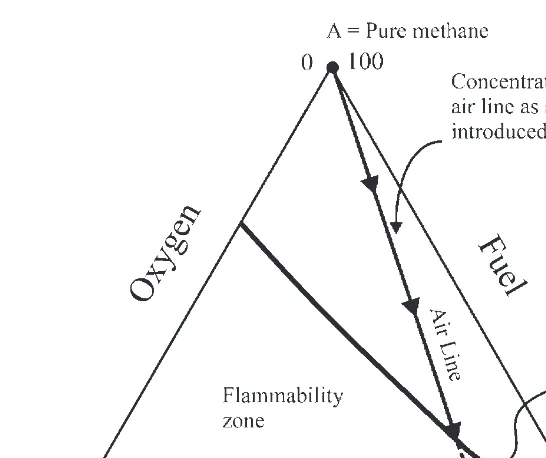
Flammability dia grams are very useful to track the gas com po si tion during a pro cess oper a tion to deter mine if a flam ma ble mix ture exists during the pro ce dure. For exam ple, con sider a stor age vessel con tain ing pure meth ane whose inside walls must be inspected as part of its peri odic main te nance pro ce dure. For this oper a tion, the meth ane must be removed from the vessel and replaced by air for the inspec tion work ers to breathe. The first step in the pro ce dure is to depressurize the vessel to atmo spheric pres sure. At this point the vessel con tains 100% meth ane, rep re sented by point A on Figure 2.8. If the vessel is now opened, and air allowed to enter, the com po si tion of gas within the vessel will follow the air line on Figure 2.8 until the vessel gas com po si tion even tu ally reaches point B, pure air. Note that at some point in this oper a tion the gas com po si tion passes through the flammability zone. If an igni tion source of suf fi cient strength were present, then a fire or explosion would result.
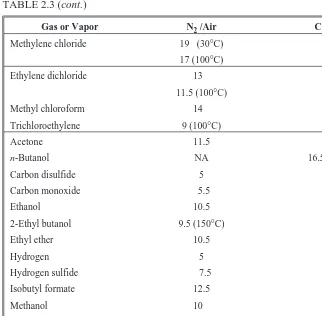
TABLE 2.3 (cont.)
Gas or Vapor N2 /Air CO2 /Air
Methylene chloride 19 (30°C) —
17 (100°C) —
Ethylene dichloride 13 —
11.5 (100°C) —
Methyl chloroform 14 —
Trichloroethylene 9 (100°C) —
Acetone 11.5 14
n-Butanol NA 16.5 (150°C)
Carbon disulfide 5 7.5
Carbon monoxide 5.5 5.5
Ethanol 10.5 13
2-Ethyl butanol 9.5 (150°C) —
Ethyl ether 10.5 13
Hydrogen 5 5.2
Hydrogen sulfide 7.5 11.5
Isobutyl formate 12.5 15
Methanol 10 12
Methyl acetate 11 13.5
Methyl ether 10.5 13
Methyl formate 10 12.5
Methyl ethyl ketone 11 13.5
[image:31.504.21.343.49.365.2]The pro ce dure is reversed for plac ing the vessel back into ser vice. In this case the pro ce dure begins at point B on Figure 2.8, with the vessel con tain ing air. If the vessel is closed and meth ane pumped in, then the gas com po si tion inside the vessel will follow the air line and end up at point A. Again the mix ture is flam ma ble as the gas com po si tion moves through the flammability zone.
An inerting pro ce dure can be used to avoid the flammability zone for both cases. This will be dis cussed in more detail in Sec tion 3.4 on Inerting and Purg ing.
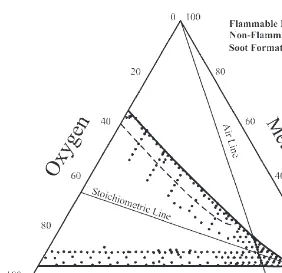
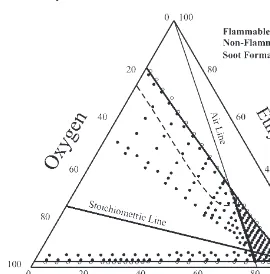
The deter mi na tion of a com plete flammability dia gram requires sev eral hun -dred tests using the device shown in Figure 2.3. Dia grams with exper i men tal data for meth ane and eth yl ene are shown in Fig ures 2.9 and 2.10, respec tively. Data in the center region of the flammability zone are not avail able since the max i mum pres sure exceeds the pres sure rating of the vessel or unsta ble com bus tion or a tran si tion to det o na tion is observed here. For these data, a mix ture is con sid ered flam -ma ble if the pres sure increase after igni tion is greater than 7% of the orig i nal ambi ent pres sure, in accor dance with ASTM E918 (1992). Note that many more data points are shown than required to define the flammability limits. This was done to obtain a more com plete under stand ing of the pres sure versus time behav -ior of the com bus tion over a wide range of mix tures. This infor ma tion is impor tant for mitigation of the explosion, should it occur.
2.1. Gases and Vapors 23
[image:32.504.55.328.38.267.2]A number of fea tures are shown on Fig ures 2.9 and 2.10. First, the flammability zone is much larger for eth yl ene than methane—the upper flammability limit of eth yl ene is cor re spond ingly higher. Second, the com bus tion pro duces copi ous amounts of soot in the upper, fuel-rich parts of the flammability zone. Finally, the lower bound ary of the flammability zone is mostly hor i zon tal and can be approx i mated by the LFL.
For most sys tems, detailed exper i men tal data of the type shown in Figure 2.9 or 2.10 are unavail able. Sev eral meth ods have been devel oped to approx i mate the flammability zone:
Method 1:
Shown by Figure 2.11
[image:33.504.41.323.35.308.2]Given: Flammability limits in air, LOC, flammability limits in pure oxygen
Pro ce dure:
1. Draw flammability limits in air as points on the air line.
2. Draw flammability limits in pure oxygen as points on oxygen scale. 3. Use Equa tion (2-3) to locate the stoichiometric point on the oxygen axis
and draw the stoichiometric line from this point to the 100% nitro gen apex. 4. Locate the LOC con cen tra tion on the oxygen axis and draw a line par al lel to the fuel axis until it inter sects with the stoichiometric line. Draw a point at this inter sec tion.
5. Con nect all the points shown.
The flammability zone derived from this approach is only an approx i ma tion of the actual zone. Note that the lines defin ing the zone limits on Fig ures 2.9 and 2.10 are not exactly straight. This method also requires flammability limits in pure oxygen—data that might not be readily avail able. Flammability limits in pure oxygen for a number of common hydro car bons are pro vided by Table 2.4.
[image:34.504.59.329.33.307.2]2.1. Gases and Vapors 25
Figure 2.11. Method 1 for the approx i ma tion of the flammability zone.
TABLE 2.4
Flammability Limits in Pure Oxygen (Lewis and Von Elbe, 1987)
Limits of Flammability in Pure Oxygen Compound Formula Lower Upper
Hydrogen H2 4.0 94
Deuterium D2 5.0 95
Carbon monoxidea CO 15.5 94
Ammonia NH3 15.0 79
Methane CH4 5.1 61
Ethane C2H6 3.0 66
Ethylene C2H4 3.0 80
Propylene C3H6 2.1 53
Cyclopropane C3H6 2.5 60
Diethyl ether C4H10O 2.0 82
Divinyl ether C4H6O 1.8 85
[image:35.504.23.344.335.537.2]Method 2:
Shown by Figure 2.12.
Given: Flammability limits in air, LOC
Pro ce dure: Use steps 1, 3 and 4 from Method 1. In this case, only the points at the nose of the flammability zone can be con nected. The flammability zone from the air line to the oxygen axis cannot be detailed with out addi tional data, although it extends all the way to the oxygen axis and typ i cally expands in size. The lower bound ary can also be approx i mated by the LFL.
Method 3:
Shown by Figure 2.13.
Given: Flammability limits in air
Pro ce dure: Use steps 1 and 3 from Method 1. Esti mate the LOC using Equa tion (24). This is only an esti mate, and usu ally (but not always) pro vides a con ser -va tive LOC.
For meth ods 2 and 3, only the flammability zone to the right of the air line can be drawn. As will be seen later, this is the por tion of the flammability dia gram that rep re sents those sit u a tions most com monly encoun tered in pre vent ing fires and explo sions.
[image:36.504.61.327.281.525.2]2.1. Gases and Vapors 27
2.1.2. Esti mat ing Flammability Limits
Appen dix C con tains flammability limit data for a number of common mate ri als. These limits were deter mined using a number of exper i men tal meth ods. It is always rec om mended that the flammability limits be deter mined under con di tions as close as pos si ble to actual pro cess con di tions.
In many cases such data are dif fi cult to obtain, or an imme di ate esti mate is required for screen ing pur poses. Sev eral meth ods are avail able to esti mate both the upper and lower flammability limits. These meth ods are sat is fac tory for most common hydrocarbons—their appli ca bil ity to other mate ri als has not been con -firmed. Com par i son of the pre dicted results with the actual data shows that the meth ods work better for the lower flammability limit than for the upper. The upper limit is typ i cally more dif fi cult to pre dict since more com plex reaction chemistry occurs here.
Jones (1938) found that for many hydro car bons, the upper and lower flammability limits are approx i mated by
LFL = 0.55Cst (2-5)
[image:37.504.64.328.38.284.2]UFL = 3.5Cst (2-6)
where LFL and UFL are the lower and upper flammability limits, respec tively (volume % fuel in air), and Cst is the stoichiometric con cen tra tion of fuel in air.
For the com bus tion reac tion writ ten by the stoichiometric equa tion,
CmHxOy + z O2→m CO2 + (x/2) H2O (2-7)
it fol lows that the stoichiometric coef fi cient, z, is given by,
z = m + x/4 – y/2 (2-8)
where z has units of moles O2/mole fuel.
The stoichiometric per cent age con cen tra tion in air is given by,
C
C
st
st
moles fuel moles fuel + moles air
m = × = + 100 100
1 oles air moles fuel
1 mole air 0.21 mole
= + 100 1
(
)
Omoles O moles fuel 2 2 st = + C z 100
1 / .0 21 (2-9)
where the number 0.21 rep re sents the oxygen con tent in air.
Sub sti tut ing z from Equa tion (2-8) into Equa tion (2-9), and sub sti tut ing the result into Equa tions (25) and (26), results in the fol low ing equa tions for esti mat -ing the flammability limits.
LFL = 0.55(100)
4 76. m+119. x−2 38. y+1 (2-10)
UFL = 3.5(100)
4 76. m+119. x−2 38. y+1 (2-11)
Another method (Suzuki, 1994; Suzuki and Koide, 1994) cor re lated the flammability limits as a func tion of the heat of com bus tion of the fuel. A good fit was obtained for 112 organic mate ri als con tain ing carbon, hydro gen, oxygen, nitro gen and sulfur. The result ing cor re la tions are,
LFL = c
c c2
−
+ + +
3 42
0 569 0 0538 180
.
H H H
∆ . ∆ . ∆ . (2-12)
UFL = 6.30∆Hc+0 567. ∆Hc2 +235. (2-13)
where LFL and UFL are the lower and upper flammability limits, respec tively (volume % fuel in air), and ∆Hc is the heat of com bus tion for the fuel, in 103 kJ/mol.
Equa tion (2-13) is appli ca ble only over the UFL range of 4.9% to 23%. If the heat of com bus tion is pro vided in kcal/mole, it can be con verted to kJ/mol by mul -ti ply ing by 4.184.
The pre dic tion capa bil ity of Equa tions (2-5) through (2-13) is only modest, at best. For hydro gen the pre dic tions are poor. For meth ane and the higher hydro car -bons the results are improved. Thus, these meth ods should only be used for a quick ini tial esti mate, and should not replace actual exper i men tal data.
Flammability limits can also be esti mated using cal cu lated adi a batic flame tem per a tures (CAFT) (Hansel, Mitch ell et al., 1991; Melhem, 1997). The pro ce -dure for cal cu lat ing the adi a batic flame tem per a ture is described in Sec tion 2.6 on Kinet ics and Thermochemistry. It is based on the prem ise that the flammability limits are mostly ther mal in behav ior and are not highly depend ent on kinet ics. A typ i cal adi a batic flame tem per a ture of 1200K is used to define the flammability limits, although other values are used depend ing on whether more or less con ser -va tive results are required. The CAFT approach is capa ble of esti mat ing the flammability behav ior for any mix ture of gases, includ ing air. Thus, it is pos si ble to esti mate the entire flammability zone in a tri an gle dia gram using this approach. Unfor tu nately, this has not been extensively studied as of this writing.
Britton (2002b) pro posed using a heat of oxi da tion to esti mate flammability limits. The heat of oxi da tion is defined as the heat of com bus tion divided by the stoichiometric ratio for oxygen. Britton found that the heat of oxi da tion can be cor -re lated with the flammability limits for hydro car bons.
2.1.3. Tem per a ture Effect on Flammability
In gen eral, the size of the flammability zone shown in Figure 2.7 increases with increas ing tem per a ture. For mix tures in air, the UFL increases and the LFL decreases, broad en ing the range over which the mix ture is flam ma ble. Some mate -ri als (such as decane) which are not flam ma ble at ambi ent con di tions may become flam ma ble at increased tem per a ture.
A set of empir i cal equa tions to esti mate the effect on the flammabiltiy limits with tem per a ture are avail able (Zabetakis, Lambiris et al., 1959)
LFL LFL
c
T = 25 − H T−
0 75 25 . ( ) ∆ (2-14) UFL UFL c T H T
= 25+ −
0 75 25 .
( )
where LFLT is the lower flammability limit at tem per a ture T (volume % fuel in air)
LFL25 is the lower flammability limit at 25°C (volume % fuel in air) ∆Hc is the heat of com bus tion of the fuel (kcal/mole)
T is the tem per a ture (°C)
UFLT is the upper flammability limit at tem per a ture T (volume % fuel in air)
UFL25 is the upper flammability limit at 25°C (volume % fuel in air).
2.1.4. Pres sure Effect on Flammability
In gen eral, pres sure has little effect on the LFL, except at low pres sures (below about 50 mm Hg for most vapors) where com bus tion is not pos si ble. The UFL gen er ally increases as the pres sure increases and decreases as the pres sure decreases. As the pres sure increases the flammability range gen er ally increases. Some mate ri als (such as jet fuel) which are not flam ma ble at ambi ent pres sure may become flam ma ble at increased pres sure.
An empir i cal expres sion to esti mate the change in upper flammability limit with pres sure is avail able (Zabetakis, 1965)
UFLP = UFL + 20.6(log P + 1) (2-16)
where UFLPis the upper flammability limit at pres sure P (volume % fuel in air), UFL is the upper flammability limit at 1 atm (volume % fuel in air), and P is the pres sure (mega Pas cals abso lute).
2.1.5. Flammability of Gas eous Mix tures
The flam ma ble behav ior of mix tures of gases is not com pletely under stood at this time—it is best to deter mine this behav ior exper i men tally under con di tions as close as pos si ble to pro cess con di tions.
There are two meth ods com monly used to esti mate the flammability limits of mix tures.
The first method is called Le Chatelier’s rule (Le Chatelier, 1891). The fol low -ing empir i cal equa tions for the flammability limits are pro vided.
LFL LFL mix = = −
∑
yii i n 1 1 (2-17) UFL UFL mix = = −
∑
yii i n 1 1 (2-18)
where LFLmix is the lower flammability of the mix ture (volume % fuel in air) LFLi is the lower flammability limit for flam ma ble spe cies i (volume
% fuel in air)
UFLmix is the upper flammability limit of the mix ture (volume % fuel in air)
UFLi is the upper flammability limit for flam ma ble spe cies i (volume % fuel in air)
yi is the mole frac tion for flam ma ble spe cies i on a flam ma ble spe cies basis
Le Chatelier’s rule pro vides flammability limit esti mates that are close to exper i men tal values for many simple hydro car bons, but has no fun da men tal basis. The method applies only to mix tures with air.
The second approach uses the cal cu lated adi a batic flame tem per a ture (CAFT) method dis cussed in Sec tion 2.1.2 and in more detail in Sec tion 2.6 on Kinet ics and Thermochemistry. In this case, a com mer cial equi lib rium soft ware pack age is rec om mended to per form the exten sive cal cu la tions since the number of spe cies involved is typically large.
2.1.6. Min i mum Igni tion Ener gies
The min i mum igni tion energy (MIE) is defined as the “min i mum amount of ther mal energy released at a point in a com bus ti ble mix ture that will cause indef i -nite flame prop a ga tion away from that point, under spec i fied test con di tions” (NFPA 68, 1998). The igni tion of a flam ma ble mate rial is a com plex sub ject which is dis cussed in more detail else where (Lewis and von Elbe, 1987; Glassman, 1996). Using a sim plis tic anal y sis, ade quate energy must be pro vided to a small volume of flam ma ble mass over a short enough period of time to increase the tem -per a ture to the point where the reac tion gen er ates enough energy to sus tain itself. Since com plex chain branch ing reac tions are pos si ble, a time delay or induc tion time might be exhib ited.
The MIE depends on the spe cific chem i cal or chem i cals, con cen tra tions, pres -sure, tem per a ture and the mode of igni tion. For a spark igni tion, the MIE depends also on the spark gap size and the dura tion of the spark. Thus, from a prac ti cal stand point, the MIE is dif fi cult to char ac ter ize and is highly depend ent on the exper i men tal con fig u ra tion. Lim ited MIE data are avail able and con sid er able vari -a tion between rese-arch ers is noted. T-able 2.5 pro vides MIE d-at-a for -a number of common com bus ti ble gases. More infor ma tion is pro vided else where (Lewis and von Elbe, 1987; Glassman, 1996).
In gen eral, the fol low ing state ments apply to prac ti cal usage,
• For flam ma ble gases in air, the lowest MIE (LMIE) is found near the stoichiometric con cen tra tion (but not nec es sar ily at the stoichiometric con -cen tra tion) and the MIE increases as the fuel con -cen tra tion increases or decreases from the LMIE value (Britton, 1999).
• For most flam ma ble dusts, a typ i cal value for the MIE is about 10 mJ, although wide vari abil ity is expected depend ing on dust type, par ti cle size, etc. • As the tem per a ture increases, the MIE decreases.
• As the pres sure increases, the MIE decreases.
• An increase in inert gas con cen tra tion increases the MIE.
The most impor tant con cept to remem ber is that the energy required to ignite a flam ma ble gas or vapor is very low. The MIE of 0.25 mJ rep re sents the kinetic energy con tained in a small coin as it impacts a sur face after being dropped from a
[image:42.504.34.354.61.386.2]2.1. Gases and Vapors 33
TABLE 2.5
Min i mum Igni tion Energy (MIE) for Selected Gases (Glassman, 1996)
Chemical Minimum Ignition Energy (mJ)
Acetylene 0.020
Benzene 0.225
1,3-Butadiene 0.125
n-Butane 0.260
Cyclohexane 0.223
Cyclopropane 0.180
Ethane 0.240
Ethene 0.124
Ethylacetate 0.480
Ethylene oxide 0.062
n-Heptane 0.240
Hexane 0.248
Hydrogen 0.018
Methane 0.280
Methanol 0.140
Methyl acetylene 0.120
Methyl ethyl ketone 0.280
n-Pentane 0.220
2-Pentane 0.180