Physico-Chemical Changes in Ready to Eat Pineapple
Chicken Curry during Frozen Storage
Kappat Valiyapeediyekkal Sunooj1, Kolpe Radhakrishna2
1Department of Food Science & Technology, Pondicherry University, Puducherry, India; 2Defence Food Research Laboratory, Freeze-Drying and Animal Products Technology Division, Mysore, India.
Email: [email protected]
Received July 4th, 2012; revised August 4th, 2012; accepted August 12th, 2012
ABSTRACT
RTE Pineapple chicken curry, a traditional Kerala recipe, was prepared and standardized by using de-boned broiler meat chunks, pineapple and spices. The product having both meat and gravy (1:1.9) was packed in polyethylene pouches and stored at −18˚C ± 2˚C for 6 months. During frozen storage, the free fatty acid (FFA) values were 0.28 - 0.46 (as percentage oleic acid) and thiobarbituric acid (TBA) values were 1.68 - 2.45 (mg of malonaldehyde/Kg of sample) increased in both meat and gravy. Meat and gravy pH were in the range of 5.5 to 6. Marginal decrease in shear force values (43.4 - 39.6 N) were also observed. During storage the SPC was found to be decreasing over period of stor- age (100, 40, 20, <10 respectively). Psychrophiles were within acceptable limit and pathogens were absent. Microbi- ological data showed that the product was microbiologically safe. The sensory score indicated that the RTE pineapple chicken curry is acceptable after storage at −18˚C ± 2˚C for 6 months.
Keywords: Chicken Curry; Pineapple; Frozen Storage; GC
1. Introduction
Globally several chicken recipes are very popular. Indian traditional meat based recipes are well known for its delicious and appetizing taste worldwide, but these foods require number of unit operations and long preparation time [1]. In order to minimize the tedious operations involved in preparation of food and to save time in- cluding all the required nutrition and to fulfill satiety of consumer especially for working population there is a need to develop several products that involve minimum processing. Ready to eat product has a budding industry in India and overseas, since needs of population is changing with time. Quality and safety of food is a major concern of both consumer and manufacturer that is in- fluenced by several factors.
Indians have a variety of meat preparations that involves profuse use of spices that adds to the flavor as well as imparts antioxidant, antibacterial and various other functional roles. There are a number of products that vary in terms of preparation, kinds of meat, spices etc. Selection of suitable packaging material has been a great area of interest in order to maintain the shelf life and produce better products. Foods that have a short shelf life are processed for longer shelf life in variety of packaging materials such flexible films, multilayer packages, glass, cans etc. Canned products are available
in market but has several limitations such as metal imparts an undesirable taste to the product during storage, is an expensive method and prone to a high incidence of leakage through seams [2]. Similarly retort pouches also need an additional processing before storage that adds to the cost but has an advantage that can be stored at room temperature for several months. Hence in the present study polythene pouches were used for packaging the product that were of low cost and also maintained the quality of food at frozen storage without any damage to the packaging material that usually is seen with other polymer materials such as polypropylene. Anon [3] suggested that curry products can be frozen and marketed in polythene pouches. Changes in quality during chilled or frozen storage have been studied in cod and haddock fillets [3], muscle of volador [4], buffalo meat burgers [5], chicken nuggets [6,7] etc.
person staying alone. These days a number of RTE are already available in market but still there is a need of proper marketing and awareness among the consumer for judicial utilization of upcoming technology and im- proved products so that both the consumer and the manufacturer can be benefited. Changes in the physico- chemical quality of product were also determined in the course of technological processes of freezing and during storage of frozen products.
2. Materials and Methods
2.1. Preparation of RTE Pineapple Chicken Curry
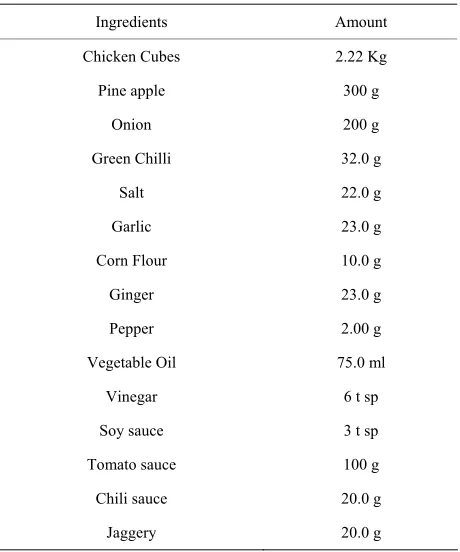
Broiler chicken of 6 - 8 weeks age were procured from the local market, dressed conventionally and were brought to the FD-APT division lab, Mysore, India. On the day of preparation, the carcasses (1.10 to 1.20 kg) were washed under running tap water and deboned. Breast and leg muscles were cut into cubes of 2 - 3 cm and were marinated in curd for 1 - 2 hours. This was cooked for 10 - 15 min at 95˚C - 100˚C and cooled to 30˚C - 40˚C. The ingredient composition for the prepara- tion of RTE pineapple chicken curry is given in Table 1. Cooking oil was heated in a stainless steel vessel to 110˚C - 120˚C, added clove, cinnamon and cardamom and roasted for 1 - 2 minutes. Sliced onion, ginger, garlic, coriander leaves and green chillies were added and sau- téd till light golden colour. Then added tomato puree, red chilli powder, coriander powder, turmeric powder, salt and pineapple cubes and cooked for 4 min on low flame. To this gravy mix, added cooked chicken cubes along with cooked out juice and mixed well. This was further heated for 5 min at 85˚C - 90˚C. The product cooled to 30˚C - 40˚C for 40 - 50 min and separated the meat chunks from gravy.
The product was packaged in polythene pouches (300 gauge) with 100 g meat and 250 g gravy in each pouch. The sealed packets placed in wax coated carton and fro- zen in a plate freezer until the product temperature reached −45˚C to −60˚C (115 - 125 min). A digital tem- perature recorder with metallic probes (Aptec, Chennai, India) was used to ensure adequate temperature decline of the product. The frozen product was then stored at a freezer maintained at −18˚C ± 2˚C.
2.2. Quality Evaluation
Physical, chemical and microbiological studies were conducted for 6 months of frozen storage. The product was thawed at 26˚C ± 2˚C for 30 min and was subjected to the following analyses.
2.2.1. Physical and Chemical Parameters
[image:2.595.309.539.110.386.2]Separated the meat chunks and gravy and homogenized
Table 1. Ingredients composition of pineapple chicken curry.
Ingredients Amount
Chicken Cubes 2.22 Kg
Pine apple 300 g
Onion 200 g
Green Chilli 32.0 g
Salt 22.0 g
Garlic 23.0 g
Corn Flour 10.0 g
Ginger 23.0 g
Pepper 2.00 g
Vegetable Oil 75.0 ml
Vinegar 6 t sp
Soy sauce 3 t sp
Tomato sauce 100 g
Chili sauce 20.0 g
Jaggery 20.0 g
in a mixer for sampling. Proximate composition and NaCl content in chicken chunks and gravy were deter- mined [8]. FFA, pHand TBA of both chicken chunks and gravy were determined periodically during the storage period. Free fatty acid (FFA) [7] and thiobarbituric acid (TBA) were determined by aqueous extraction procedure [9] and pH by immersing a glass calomel electrode di- rectly into the sample using a pH meter (Cyberscan 1000, Eutech Instruments, Singapore). Shear values were meas- ured in a Lloyds Texturometer (LR5K, Lloyd Instru- ments Ltd., Hampshire, UK) in 100 kg load cell at a speed of 50 mm/min with a 1 mm thick blade using chicken chunks of 1 × 1 × 1.5 cm strips.
2.2.2. Free Fatty Acid Content (FFA)
The FFA content of the samples was estimated as per AOAC (1990) [8]. The FFA content of the samples was estimated as per AOAC (1990). A known quantity of fat extracted was taken in to a 100 ml flask and 50 ml of hot neutralised alcohol was added followed by 1 - 2 ml of phenolphthalein reagent. The flask was shaken vigor- ously to dissolve all the fat content and titrated against 0.25 N NaOH solutions to get a faint pink colour. From the titre value FFA content was calculated as follows:
Free Fatty Acid % as Oleic acidml of alkali of alkali 28.2 Weight of fat g
N
2.2.3. Thiobarbituric Acid Reactive Substance (TBARS) Determination
TBARS values in meat/poultry samples were determined as per Taraldgis method [10]. Taraldgis method (1960) is one of the most widely used tests to evaluate the extent of lipid oxidation in meats. This is based on the reaction between important oxidation product malnaldehyde with TBA reagent to produce a colour complex. The chro- mogen results from the condensation of two molecules of TBA with one molecule of malonaldehyde.
20 g of blended sample was accurately weighed and transferred into a RB flask. To that 2.5 ml of conc. HCl was added along with 97.5 ml of distilled water. pH was adjusted to 1.5. Mixture was steam distilled and 50 ml distillate was collected in 10 min. From this 25 ml of distillate was transferred into stoppered glass tubes and 5 ml of TBA reagent was added. The test tubes were kept in boiling water bath for 35 min and it was cooled and OD was measured at 538 nm. The TBARS values were calculated using the standard curve.
2.2.4. Total Fatty Acid Analysis by Gas Chromatography
2.2.4.1. Esterification of Fatty Acids
The samples were esterified as per the procedure of Metcalfe et al. [11] with slight modifications.
About 150 mg of lipid was accurately weighed into a clean and dry stoppered test tube. 4 ml of 0.5 N alcoholic sodium hydroxide solutions was added and heated for 5 min over a water bath at 90˚C. On cooling 5 ml of Boron trifluoride-methanol reagent (14%) was added and heated for 5 min at 90˚C over a water bath, followed by addition of 10 ml of saturated sodium chloride solution. The sam- ples were thoroughly cooled to room temperature and 5 ml of hexane was added to each tube. It was shaken well and kept undisturbed. The upper hexane layer was drawn out into clean dry conical flask and dried over anhydrous sodium sulphate to remove the traces of moisture if pre- sent. The samples were filtered and transferred to stop- pered clean dry tubes for gas chromatographic analysis.
2.2.4.2. Quantification of Fatty Acid Analysis by Gas Chromatography
Analysis of total fatty acids was carried out by ceres 800, Chemito model Gas chromatograph fitted with BPX 70 column (25 mt, 0.32 mm ID) and flame ionisation detec- tor. Temperature gradient programming was employed from 150˚C to 220˚C. Split ratio was adjusted to 1:25 and capillary flow of carrier 2 ml/min. Injector and detector port temperatures were adjusted as 230 and 240 respec- tively. For FID, Hydrogen and Oxygen was used and the flow was adjusted as 45 ml/min and 45 ml/min respec- tively. Along with samples standard esters of fatty acids were also injected and the fatty acids were detected by
comparing the retention time of the standard esters of fatty acids. The quantification of the fatty acids was car- ried out by evaluating with the standard fatty acid esters area corresponding to each peak in the chromatogram. Iris 32 software is used to integrate and evaluate the chromatogram in the analysis.
2.2.5. Microbiological Quality
Chicken chunks in the curry were cut using a sterile knife and mixed with the gravy. Placed a 50 g sample of the mixture in a sterile stomacher bag containing 450 ml sterile saline (0.85% NaCl) solution and blended in a stomacher (Seward Stomacher 400, Seward Medical, London, UK). The blended samples were tested for stan-dard plate counts (SPC), coliforms, yeast and mould (Y&M), srtaphylococci, salmonella and E. coli by pour plate method [12].
2.2.6. Sensory Quality
Packets of RTE chicken curry was thawed by holding them at 26˚C ± 2˚C and warmed the product in a hot pan maintained at 80˚C - 90˚C for 3 - 4 min. The coded sam- ples were subjected to sensory evaluation by 10 in-house trained panelists using a 9-point hedonic scale [6,13] and recorded the mean score of each attribute (colour, flavor, mouthfeel, consistency of the gravy, meat texture and overall acceptability).
2.3. Statistical Analysis
Statistical analysis was performed with SPSS software (SPSS Inc., 1996) and used to test the significant effect of various parameters at 5% level of significance (P > 0.05). Each test was performed in replication of three.
3. Results and Discussion
3.1. Physical and Chemical Quality
In the present RTE recipe pineapple used were different from other regular chicken curry recipe. Pineapple had certain advantages and made the recipe much more ac- ceptable. Pineapple has exceptional juiciness that added to the curry and vibrant flavor with several health bene- fits. The enzyme bromelain present enhanced the texture of chicken by tenderizing and maintained it for longer also the highly acidic nature of fruit lowered the pH thus extending the shelf life. Chicken chunks were found to have less moisture, fat, ash and salt compared to gravy i.e.
69.40%, 11.08%, 1.80% and 1.58% respectively in chunks whereas in gravy a higher values were observed
i.e. 74.5%, 13.43%, 1.9% and 1.8% respectively. The
tein content in chunks (19.43%) thus curry had a signifi- cant lower value for protein i.e. 2.7%. The physio-che-
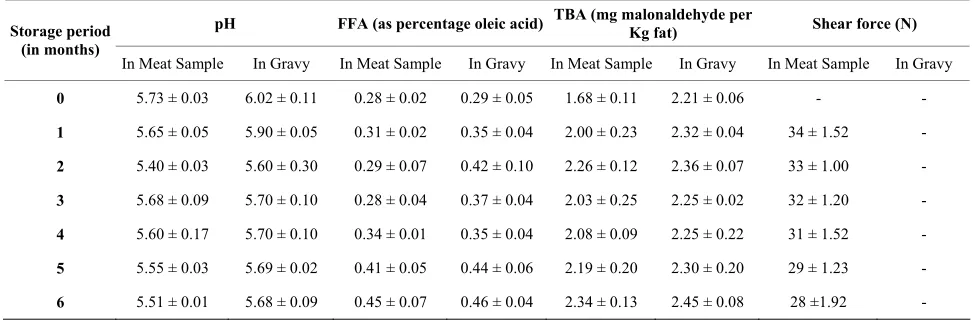
mial changes during frozen storage of pineapple chicken curry were depicted in Table 2. There was marginal fall in the pH (Table 2) of meat and gravy from 5.7 to 5.51 and 6.02 to 5.68 respectively during 6 months of frozen storage. FFA values (as % of oleic acid) were increased marginally from 0.28 to 0.453 in meat and 0.29 to 0.46 in gravy during frozen storage for 6 months(Table 2).
Lipase activity has been reported as the cause of increased FFA values in meat products during storage by many authors. But the increase in FFA did not increase the rancidity in pork sausages [14,15], fried chicken [16], buffalo meat burgers [6] and chicken nuggets [7]. In- creased level of FFA does not cause any toxicological effects [17].
TBA is a measure of oxidative rancidity of the product. TBA values (mg of malonaldehyde/kg sample) fluctuated non-significantly between 1.68 and 2.64 for meat and 2.21 and 2.45 for gravy during the storage period (Table 2). This effect is attributed to the very low temperature storage and the antioxidant effect of the spices used [18-20].
A significant (P ≤ 0.05) increase in TBA value during frozen storage was reported in chicken nuggets [6,21], Iberian ham [22] (Martin et al., 2000), and fish fingers
[23] and buffalo meat burgers [2003]. Wang et al. [24]
has reported TBA values of around 2.0 in fresh chicken meat after vacuum packaging and storage for 7 weeks at 7˚C.
3.2. Texture
The shear values for meat pieces observed a marginal decrease (17.64%) during 6 month frozen storage (Table 2), indicating that the freezing and storage in frozen con- dition has little effect on the textural qualities of meat in the curry. Initially, the samples required higher shear
force i.e. 34 N but during storage the force decreased to
28 N. This decrease in shear force can be attributed to both cooking and freezing process. Combes et al. [25]
suggested that with advancement in cooking process several changes occur due to heat application as well as mechanical properties are influenced. Similarly, freezing also leads to textural changes as during the process of freezing ice crystals are formed in between the fibres that causes stretching and ruptures of connective tissues thus inducing higher tenderization. Hence there is a decrease in shear force values during freezing. Also, Shanks et al.
[26] have reported that tenderization in meat is highly dependent on freezing rate, storage temperature and fro- zen storage duration that affect the amount of intracellu- lar crystal formation and physical disruption occurring in muscle.
3.3. Microbiological Quality
Various microbiological tests were carried out have shown that freshly prepared chicken curry (before freezing) had microbial counts of 1 × 10² and 2 × 101 (in
log cfu/g) for SPC, yeasts and molds respectively (Table 3). Banwart [27] suggested that microbial specifications for cooked poultry products should be in the range of 4 - 5 log cfu/g for aerobic plate counts. During freezing mi- crobes become dormant thus, there is limited or no microbial spoilage at low temperature [28]. Studies have revealed that beef frozen for up to 90 days did not spoiled due to microbial growth [29]. S. aureus, coliform,
salmonella and E. coli could not be detected in these
products.
After a period of 6 months a decrease in both SPC and yeasts & molds count were observed to <10 and 10 re- spectively that can be due to decrease in pH that was observed with an increase in storage period. Absence of
S. aureus, coliform, salmonella and E. coli can be con-
[image:4.595.54.542.564.724.2]tributed by thermal processing initially followed by hy-
Table 2. Changes in physicochemical quality of chunks and gravy.
pH FFA (as percentage oleic acid) TBA (mg malonaldehyde per Kg fat) Shear force (N) Storage period
(in months)
In Meat Sample In Gravy In Meat Sample In Gravy In Meat Sample In Gravy In Meat Sample In Gravy
0 5.73 ± 0.03 6.02 ± 0.11 0.28 ± 0.02 0.29 ± 0.05 1.68 ± 0.11 2.21 ± 0.06 - -
1 5.65 ± 0.05 5.90 ± 0.05 0.31 ± 0.02 0.35 ± 0.04 2.00 ± 0.23 2.32 ± 0.04 34 ± 1.52 -
2 5.40 ± 0.03 5.60 ± 0.30 0.29 ± 0.07 0.42 ± 0.10 2.26 ± 0.12 2.36 ± 0.07 33 ± 1.00 -
3 5.68 ± 0.09 5.70 ± 0.10 0.28 ± 0.04 0.37 ± 0.04 2.03 ± 0.25 2.25 ± 0.02 32 ± 1.20 -
4 5.60 ± 0.17 5.70 ± 0.10 0.34 ± 0.01 0.35 ± 0.04 2.08 ± 0.09 2.25 ± 0.22 31 ± 1.52 -
5 5.55 ± 0.03 5.69 ± 0.02 0.41 ± 0.05 0.44 ± 0.06 2.19 ± 0.20 2.30 ± 0.20 29 ± 1.23 -
Table 3. Changes in microbiological quality (counts in log cfu/g) of pineapple chicken curry during frozen storage (−18˚C ± 2˚C).
Samples SPC Coliform Yeast & Mold S. aureus Salmonella E. coli
Fresh 1 × 10² Nil 2 × 101 Nil Nil Nil
2 Months 4 × 101 Nil 1 × 101 Nil Nil Nil
4 Months 2 × 101 Nil 1 × 101 Nil Nil Nil
6 Months <10 Nil 1 × 101 Nil Nil Nil
gienic packaging in addition to the antibacterial effect of spices [30,31]. Finally before storage, samples were sub- jected to low temperature that also had an inhibitory ef- fect on the growth of undesirable microbes and prevent- ing spoilage. Narasimha et al. [32] suggested that meat
products are spoiled when an off odor, slime formation along with the microbial population of 8 log cfu/g on the surface is evident.
3.4. Fatty Acid Estimation by Gas Chromatography
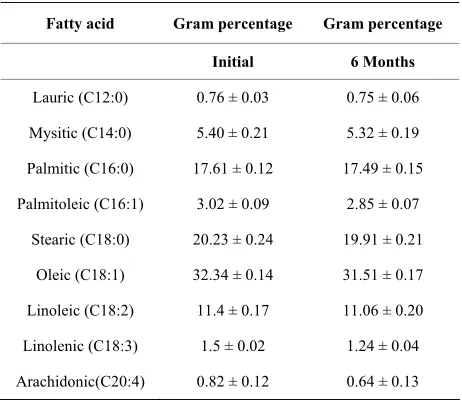
[image:5.595.56.287.125.216.2] [image:5.595.308.539.338.539.2]The individual fatty acid composition of pineapple chicken curry were estimated to find out the effect of pineapple on fat oxidation during storage. The stability of various saturated , monounsaturated and polyunsaturated fatty acids during 6 months storage at −18˚C were evaluated. The results of this study were depicted in
Table 4. From the table it could be observed that the sample contains a mixture of fatty acids both saturated and unsaturated fatty acids. Unsaturated fatty acids constitute both monounsaturated (MUFA) and polyun- saturated (PUFA). Monounsaturated fatty acids are dominant and constitute approximately 52%. The oxi- dation of lipid is one of the primary causes of deterio- ration of meat during processing and storage leading to development of off-flavour, decrease in nutritive value, loss of colour, texture etc. So the degradation of un-
saturated fatty acids have been investigated by GC. From the data, it could be clear that, out of saturated fatty acids lauric, myristicand palmitic found in low quantities. Stearic contribute the major mono unsaturated fatty acids. The PUFA i.e., linoleic, linolenic and arahi-
donic acids were also present in small quantities. From the studies, it was observed that saturated fatty acids do not vary significantly during storage, where as MUFA and PUFA showed a significant change during storage.
3.5. Sensory Quality
[image:5.595.57.541.579.725.2]Mean sensory scores given by panel members for 0-day samples for overall acceptability were in the range of 8.34 ± 0.32 on a 9-point hedonic scale (Table 5). During the storage period of 6 months a gradual decrease in scores were observed from 8.34 to 7.46 on 0 day and after 6 months of frozen storage respectively. The scores given by panel members have shown that the samples
Table 4. Fatty acid profile of sample.
Fatty acid Gram percentage Gram percentage
Initial 6 Months
Lauric (C12:0) 0.76 ± 0.03 0.75 ± 0.06
Mysitic (C14:0) 5.40 ± 0.21 5.32 ± 0.19
Palmitic (C16:0) 17.61 ± 0.12 17.49 ± 0.15
Palmitoleic (C16:1) 3.02 ± 0.09 2.85 ± 0.07
Stearic (C18:0) 20.23 ± 0.24 19.91 ± 0.21
Oleic (C18:1) 32.34 ± 0.14 31.51 ± 0.17
Linoleic (C18:2) 11.4 ± 0.17 11.06 ± 0.20
Linolenic (C18:3) 1.5 ± 0.02 1.24 ± 0.04
Arachidonic(C20:4) 0.82 ± 0.12 0.64 ± 0.13
Mean ± SD, n = 3.
Table 5. Changes in sensory quality of pineapple chicken curry product during frozen (−18˚C ± 2˚C) storage.
Storage period in months
0 1 2 3 4 5 6
Colour 8.6 ± 0.23 8.5 ± 0.23 8.3 ± 0.32 8.2 ± 0.21 8.0 ± 0.26 7.9 ± 0.35 7.8 ± 0.43
Flavour 8.3 ± 0.27 8.3 ± 0.27 8.1 ± 0.32 8.0 ± 0.29 7.8 ± 0.46 7.6 ± 0.36 7.4 ± 0.32
Mouth feel 8.4 ± 0.23 8.1 ± 0.32 8.0 ± 0.45 7.9 ± 0.42 7.7 ± 0.42 7.6 ± 0.24 7.5 ± 0.28
Consistency 8.2 ± 0.32 8.3 ± 0.42 8.0 ± 0.78 7.9 ± 0.64 7.7 ± 0.74 7.6 ± 0.74 7.5 ± 0.64
Texture 8.2 ± 0.54 8.4 ± 0.42 8.0 ± 0.68 7.7 ± 0.24 7.4 ± 0.32 7.3 ± 0.86 7.1 ± 0.32
maintained the quality even after the storage period of 6 months under frozen conditions since all the scores were observed above 7 that are in an acceptable range. Simi- larly a decrease in trend was observed for beef patties [33], chicken nuggets [7] and egg loaf [34] and chicken curry [1].
4. Conclusion
Consumer’s rising interest in RTE has motivated re- searchers to standardize the process of traditional prod- ucts that are long being known as well as are highly consumed. In the present study recipe of pineapple chicken curry was standardized that was packed and analysed for six months which revealed that even after a storage period of 6 months the product was accepted by the sensory panelists as well as was found to be micro- biologically stable. A decreased pH further contributed to decrease in stability. FFA and TBA values have shown that there was no adverse affect on the nutritional quality due to the combined effect of low temperature and anti- oxidant effect of spices used. Fatty acid profile has been established by GC and several fatty acids were quanti- fied. Thus, the product quality was maintained and it can be concluded that it can be stored without marked loss in quality for a period of 6 months at −18˚C ± 2˚C.
REFERENCES
[1] V. K. Modi, N. M. Sachindra, A. D. Sathisha, N. S. Ma- hendrakar and D. Narasimha Rao, “Changes in Quality of Chicken Curry during Frozen Storage,” Journal of Mus-cle Foods, Vol.17, No. 2, 2006, pp. 141-154.
doi:10.1111/j.1745-4573.2006.00034.x
[2] T. K. Srinivasa Gopal, T. S. G. Iyer, K. K. Balachandran, P. Madhavan, P. K. Vijayan and C. N. Ravishankar, “Ready to Eat Fish Curry in Flexible Packs,” Seafood Export Journal, Vol. 30, No. 1, 1999, pp. 7-11.
[3] Anonymous, “New Fast Food Ideas Take Shape at Chic-O- Roll,” Frozen Chilled Food, Vol. 37, No. 8, 1984, pp. 24-25.
[4] F. Badii and N. K. Howell, “Changes in the Texture and Structure of Cod and Haddock Fillets during Frozen Storage,” Food Hydrocolloids, Vol. 16, No. 4, 2002, pp. 313-319. doi:10.1016/S0268-005X(01)00104-7
[5] C. R. Capillas, A. Moral, J. Morales and P. Montero, “The Effect of Frozen Storage on the Functional Properties of the Muscle of Volador (Illex Coindetii),” Food Chemistry, Vol. 78, No. 2, 2002, pp. 149-156.
doi:10.1016/S0308-8146(01)00392-2
[6] V. K. Modi, N. S. Mahendrakar, D. Narasimha and N. M. Sachindra, “Quality of Buffalo Meat Burger Containing Legume Flours as Binders,” Meat Science, Vol. 66, No. 1, 2003, pp. 143-149.
[7] V. K. Modi, N. S. Mahendrakar, N. M. Sachindra and D. Narasimha, “Quality of Nuggets Prepared from Fresh and
Smoked Spent Layer Chicken Meat,” Journal of Muscle Foods, Vol. 15, No. 3, 2004, pp. 195-204.
doi:10.1111/j.1745-4573.2004.tb00684.x
[8] AOAC (Association of Official Analytical Chemist), “Official Methods of Analysis, Association of Official Analytical Chemists,” 15th Edition, AOAC Press, Gai- thersburg, 1990.
[9] J. Pikul, D. E. Leszczynski and F. A. Kummerow, “Eva- luation of Three Modified TBA Methods for Measuring Lipid Oxidation in Chicken Meat,” Journal of Agriculture Food Chemistry, Vol.37, No. 5, 1989, pp. 1309-1313. doi:10.1021/jf00089a022
[10] B. G. Tarladgis, B. M. Watts and M. T. Youthan, “A Dis- tillation Method for the Quantitative Determination of Malonaldehyde in Rancid Foods,” Journal of the American Oil Chemists Society, Vol. 37, No. 1, 1960, pp. 44-48.
doi:10.1007/BF02630824
[11] L. D. Metcalfe, A. A. Schmitz and J. R. Pelka, “Rapid Preparation of Fatty Acid Esters from Lipids for Gas Chro- matographic Analysis,” Analytical Chemistry, Vol. 38, No. 3, 1966, pp. 514-515. doi:10.1021/ac60235a044 [12] APHA, “Compendium of Methods for the
Microbiologi-cal Examination of Foods,” 4th Edition, American Pubic Health Association, Washington DC, 2001.
[13] ASTM (American Society for Testing Materials), “Man-ual Series MNL 26,” 2nd Edition, American Society for Testing and Materials, Philadelphia, 1996.
[14] M. C. D. Fernandez and I. M. Z. Rodriguez, “Lipolytic and Oxidative Changes in ‘Chorizo’ during Ripening,” Meat Science, Vol. 29, No. 2, 1991, pp. 99-107.
doi:10.1016/0309-1740(91)90057-W
[15] I. Zalacain, M. J. Zapelena, I. Astiasaran and J. Ballo, “Dry Fermented Sausages Elaborated with Lipase from Candida cylindacea: Comparison with Traditional For-mulations,” Meat Science, Vol. 40, No. 1, 1995, pp. 55-61. doi:10.1016/0309-1740(94)00023-Z
[16] K. P. Yashoda, V. K. Modi, N. S. Mahendrakar, N. M. Sachidra and D. Narasimha Rao, “Quality Characteristics of Fried Broiler Chicken Prepared by Two Processing Methods,” Food Research International, Vol. 14, No. 3, 2004, pp. 163-173.
doi:10.1111/j.1745-4506.2004.tb00187.x
[17] M. E. Camire, A. Camire and K. Kumber, “Chemical and Nutritional Changes in Food during Extraction,” Critical Review Food Science and Nutrition, Vol. 29, No. 1, 1990, pp. 35-57. doi:10.1080/10408399009527513
[18] S. S. L. Abd-El-Alim, A. Lugasi, J. Hovari and E. Dwor-schak, “Culinary Herbs Inhibit Lipid Oxidation in Raw and Cooked Minced Meat Patties during Storage,” Jour-nal of the Science of Food and Agriculture,Vol.79, No. 2, 1999, pp. 277-285.
doi:10.1002/(SICI)1097-0010(199902)79:2<277::AID-JS FA181>3.0.CO;2-S
[19] D. E. Pszczola, “Antioxidants: From Preserving Food Qua- lity to Quality of Life,” Food Technology, Vol. 55, No. 6, pp. 51, 52, 54-57.
Prop-erties of Spice Extracts Obtained via Supercritical Fluid Extraction,” Journal of Agricultural and Food Chemistry, Vol. 51, No. 9, 2003, pp. 2520-2525.
doi:10.1021/jf0260693
[21] S. M. Lai, J. I. Gray, A. M. Booren, R. L. Crackel and J. L. Gill, “Assessment of off Flavour Development in Re-structured Chicken Nuggets Using Hexanal and TBARS Measurements and Sensory Evaluation,” Journal of Ag-ricultural and Food Chemistry, Vol. 67, No. 4, 1995, pp. 447-452. doi:10.1002/jsfa.2740670405
[22] L. Martin, M. L. Timan, M. J. Patron, J. Ventans and T. Antequena, “Evolution of Volatile Aldehydes in Iberian Ham Matured under Different Processing Conditions,” Meat Science, Vol. 54, No. 4, 2000, pp. 333-337.
doi:10.1016/S0309-1740(99)00107-2
[23] L. Reddy, T. M. R. Setty and K. C. Dora, “Studies on Storage Behavior of Frozen Fish Fingers from Croacker and Perches,” Fish Technology, Vol. 29, No. 1, 1992, pp. 35-39.
[24] S. H. Wang, M. H. Chang and T. C. Chen, “Shelf-Life and Microbiological Profiler of Chicken Wing Products Following Sous vide Treatment,” International Journal of Poultry Science, Vol. 3, No. 5, 2004, pp. 326-332. doi:10.3923/ijps.2004.326.332
[25] S. Combes, J. Lepetit, B. Darche and F. Lebas, “Effect of Cooking Temperature and Cooking Time on Warner- Bratzler Tenderness Measurements and Collagen Content in Rabbit Meat,” Meat Science, Vol. 66, No. 1, 2003, pp. 91-96. doi:10.1016/S0309-1740(03)00019-6
[26] B. C. Shanks, D. M. Wulf and R. J. Maddock, “Technical Note: The Effect of Freezing on Warner-Bratzler Shear Force Values of Beef Longissimus Steaks across Several Post-Mortem Aging Periods,” Journal of Animal Science, Vol. 80, No. 8, 2002, pp. 2122-2125.
[27] G. J. Banwart, “Regulations and Standards,” In: Basic Food Microbiology, AVI Publishing Co., Inc., Westport, 1989, p. 738.
[28] C. Leygonie, T. J. Britz and L. C. Hoffman, “Impact of Freezing and Thawing on the Quality of Meat: Review,” Meat Science, Vol. 91, No. 2, 2012, pp. 93-98.
doi:10.1016/j.meatsci.2012.01.013
[29] C. Vieira, A. Cerdeño, E. Seffano, P. Lavín and A. R. Mantecón, “Breed and Ageing Extent on Carcass and Meat Quality of Beef from Adult Steers (Oxen),” Live-stock Science, Vol. 107, No. 1, 2007, pp. 62-69.
doi:10.1016/j.livsci.2006.09.004
[30] B. M. Grohs and B. Kunz, “Antimicrobial Effect of Spices on Sausage Type Frankfurter,” Advance Food Sci-ence, Vol. 21, No. 3-4, 1999, pp. 128-135.
[31] B. M. Grohs, N. Kleigel and B. Kunz, “Bacteria Grow Slower: Effects of Spice Mixtures on Extension of Shelf Life of Pork,” Fleischwirtschaft,Vol. 80, No. 9, 2000, pp. 61-63.
[32] D. Narasimha Rao, K. K. S. Nair and P. Z. Sakhare, “Meat Microbiology and Spoilage in Tropical Countries,” In: A. Davies and R. Board, Eds., The Microbiology of Meat and Poultry, Blackie Academic & Professional, London, 1998, pp. 220-265.
[33] K. B. Bullock, D. L. Huffman, W. B. Egbert, W. B. Mikel, D. D. Bradford and W. R. Jones, “Storage Stability of Low Fat Ground Beef Made with Lower Value Cuts of Beef,” Journal of Food Science, Vol. 59, No. 1, 1994, pp. 6-9. doi:10.1111/j.1365-2621.1994.tb06884.x