1 Photoacclimation by Arctic Cryoconite Phototrophs
1
Perkins RG1*, Bagshaw E1, Mol L2, Williamson CJ3, Fagan, D3, Gamble M3 and Yallop ML3 2
1. Cold Climate Research, School of Earth and Ocean Sciences, Cardiff University, Park 3
Place, Cardiff, UK, CF10 3AT 4
2. Department of Geography and Environmental Management, UWE Bristol, Coldharbour 5
Lane, Bristol, UK, BS16 1QY 6
3. School of Biological Sciences, Life Sciences Building, University of Bristol, 24 Tyndall 7
Avenue, BS8 1TQ 8
*Corresponding author: Email: PerkinsR@cf.ac.uk, Tel.: 0044 (0)2920 875026 9
Abstract 10
Cryoconite is a matrix of sediment, biogenic polymer and a microbial community which 11
resides on glacier surfaces. The phototrophic component of this community is well adapted to 12
this extreme environment, including high light stress. Photoacclimation of the cryoconite 13
phototrophic community on Longyearbreen, Svalbard was investigated using in situ variable 14
chlorophyll fluorescence. Rapid light curves (RLCs) and induction recovery curves were used 15
to analyse PSII quantum efficiency, relative electron transport rate and forms of down 16
regulation including non-photochemical quenching (NPQ) including state transitions in 17
cyanobacteria. Phototrophs used a combination of behavioural and physiological 18
photochemical down regulation. Behavioural down regulation is hypothesised to incorporate 19
chloroplast movement and cell or filament positioning within the sediment matrix in order to 20
shade from high light, which resulted in a lack of saturation of RLCs and hence over-21
estimation of productivity. Physiological down regulation was biphasic NPQ: comprising a 22
2 with decreasing light intensity. These findings demonstrate that cryoconite phototrophs 24
combine multiple forms of physiological and behavioural down regulation to optimise light 25
exposure and maximise photosynthetic productivity. This plasticity of photoacclimation 26
enables them to survive productively in the high light stress environment on the ice surface. 27
28
Keywords: cryoconite, photoacclimation, down regulation, non-photochemical quenching, 29
productivity, fluorescence 30
3 Introduction
32
Cryoconite (cryo = ice, conite = dust) is an important component of the glacier 33
ecosystem. It consists of debris deposited on the ice surface by wind, water, or rockfall from 34
valley sides, and collects in water-filled pools on the surface known as cryoconite holes. The 35
debris contains microorganisms, including photoautotrophs, which contribute to the 36
accumulation of carbon and bioavailable nutrients on glacier surfaces (Hodson et al. 2007; 37
Cook et al. 2012; Bagshaw et al. 2016a). These nutrients are periodically exported to 38
downstream environments via glacier runoff (Bagshaw et al. 2010; Lawson et al. 2014), and 39
can support biological activity in proximal ecosystems (Foreman et al. 2004; Bagshaw et al. 40
2013). Microorganisms in cryoconite are typically sourced from the surrounding 41
environments, and include cyanobacteria, microalgae, archaea, bacteria, fungi and 42
heterotrophic protists (Cameron et al. 2012; Edwards et al. 2014; Zawierucha et al. 2015; 43
Kaczmarek et al. 2016). It is well-established that the photosynthetic organisms are active 44
throughout the ablation season, but the mechanisms by which they undertake primary 45
production on the harsh environment of the glacier surface are poorly understood. In this 46
paper, we use in situ variable chlorophyll fluorescence to investigate cryoconite community 47
photophysiology in order to gain insight into their adaptation to high light intensity, 24 h 48
photoperiods (and hence the resulting high photodose) and rapid light intensity fluctuation. 49
Glacier surface microorganisms have been demonstrated to impact on ice surface 50
albedo (Takeuchi 2002b; Yallop et al. 2012; Musilova et al. 2016), via a phenomenon known 51
as ‘biological darkening’ (Benning et al., 2014; Tedesco et al. 2016). In and ex situ studies 52
have demonstrated that this occurs via two mechanisms: production of organic matter, which 53
has a net darkening impact on the sediment (Takeuchi 2002a; Musilova et al. 2016), and 54
production of dark pigments (Yallop et al. 2012; Lutz et al. 2014; Remias et al. 2016), which 55
4 Yallop et al. (2012) demonstrated that highly pigmented populations of algae are widespread 57
in marginal zones of the Greenland ice sheet, both concentrated in cryoconite, and living 58
directly on the ice surface. Within cryoconite holes, the material aggregates into granules, 59
forming a matrix of sediment particles and the microbial community, bound with biogenic 60
extracellular polymers (EPS) (Hodson et al. 2010; Langford et al. 2010; Zarsky et al. 2013). 61
These tightly-knit granules give structure to the cryoconite community, with heterotrophic 62
organisms concentrated in the centre and phototrophs around the outside, which promotes 63
community stability on the constantly changing glacier surface. During the summer months, 64
cryoconite is regularly redistributed by flowing meltwater (Irvine-Fynn et al. 2011), hence 65
granule formation may be an adaptation to promote community longevity (Bagshaw et al. 66
2016b). 67
To our knowledge there have been very limited in situ measurements of microbial 68
phototrophs in ice/snow-associated communities, presumably due to the difficulty in 69
collecting data in these harsh environments. McMinn et al. (2007) used variable chlorophyll 70
fluorescence to perform measurements on ex situ samples of Antarctic sea ice algae. Stibal et 71
al. (2007) used in situ variable chlorophyll fluorescence to measure snow algae, however 72
these samples were thawed and analysed in a cuvette system. Yallop et al. (2012) 73
investigated ice algal photophysiology and their role in reducing ice sheet albedo, but 74
samples were analysed ex situ after thawing. Bagshaw et al. (2016) made a comparative 75
study of Arctic and Antarctic cryoconite using combined oxymetry and fluorescence, also on 76
ex situ cryoconite material in a cuvette system. By contrast, this is the first study of 77
cryoconite phototroph photophysiology in situ. We use a Walz Water PAM flourometer with 78
fibre optic emitter-detector to perform in situ rapid light response curves and induction 79
5 role of photophysiological down regulation in optimising primary production in this extreme 81
environment. 82
83
Methods 84
In situ field measurements and sampling 85
Field work was carried out at Longyearbreen, Svalbard (78° 10 49 N, 15°30 21 E) in the 86
high-Arctic, on 25-30th August 2015. Longyearbreen is a small (2.5km2), thin (53m, 87
(Langford et al., 2014)), predominantly cold-based valley glacier, adjacent to the town of 88
Longyearbyen, surrounded by Tertiary and Cretaceous sandstone (Larsson 1982) interbedded 89
with coal-bearing shales and siltstones (Langford et al. 2014). Field observations indicate that 90
sediment production is driven by frost shattering of the bedrock and glacial action. This 91
material is moved onto the glacier surface through aeolian deposition and high frequency 92
rock falls (Etzelmüller et al. 2011). 93
Sampling was undertaken near the centre line of the glacier (Figure 1), which had 94
relatively high debris concentrations including a small morainic deposit. Three hydrologically 95
connected cryoconite holes were chosen at random within 10 m2 at 78°10.903 N, 15°31.469 96
E, for in situ measurements and sample collection for identification of the photosynthetic 97
community structure using microscopy and pigment analysis. Sediment depth was 4-6 mm 98
and water depth was 10-15 mm in the three holes. 99
Bulk samples of cryoconite from each hole were collected immediately after 100
fluorescence measurements were made (see below), using new nitrile gloves and Whirlpak 101
sterile sampling bags (Fisher Scientific). They were frozen within 4 hours of collection, and 102
transported frozen in insulated boxes to Cardiff University, UK. Samples for initial 103
6 spatula, and transferred to new centrifuge tubes. They were returned to the field laboratory, 105
kept cool and examined within 48 hours. During the short sampling period, incoming 106
photosynthetically available radiation (PAR) and water temperature of an example cryoconite 107
hole in the sampling area were monitored using an Apogee Quantum sensor and Campbell 108
Scientific 107 probe, powered by a Campbell Scientific CR10X datalogger. 109
In situ variable chlorophyll fluorescence measurements were made using a Walz 110
Water Pulse Amplitude Modulated (PAM) fluorometer equipped with a blue light fibre-optic 111
emitter/detector unit. This instrument measures emitted fluorescence yield for calculation of 112
photosystem II (PSII) quantum efficiency, which in turn can be used to calculate relative 113
electron transport rate as a proxy for photophysiological productivity. Measurements 114
consisted of 10 rapid light curves (RLCs) and 5 induction-recovery curves within each 115
cryoconite hole, carried out over the same time period each day, between approximately 116
10:00 and 18:00 when solar irradiance was high. The photoperiod at the time of sampling in 117
August 2015 was 20 h. Initially three measurements of RLCs were made with a blue or a red 118
light emitter/detector unit to investigate the relative excitation of microalgae and 119
cyanobacteria respectively (this was prior to identification of taxa present, however 120
cyanobacteria were expected based on previous work and literature). However, no significant 121
difference was observed between the two systems and therefore measurements were only 122
made with one, the blue light emitter/detector unit. RLCs were in two forms: increasing and 123
decreasing incremental light steps, with 5 replicates of each, following the methods of 124
Perkins et al. (2006). Increasing and decreasing light curves were carried out on separate 125
samples each time and with sequentially increasing or decreasing light levels steps 126
respectively. Increasing eight-step RLCs were carried out using 30 second incremental light 127
steps between 0 and 3,600 µmol m-2 s-1 photosynthetic available radiation (PAR). A 600 mS 128
7 induce full light saturation and rise to maximum fluorescence yield (Fm or Fm’). The
130
increasing incremental light curves were randomly interspersed with 5 replicates of 131
decreasing incremental light curves. For these light curves, instead of using the pre-132
programmed RLC settings of the fluorometer, manual light curves were performed, 133
decreasing the light intensity each step using Walz WinControl V3.14 software. At the end 134
of each light curve step a saturating pulse was performed and the light level reduced to the 135
next lower intensity, culminating in a 30 second dark period measurement. Rapid light curves 136
of relative electron transport rate (rETR) as a function of incremental light intensity were 137
plotted, with rETR calculated as:- 138
rETR = quantum efficiency (ΔF/Fm’) x PAR/2
139
where ΔF/Fm’ is the quantum efficiency calculated as (Fm’-F)/Fm’ and where F is the
140
operational fluorescence yield and Fm’ is the maximum fluorescence yield in the light and ΔF
141
= Fm’ – F. RLC data were analysed by iterative curve fitting of the Eilers and Peeters (1988)
142
model using Sigmaplot V10 statistical software. Light curves data were solved to determine 143
the RLC parameters of relative maximum electron transport rate (rETRmax), light utilisation 144
coefficient (α), and light saturation coefficients (Es and Ek). Light curve coefficients a, b and 145
c and the regression fit for the light curves were all observed to be significant at p < 0.001 146
ensuring accuracy in calculation of the light curve parameters (Perkins et al. 2006). 147
Parameters rETRmax, α, Ek and Es were analysed for equal variance and normality using the 148
Levene’s and Shapiro Wilkes tests respectively in PAST statistical software (Hammer et al., 149
2001). Data were homoscadestistic and parametric; two factor ANOVA was used to 150
determine significant differences between the three cryoconite holes and between increasing 151
and decreasing RLCs. RLC in situ measurements were performed randomly between the 152
three cryoconite holes over two days, with induction recovery curves performed the 153
8 Induction recovery curves consisted of an initial dark measurement (30 seconds of darkness) 155
of quantum efficiency (Fv/Fm), followed by a 400 second induction phase of applied actinic
156
light at 803 µmol m-2 s-1 PAR, with repeated recording of quantum efficiency (ΔF/Fm’). This
157
was then followed by the recovery phase of a further 900 seconds of darkness, with repeated 158
measurement of quantum efficiency (Fv/Fm). Changes in quantum yield and fluorescence
159
yields (operational fluorescence yield F, and maximum fluorescence yields Fm and Fm’) were
160
analysed over the full induction-recovery period. 161
Community analysis 162
Cells in cryoconite subsamples were identified using a Leica DM LB2 light 163
microscope with fluorescence attachment. For pigment quantification, subsamples of 164
cryoconite material, frozen (-20oC) were freeze-dried and homogenised prior to the extraction 165
of a known mass (circa 2 g) and pigments were extracted in 100% acetone containing vitamin 166
E as the internal standard. The HPLC protocol was a modified version of the method of Van 167
Heukelem & Thomas (2001), using a c8 column in an Agilent 1100 HPLC equipped with a 168
diode-array detector. Pigments were identified and quantified against analytical standards 169
from DHI and Sigma using both retention time and spectral analysis. 170
171
Results 172
Ambient photosynthetically available radiation (PAR) received on the glacier surface ranged 173
from 200 to 400 µmol m-2 s-1 (st dev. 18) during the measurement period. The mean water 174
temperature in the monitored cryoconite hole was 0.9 °C, and ranged from 0.4 to 1.9 °C. The 175
sampled holes remained hydrologically connected throughout the monitoring period, 176
9 nonetheless mobile sediment particles were observed moving across the ice surface in the 178
meltwater (Irvine-Fynn et al., 2011). 179
Cryoconite phototrophic community composition 180
Epifluorescence microscopy on cryoconite material revealed the presence of a number 181
of different green algal and cyanobacterial taxa in the three different cryoconite holes 182
sampled (Table 1). Large colonies of Nostoc spp. (Figure 2a) and Streptophytes (closely 183
related to Charophyceae and Embryophyta), were identified in samples from all three holes. 184
Pigments characterising both green algae and cyanobacteria were recorded from the 185
cryoconite material using HPLC (Table 2). Chlorophyll a (CHL a) pigment dominated all 186
samples, but was higher in hole 1 than holes 2 and 3. Hole 1 also had the highest 187
concentrations of the pigments lutein (LUT), chlorophyll b (CHL b) and echinenone (ECHI)). 188
The ratios of Lutein and CHLb : CHL a (Table 3) were 2-6 times greater than in the other 189
samples, indicating that green algae dominated the community in this hole. There were two 190
key cyanobacterial markers, echinenone (ECHI) and canthaxanthin (CANT) present in all 191
samples from the three cryoconite holes. The orange-brown pigment Scytonemin (present in 192
the sheath of Nostoc (Figure 2a)) was found in all samples though it could not be quantified 193
due to poor resolution of the peaks. Although occasional spores of Chlamydomonas spp. were 194
found (Figure 2c), the red pigment astaxanthin was below the detection limit in pigment 195
extracts. Detectable levels of fucoxanthinin holes 1 and 3, indicated that diatoms were also 196
present. Differences in the ratios of pigment markers between holes indicated differences in 197
relative abundance of taxa, with relatively more cyanobacteria in hole 1. 198
Cryoconite phototrophic community photophysiology 199
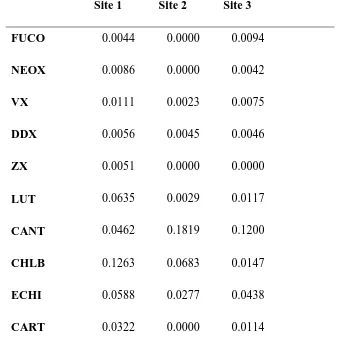
Increasing rapid light curves (RLCs) showed virtually no saturation (Figure 3), with 200
10 rETRmax could only be estimated as the highest value obtained (255 ± 37.2 rel. units). In 202
contrast, decreasing RLCs (Figure 3) showed clear saturation, with all 15 curves saturating 203
and an rETRmax of 113 rel. units (F2,10 = 551, p<0.001). Hence, rETRmax determined from 204
decreasing RLCs was less than 50% of the value estimated from the non-saturating, 205
increasing RLCs. Examination of both sets of RLCs showed no significant difference in the 206
light saturation coefficient (α), with values of 0.13 (increasing) and 0.12 (decreasing) rel. 207
units. For decreasing RLCs, an Ek of 940 and Es of 1800 µmol m-2 s-1 PAR, were determined. 208
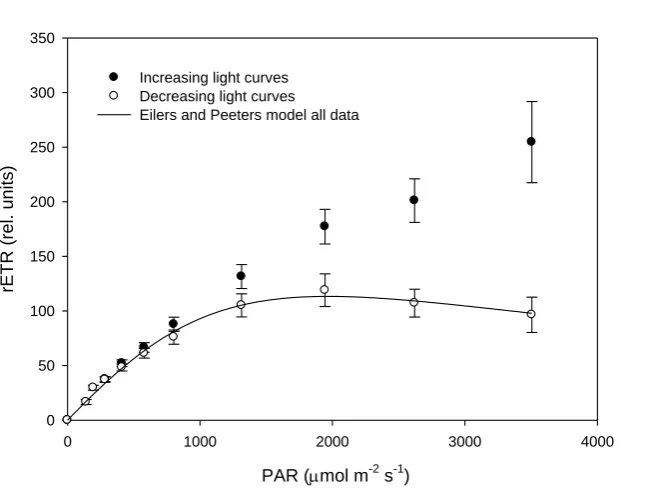
Calculated down regulation in the form of non-photochemical quenching (NPQ) was 209
notably different between increasing and decreasing RLCs (Figure 4); note that calculated 210
values do not correct for NPQ retained from the period prior to measurements, i.e. induced 211
under ambient light. For decreasing RLCs there was no initial dark light curve step, and 212
hence no reversal of any NPQ that had been induced under ambient light prior to the 213
measurement period. Whilst NPQ slowly increased with PAR from 0 to 0.50 ± 0.06 during 214
increasing RLCs, an inverse relationship between NPQ and PAR was apparent during 215
decreasing curves: as light levels were stepped down from 3505 to approximately 800 µmol 216
m-2 s-1 PAR, NPQ slowly increased. With further reductions in PAR, NPQ rapidly increased 217
to approximately 6-times that induced during increasing RLCs. These high levels of NPQ 218
were further retained in the dark during the final 30 second step of decreasing RLCs. 219
Examination of RLC fluorescence yields revealed the dynamics underlying observed 220
differences in down regulation between increasing and decreasing RLCs (Figure 5). During 221
increasing RLCs (Figure 5a), initial increases in both F and Fm’ signified reversal of NPQ
222
retained from illumination of samples by ambient light prior to measurements: such retained 223
NPQ was reversed under the initially low PAR levels of increasing RLCs. As samples were 224
subjected to increasing light intensity, Fm’ decreased steadily to 84 ± 23.2% of initial values
225
11 value in the dark). Conversely, both F’ and Fm’ slowly decreased below initial values
227
(measured in the dark, Fo and Fm) at the beginning of decreasing RLCs (Figure 5b), with
228
decreases accelerating at light intensity less than ca. 800 µmol m-2 s-1, the point at which 229
NPQ increased. With decreases in light intensity to 140 µmol m-2 s-1, F’ reduced to 53 ± 230
9.9% and Fm’ to 64 ± 11.4% of initial values. Note the slight increase in both F’ and Fm’
231
when exposed to darkness at the end of decreasing RLCs (Figure 5b). 232
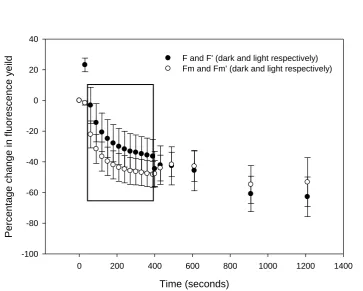
Monitoring of photochemistry during induction/recovery curves indicated a small 233
amount of photoacclimation during the 400-second induction phase at 803 µmol m-2 s-1, 234
whereby initial declines in quantum efficiency from 0.29 ± 0.025 to 0.11 ± 0.038 at the onset 235
of illumination were recovered to 0.13 ± 0.025 by the end illumination (Figure 6). With the 236
onset of the dark recovery phase, rapid increases in quantum efficiency to 0.26 ± 0.041 237
demonstrated almost full recovery to initial values. During the remainder of the recovery 238
phase, quantum efficiency slowly increased to 0.45 ± 0.063, i.e. well above initial values, 239
suggesting significant retention of down regulation in samples from exposure to ambient light 240
prior to measurements. However, examination of the operational (F’ or F in the induction and 241
recovery phases, respectively) and maximum (Fm’ or Fm, respectively) fluorescence yields
242
(Figure 7) revealed unexpected patterns. F’ initially increased during the induction phase, 243
presumably due to ubiquinone Qa reduction (lack of increase in Fm’ precluding NPQ
244
relaxation), before decreasing as Qa oxidation (unlikely) and/or NPQ induction (most likely) 245
occurred during the induction phase. After 400 seconds, decreases in F with the onset of the 246
dark recovery phase, presumably reflecting Qa oxidation, outweighed the effects of NPQ 247
reversal; however, continued decreases in F over the remainder of the recovery phase 248
suggested continued NPQ induction in darkness. In a similar manner, Fm’ decreased during
249
the induction phase suggesting NPQ induction, showed a slight increase with the onset of the 250
12 the recovery phase indicating continued NPQ induction in the dark. Increases in quantum 252
efficiency during the recovery phase (Figure 6) were the result of a greater proportional 253
decrease in F compared to Fm (Figure 7).
254
255
Discussion 256
Cryoconite phototrophs on Longyearbreen, Svalbard demonstrated a high capability 257
for rapid photoacclimation, via a combination of behavioural and physiological down 258
regulation of photochemistry. The former involves a self-shading process, either chloroplast 259
shading, cell positioning within the cryoconite sediment, or both processes. The latter appears 260
to be a combination of two forms of non-photochemical quenching (NPQ), however this is 261
complicated as a result of the mixed community due to employment of state changes by 262
cyanobacteria which induce rapid changes in fluorescence yields in the same form as NPQ. 263
Overall, there is a high plasticity of photoacclimation in croconite phototrophs, which ensures 264
cells are ideally adapted to high light exposure on the ice surfaces in these high-stress polar 265
environments. 266
The phototrophic communities of the three cryoconite holes investigated clearly 267
differed despite being hydrologically connected. Pigment analysis indicated that all three 268
holes showed the typical dominance of green algae and cyanophyta within cryoconite 269
material (Langford et al., 2011; Cameron et al., 2012; Yallop et al., 2012; Edwards et al., 270
2014), with only trace levels of fucoxanthin and hence low biomass of diatoms. Hole 1 was 271
dominated by green algae, principally chlorophytes and streptophytes (indicated by high Chl 272
b : Chl a ratio and the relatively high presence of lutein; streptophytes are closely related to 273
Charophyceae and Embryophyta and hence have similar pigments), whereas holes 2 and 3 274
13 differed between holes, based on the relative concentrations of echinenone and
276
canthaxanthin, although all three holes had a high relative abundance of Nostoc. Interestingly, 277
there were no significant differences in community measurements of photophysiology 278
between the holes, despite the differences in phototrophic community structure. 279
Photophysiological data from rapid light curves and induction/recovery curves 280
demonstrated a high plasticity of response, with several mechanisms of photoacclimation 281
identified that allow the cryoconite phototrophic community to effectively photoacclimate to 282
the high-light regime experienced in situ. Photoacclimation methods can be considered to be 283
either physiological or behavioural (Perkins et al. 2002; 2010a,b; Lavaud and Goss 2015). 284
Physiological photoacclimation refers largely to photochemical down regulation, including 285
non-photochemical quenching (NPQ) in eukaryote phototrophs, whereby the light-driven de-286
epoxidation of specific xanthophyll pigments quenches excess excitation energy in the 287
antennae complex as heat (Consalvey et al. 2005; Lavaud and Lepetit 2013). In 288
cyanobacteria, state transitions to balance excitation between photosystems is also a form of 289
physiological photochemical regulation (Campbell et al. 1998). Behavioural 290
photoacclimation is largely cell motility as a response to changes in light environment, 291
whereby cells move away from high light or towards low light in order to optimise their 292
efficiency of photochemistry (Forster and Kromkamp 2004; Perkins et al. 2002; 2010a,b). 293
However, Yallop et al. (2012) expanded upon this by hypothesising that ice algae used 294
chloroplast movement to facilitate shading behind dark, tertiary pigments. Separation of the 295
two processes through in situ measurements would be extremely difficult, if not impossible, 296
hence we refer to behavioural down regulation as the likely composite of these two processes. 297
We therefore hypothesise that cryoconite phototrophs utilise chloroplast movement and / or 298
cell positioning in order to adjust to changing light environments. Such cell motility to 299
14 increasing light increments failed to saturate, whereas decreasing light curves did saturate. 301
Increasing curves provide enough time for chloroplast movement inside the cells and/or cell 302
or filament movement in the sediment and hence the cells optimise their light environment. 303
Phototrophic cryoconite communities are organised around granule structures, consisting of 304
mineral grains, microorganisms and polymers (Takeuchi et al. 2001; Hodson et al. 2010; 305
Langford et al. 2010; Segawa et al. 2014). This is analogous to microbial biofilms in fine 306
sediments, where down regulation is achieved using a mixture of cell motility and NPQ 307
(Perkins et al. 2010a,b; Lavaud and Goss 2015). In these systems, a lack of RLC saturation 308
has been attributed to cell movement away from increasing light levels (Perkins et al. 2002; 309
2010a,b). Cyanobacteria, green algae and diatoms are known to utilise cell motility to move 310
away from high light and UV-stress through the process of microcycling and bulk migration 311
(Bebout and Garcia-Pichel 1995; Kromkamp et al. 1998; Consalvey et al. 2004; Forster and 312
Kromkamp 2004; Serôdio 2004; Perkins et al. 2002; 2010a,b). During the present study, 313
microscopy and pigment profiles confirmed the presence of cyanobacteria, diatoms (at very 314
low levels of abundance) and green algae in the cryoconite material, corroborating previous 315
findings (Stibal et al. 2006; Yallop and Anesio 2010), and hence supporting the potential of 316
cell motility as a means of down regulation. Cell movement within sediment is usually 317
facilitated by extracellular polymer production (Consalvey et al. 2004), which is a well-318
reported characteristic of cryoconite granules (Langford et al. 2010; Zarsky et al. 2013; 319
Segawa et al. 2014). Granules promote community stability (Hodson et al. 2010; Irvine-Fynn 320
et al. 2011; Langford et al. 2014; Bagshaw et al. 2016b), and as we now reveal, also play a 321
role in behavioural photoacclimation, Aggregation of cryoconite into granules thus enhances 322
community production, by supporting a stable, cooperative microbial community, enabling 323
15 Behavioural down regulation of photochemistry (chloroplast movement and / or cell 325
positioning within the sediment) has therefore been demonstrated for cryoconite phototrophic 326
communities, but what is the role of physiological down regulation (in the form of NPQ in 327
green algae and diatoms and state transitions in cyanobacteria) for these phototrophs? 328
Calculation of NPQ from the change in maximum fluorescence yield during increasing 329
incremental RLCs, indicated an initial reversal of NPQ retained from exposure to ambient 330
light prior to measurements, highlighting NPQ as an important mechanism of down-331
regulation employed by cryoconite communities in situ. The subsequent slow induction of 332
NPQ to values of around 0.5 during increasing RLCs further suggested this form of down-333
regulation to be applied proportionally to irradiance, as is a commonly held assumption 334
underlying NPQ dynamics in microalgae (e.g. Lavaud and Goss 2014). However, by 335
extending our assessment to include both decreasing light curves and induction/recovery 336
curves, we were able to demonstrate unique features in the dynamics of cryoconite 337
community down regulation that would not have been ascertainable using the commonly-338
applied increasing light curve technique alone. Firstly, contrasting dynamics in down-339
regulation during increasing and decreasing light curves indicated that behavioural, as 340
opposed to physiological, down-regulation may form the major photo-acclimation 341
mechanism employed in cryoconite holes on Svalbard glaciers. This would be in agreement 342
for observations on sediment biofilm communities in intertidal estuaries (Perkins et al. 343
2010a,b; Cartaxana et al. 2011). This is evidenced by the six-fold higher induction of NPQ 344
apparent during decreasing as compared to increasing light curves, although the true 345
magnitude difference in NPQ induction should not be directly compared, due to the 346
differential levels of cell movement hypothesised. Cell movement to induce shading would 347
result in a decrease in Fm’ yield as well as that observed due to induction of NPQ (Forster and
348
16 change in maximum fluorescence yield (see Methods). Thus high NPQ could in fact be the 350
sum of true NPQ induction and cell movement both reducing Fm’ yield. However it is highly
351
likely that the observed patterns in NPQ are indeed primarily physiological down regulation 352
(energy dependent down regulation in eukaryote microalgae, but also state transitions in 353
cyanobacteria, see below), at least in decreasing RLCs due to the timing and rate of 354
induction. As well as demonstrating the significantly higher capacity for NPQ available to 355
cryoconite phototrophs than estimated from increasing light curves, these trends provide 356
insight into the likely balance between behavioural and physiological down-regulation 357
employed in situ. During increasing light curves, it is likely that chloroplast movement and/or 358
cell positioning in the sediment matrix, i.e. behavioural down-regulation, reduced the light 359
stress experienced by cells, therefore reducing the requirement to induce NPQ. In contrast, 360
the initial high light stress experienced during decreasing curves, coupled with the lack of 361
time for chloroplast movement and/or cell positioning, resulted in cells inducing 362
physiological down-regulation, i.e. NPQ, as a means to balance the irradiance provided. By 363
comparing the magnitude of NPQ induced with/without the presence of behavioural down 364
regulation, data indicate that the latter may account for ca. 75 % of the total down-regulation 365
employed in cryoconite holes. In eukaryote microalgae this may be an adaptation to reduce 366
the metabolic costs associated with production and inter-conversion of NPQ-associated 367
pigments (Lavaud and Goss 2014) in this high-light environment. Secondly, the contrasting 368
dynamics in down-regulation observed during the present study strongly indicated that 369
additional to a combination of behavioural and typical physiological forms of down 370
regulation, the cryoconite phototrophic communities further possess a rapidly induced, time 371
or light-dose dependent form of NPQ, as opposed to primarily light intensity driven forms. 372
With the onset of decreasing light curves, an initial slow level of NPQ was induced, followed 373
17 different forms of NPQ reported for diatoms (Lavaud and Goss 2014), although diatoms were 375
observed to have extremely low abundance in the cryoconite. Rapidly induced energy 376
dependent down regulation of this form, which is not reversed in darkness has been reported 377
(Lavaud and Lepetit 2013) and referred to as photoinhibitory quenching (qI) or saturating 378
NPQ (NPQs). NPQ was induced rapidly during our experiment, despite decreasing light 379
levels, and was also retained in the dark. Such trends were also apparent during the dark 380
recovery phase of induction/recovery curves. Examination of the fluorescence yields showed 381
that both F and Fm initially increased in the dark recovery phase, presumably due to NPQ
382
reversal, but then declined despite the increase in dark quantum efficiency (Fv/Fm) observed.
383
There would therefore appear to be either a time or potentially light-dose dependent form of 384
physiological down-regulation that, once triggered, does not decrease with decreasing PAR, 385
nor is rapidly (i.e. within the duration of dark recovery employed here) reversed in the dark. 386
It is important to note that our measurements were made on a mixed community 387
largely dominated by green algae and cyanobacteria. The latter appear not to have energy 388
dependent NPQ but rapid changes in fluorescence are observed through state transitions 389
utilising phycobilosome diffusion (Campbell and Oquist 1996, Campbell et al. 1998). This 390
form of rapid down regulation would result in similar changes in fluorescent yields as NPQ in 391
green algae, e.g. a quenching as light increased followed by reversal in darkness. During 392
increasing rapid light curves, state transitions (state 2 to state 1) would result in a decrease in 393
Fm’ and hence an increase in our measured NPQ, however shading processes through cell
394
motility described above would negate the need for this down regulation in increasing RLCs. 395
In decreasing light curves, state 2 to state 1 transition would be induced in cyanobacteria at 396
the same time as energy dependent NPQ would be induced in the eukaryote microalgae. It 397
may be that as light levels reduced in these decreasing RLCs, the induction of this state 398
18 increase in measured NPQ. Obviously it would not be possible to differentiate between the 400
two processes in such a mixed community using in situ fluorescence measurements, however 401
we suggest that there is a high likelihood of physiological down regulation employed by both 402
the eukaryote microalgae (energy dependent down regulation) and cyanobacteria (state 403
transitions). 404
The combination of chloroplast movement, cell positioning and physiological down 405
regulation by the cryoconite phototrophs is a highly efficient method of light acclimation that 406
has serious implications for the interpretation of fluorescence based assessments of 407
productivity. Specifically, the lack of saturation of light curves with increasing light 408
increments indicates caution is required when utilising fluorescence on cryoconite. 409
Productivity (rETRmax) can clearly be significantly over-estimated when photoacclimation 410
during the light curve occurs, whether this is through cell movement or chloroplast shading. 411
In this study, the first steps of the RLC appear to be relatively unaffected, with α similar for 412
increasing and decreasing RLCs. However, as the light curves progressed, divergence 413
between the curves showed an overestimation of rETRmax of over 100%, with similar over-414
estimation likely for light saturation parameters Es and Ek. This should be corrected for in 415
studies using fluorescence in order to avoid overestimation of productivity, and potentially 416
the role of cryoconite phototrophs in carbon flux calculations (Hodson et al. 2007; Anesio et 417
al. 2010; Cook et al. 2012; Chandler et al. 2015; Bagshaw et al. 2016a). 418
In conclusion, this study demonstrates that the phototrophic cryoconite community on 419
Longyearbreen, Svalbard, utilise a mixture of behavioural and physiological (likely a mixture 420
of non-photochemical quenching in eukaryotes and state transitions in cyanobacteria) down 421
regulation of photochemistry. Cells appear to be capable of optimising their light 422
environment through chloroplast shading and/or cell positioning within the cryoconite, 423
19 positioning is likely to result in an overestimation of productivity when using increasing 425
incremental rapid light curves. In future work this may me corrected for by using the product 426
of ETR and the operational fluorescence F’ (Ihnken et al. 2014), however this was tested in 427
this study and did not alter the shape of the RLCs. In the cryoconite studied here, the 428
phototrophs, primarily a mixture of green algae and two different cyanophyte communities, 429
showed high plasticity of photophysiology, indicating extremely high capability for light 430
acclimation. This would be expected for cells inhabiting polar ice surfaces, where light 431
intensity and light dose can be high and fluctuate quickly. Aggregation of cryoconite into 432
granules is therefore an important adaptation which not only prolongs microbial community 433
stability, but also allows light acclimation and hence promotes ecosystem productivity. 434
435
Acknowledgements
436
RP was funded by a British Phycological Society Small Project Grant. LM had combined 437
funding from Royal Geography Society Small Research Grant, Geological Society of London 438
Robert Scott Memorial Award and Forskningsradet Norge, Arctic Field Grant no 246072. 439
The work was carried out on Research Project RiS 10281. MLY was supported by a 440
Leverhulme Research Fellowship RF 2014-708. We should also like to thank the two 441
anonymous reviewers for their highly constructive reviews. 442
20 References
444
Anesio, AM., Sattler, B, Foreman, CM., Telling, J, Hodson, A, Tranter, M and Psenner, R. 445
Carbon Fluxes through Bacterial Communities on Glacier Surfaces. Annals of Glaciology 446
2010; 51(56): 32-40 447
Bagshaw, EA, Tranter, M, Fountain, AG, Welch, K, Basagic, HJ and Lyons, WB . Do 448
Cryoconite Holes Have the Potential to Be Significant Sources of C, N, and P to Downstream 449
Depauperate. Arctic Antarctic and Alpine Research 2013; 45(4): 440-454 doi: 10.1657/1938-450
4246-45.4.440 451
Bagshaw, EA, Tranter, M, Wadham, J, Fountain, AG, Dubnick, A and Fitzsimons, S . 452
Processes Controlling Carbon Cycling in Antarctic Glacier Surface Ecosystems. Geochemical 453
Perspectives Letters 2016a; In Press 454
Bagshaw, EA, Tranter, M, Wadham, JL, Fountain, AG and Basagic, H. Dynamic Behaviour 455
of Supraglacial Lakes on Cold Polar Glaciers: Canada Glacier, Mcmurdo Dry Valleys, 456
Antarctica. Journal of Glaciology 2010; 56(196): 366-368 457
Bagshaw, EA, Wadham, JL, Tranter, M, Perkins, R, Morgan, A, Williamson, CJ, Fountain, 458
AG, Fitzsimons, S and Dubnick, A. Response of Antarctic Cryoconite Microbial 459
Communities to Light. Fems Microbiology Ecology 2016b; 92(6) doi: 460
10.1093/femsec/fiw076 461
Bebout, BM, and Garcia-Pichel F. UVB-induced vertical migrations of cyanobacteria in a 462
microbial mat. Applied and Environmental Microbiology 1995; 61: 4215-4222. 463
Benning, LG, Anesio, AM, Lutz, S and Tranter, M. Biological Impact on Greenland's 464
Albedo. Nature Geoscience 2014; 7(10): 691-691 465
Campbell, D, Öquist, G. Predicting Light Acclimation in Cyanobacteria from 466
Nonphotochemical Quenching of Photosystem I I Fluorescence, Which Reflects State 467
Transitions in These Organisms. Plant Physiol. (1996) 11 1: 1293-1298 468
Campbell, D, Hurry, V, Clarke, AK, Gustafsson, Öquist, G. Chlorophyll fluorescence 469
analysis of cyanobacterial photosynthesis and acclimation. Microbiol Mol Biol Rev. 1998: 470
62(3):667-83 471
21 473
Cameron, KA, Hodson, AJ and Osborn, AM. Structure and Diversity of Bacterial, Eukaryotic 474
and Archaeal Communities in Glacial Cryoconite Holes from the Arctic and the Antarctic. 475
Fems Microbiology Ecology 2012; 82(2): 254-267 doi: 10.1111/j.1574-6941.2011.01277.x 476
Cartaxana, P, Ruivo, M, Hubas, C, Davidson, I, Serôdio, J, Jesus, B. Light and O2 477
microenvironments in two contratsing diatom-dominated coastal sediments. Mar. Ecol. Prog. 478
Ser. 2011; 545: 35-47 479
Chandler, DM, Alcock, JD, Wadham, JL, Mackie, SL and Telling, J. Seasonal Changes of Ice 480
Surface Characteristics and Productivity in the Ablation Zone of the Greenland Ice Sheet. 481
Cryosphere 2015; 9(2): 487-504 doi: 10.5194/tc-9-487-2015 482
Consalvey MC, Jesus B, Perkins RG, Brotas V, Underwood GJC, Paterson DM. Monitoring 483
migration and measuring biomass in benthic biofilms: the effects of dark/far-red adaptation 484
and vertical migration on fluorescence measurements. Photosynth Res. 2004; 81:91–101 485
Consalvey, MC, Perkins RG, Paterson DM, Underwood GJC. PAM Fluorescence: A 486
beginners guide for benthic diatomists. Diatom Res. 2005; 20:1–22 487
Cook, JM, Hodson, AJ, Anesio, AM, Hanna, E, Yallop, M, Stibal, M, Telling, J and 488
Huybrechts, P. An Improved Estimate of Microbially Mediated Carbon Fluxes from the 489
Greenland Ice Sheet. Journal of Glaciology 2012; 58(212): 1098-1108 doi: 490
10.3189/2012JoG12J001 491
Dieser, M, Greenwood, M and Foreman, CM. Carotenoid Pigmentation in Antarctic 492
Heterotrophic Bacteria as a Strategy to Withstand Environmental Stresses. Arctic Antarctic 493
and Alpine Research 2010; 42(4): 396-405 doi: 10.1657/1938-4246-42.4.396 494
Edwards, A, Mur, LAJ, Girdwood, SE, Anesio, AM, Stibal, M, Rassner, SME, Hell, K, 495
Pachebat, JA, Post, B, Bussell, JS, Cameron, SJS, Griffith, GW, Hodson, AJ and Sattler, B. 496
Coupled Cryoconite Ecosystem Structure-Function Relationships Are Revealed by 497
Comparing Bacterial Communities in Alpine and Arctic Glaciers. Fems Microbiology 498
Ecology 2014; 89(2): 222-237 doi: 10.1111/1574-6941.12283 499
Etzelmüller, B, Schuler, TV, Isaksen, K, Christiansen, HH, Farbrot, H and Benestad, R.
500
Modeling the temperature evolution of Svalbard permafrost during the 20th and 21st century.
501
The Cryosphere 2011; 5, 67–79.
22 Forster, RM, Kromkamp, JC. Modelling the effects of chlorophyll fluorescence from
503
subsurface layers on photosynthetic efficiency measurement in microphytobenthic algae. 504
Marine Ecology-Progress Series 2004; 284:9-22 505
Foreman, CM, Wolf, CF and Priscu, JC. Impact of Episodic Warming Events on the Physical, 506
Chemical and Biological Relationships of Lakes in the Mcmurdo Dry Valleys, Antarctica. 507
Aquatic Geochemistry 2004; 10(3): 239-268 508
Hammer, Ø, Harper, DAT, and Ryan, PD. PAST: Paleontological Statistics Software 509
Package for Education and Data Analysis. Palaeontologia Electronica 2001; 4(1): 9pp. 510
Hodson, A, Anesio, AM, Ng, F, Watson, R, Quirk, J, Irvine-Fynn, T, Dye, A, Clark, C, 511
McCloy, P, Kohler, J and Sattler, B. A Glacier Respires: Quantifying the Distribution and 512
Respiration Co2 Flux of Cryoconite across an Entire Arctic Supraglacial Ecosystem. Journal 513
of Geophysical Research-Biogeosciences 2007; 112(G4) doi: G04s3610.1029/2007jg000452 514
Hodson, A, Cameron, K, Boggild, C, Irvine-Fynn, T, Langford, H, Pearce, D and Banwart, S. 515
The Structure, Biological Activity and Biogeochemistry of Cryoconite Aggregates Upon an 516
Arctic Valley Glacier: Longyearbreen, Svalbard. Journal of Glaciology 2010; 56(196): 349-517
362 518
Ihnken S, Kromkamp J, Beardall J, Silsbe G. State-transitions facilitate robust quantum yields 519
and cause an over-estimation of electron transport in Dunaliella tertiolecta cells held at the 520
CO2 compensation point and re-supplied with DIC. Photosynthesis Research 2014; 119:257-521
272 522
Irvine-Fynn, TDL, Bridge, JW and Hodson, AJ. In Situ Quantification of Supraglacial 523
Cryoconite Morphodynamics Using Time-Lapse Imaging: An Example from Svalbard. 524
Journal of Glaciology 2011; 57(204): 651-657 525
Kaczmarek, L, Jakubowska, N, Celewicz-Goldyn, S and Zawierucha, K. The 526
Microorganisms of Cryoconite Holes (Algae, Archaea, Bacteria, Cyanobacteria, Fungi, and 527
Protista): A Review. Polar Record 2016; 52(2): 176-203 doi: 10.1017/s0032247415000637 528
Kromkamp J, Barranguet C, Peene J. Determination of microphytobenthos PSII quantum 529
efficiency and photosynthetic activity by means of variable chlorophyll fluorescence. Mar. 530
23 Larsson, S. Geomorphological effects on the slopes of Longyear Valley, Spitsbergen, after a 532
heavy rainstorm in July 1972. Geogr. Ann. 1982; 64A: 105 - 125 533
Langford, HJ, Hodson, A and Banwart, S. Using Ftir Spectroscopy to Characterise the Soil 534
Mineralogy and Geochemistry of Cryoconite from Aldegondabreen Glacier, Svalbard. 535
Applied Geochemistry 2011; 26: S206-S209 doi: 10.1016/j.apgeochem.2011.03.105 536
Langford, HJ, Hodson, A, Banwart, S and Boggild, C. The Microstructure and 537
Biogeochemistry of Arctic Cryoconite Granules. Annals of Glaciology 2010; 51(56): 87-94 538
Langford, HJ, Irvine-Fynn, TDL, Edwards, A, Banwart, SA and Hodson, AJ. A Spatial 539
Investigation of the Environmental Controls over Cryoconite Aggregation on Longyearbreen 540
Glacier, Svalbard. Biogeosciences 2014; 11(19): 5365-5380 doi: 10.5194/bg-11-5365-2014 541
Lavaud, J and Goss, R. The Peculiar Features of Non-Photochemical Fluorescence 542
Quenching in Diatoms and Brown Algae. Advances in Photosynthesis and Respiration 2014; 543
40: 421-443 544
Lavaud, J and Lepetit, B. An explanation for the inter-species variability of the 545
photoprotective and non-photochemical chlorophyll fluorescence quenching in diatoms. 546
Biochim. Biophys. Acta 2013; 1827: 294-302 547
Lawson, EC, Wadham, JL, Tranter, M, Stibal, M, Lis, GP, Butler, CEH, Laybourn-Parry, J, 548
Nienow, P, Chandler, D and Dewsbury, P. Greenland Ice Sheet Exports Labile Organic 549
Carbon to the Arctic Oceans. Biogeosciences 2014; 11(14): 4015-4028 doi: 10.5194/bg-11-550
4015-2014 551
Lutz, S, Anesio, AM, Villar, SEJ. and Benning, LG. Variations of Algal Communities Cause 552
Darkening of a Greenland Glacier. Fems Microbiology Ecology 2014; 89(2): 402-414 doi: 553
10.1111/1574-6941.12351 554
McMinn A, Ryan KG, Ralph P, Pankowski A. Spring sea ice photosynthesis, primary 555
productivity and biomass distribution in eastern Antarctica, 2002–2004. Mar. Biol. 2007; 556
151:985–995 557
Musilova, M, Tranter, M, Bamber, JL, Takeuchi, N and Anesio, A. Experimental Evidence 558
That Microbial Activity Lowers the Albedo of Glaciers. Geochemical Perspectives Letters 559
24 Perkins, RG , Oxborough, K, Hanlon, ARM, Underwood, GJC and Baker, NR. Can
561
chlorophyll fluorescence be used to estimate the rate of photosynthetic electron transport 562
within microphytobenthic biofilms? Mar. Ecol. Prog. Ser. 2002; 228: 47 - 56 563
Perkins, RG, Mouget, J-L, Lefebvre, S and Lavaud, J. Light response curve methodology and 564
possible implications in the application of chlorophyll fluorescence to benthic diatoms. Mar. 565
Biol. 2006; 149: 703 - 712. 566
Perkins, RG, Kromkamp. JC, Serôdio, J, Lavaud, J, Jesus, B, Mouget, J-L, Lefebvre, S, 567
Forster, RM. The application of variable chlorophyll fluorescence to microphytobenthic 568
biofilms. In Chlorophyll a fluorescence in aquatic sciences: methods and applications, Edited 569
by Suggett, D., Prasil O., & Borowitzka M. Developments in Applied Phycology 2010a; Vol 570
4: 237-275. Springer, UK. ISBN 978-90-481-9267-0. 571
Perkins, RG, Lavaud, J, Serôdio, J, Mouget, J-L, Cartaxana, P, Rosa, P, Barille, L, Brotas, V, 572
Jesus, BM. Vertical cell movement is a primary response of intertidal benthic biofilms to 573
increasing light dose. Mar. Ecol. Prog. Ser. 2010b; 16: 93-103 574
Remias, D, Pichrtová, M, Pangratz, M, Lütz, C and Holzinger, A. Secondary Pigments and 575
Ultrastructure of Chlainomonas Sp. (Chlorophyta) from the European Alps Compared with 576
Chlamydomonas Nivalis Forming Red Snow. Fems Microbiology Ecology 2016; 92(4) doi: 577
10.1093/femsec/fiw030 578
Segawa, T, Ishii, S, Ohte, N, Akiyoshi, A, Yamada, A, Maruyama, F, Li, ZQ, Hongoh, Y and 579
Takeuchi, N. The Nitrogen Cycle in Cryoconites: Naturally Occurring Nitrification-580
Denitrification Granules on a Glacier. Environmental Microbiology 2014; 16(10): 3250-3262 581
doi: 10.1111/1462-2920.12543 582
Serôdio J. Analysis of variable chlorophyll fluorescence in microphytobenthos assemblages: 583
implications of the use of depth-integrated measurements. Aquat Microb Ecol 2004; 36:137– 584
152 585
Stibal, M, Elster, J, Šabacká, M and Kaštovská, K. Seasonal and Diel Changes in 586
Photosynthetic Activity of the Snow Alga Chlamydomonas Nivalis (Chlorophyceae) from 587
Svalbard Determined by Pulse Amplitude Modulation Fluorometry. Fems Microbiology 588
25 Stibal, M, Sabacka, M and Kastovska, K. Microbial Communities on Glacier Surfaces in 590
Svalbard: Impact of Physical and Chemical Properties on Abundance and Structure of 591
Cyanobacteria and Algae. Microbial Ecology 2006; 52(4): 644-654 592
Takeuchi, N. Optical Characteristics of Cryoconite (Surface Dust) on Glaciers: The 593
Relationship between Light Absorbency and the Property of Organic Matter Contained in the 594
Cryoconite. Annals of Glaciology 2002a; 32: 409-414 595
Takeuchi, N. Surface Albedo and Characteristics of Cryoconite (Biogenic Dust) on an 596
Alaskan Glacier, Gulkana in the Alaska Range. Bulletin of Glaciological Research 2002b; 19: 597
63-70 598
Takeuchi, N, Kohshima, S and Seko, K. Structure, Formation, and Darkening Process of 599
Albedo-Reducing Material (Cryoconite) on a Himalayan Glacier: A Granular Algal Mat 600
Growing on the Glacier. Arctic Antarctic and Alpine Research 2001; 33(2): 115-122 601
Tedesco, M, Doherty, S, Fettweis, X, Alexander, P, Jeyaratnam, J and Stroeve, J. The 602
Darkening of the Greenland Ice Sheet: Trends, Drivers, and Projections (1981-2100). 603
Cryosphere 2016; 10(2): 477-496 doi: 10.5194/tc-10-477-2016 604
Van Heukelem, L and Thomas, CS. Computer-assisted high-performance liquid 605
chromatography method development with applications to the isolation and analysis of 606
phytoplankton pigments. Journal of Chromatography A 2010; 910: 31 49 607
Yallop, ML and Anesio, AM. Benthic Diatom Flora in Supraglacial Habitats: A Generic-608
Level Comparison. Annals of Glaciology 2010; 51(56): 15-22 doi: 609
10.3189/172756411795932029 610
Yallop, ML, Anesio, AM, Perkins, RG, Cook, J, Telling, J, Fagan, D, MacFarlane, J, Stibal, 611
M, Barker, G, Bellas, C, Hodson, A, Tranter, M, Wadham, J and Roberts, NW. 612
Photophysiology and Albedo-Changing Potential of the Ice Algal Community on the Surface 613
of the Greenland Ice Sheet. Isme Journal 2012; 6(12): 2302-2313 doi: 614
10.1038/ismej.2012.107 615
Zarsky, JD, Stibal, M, Hodson, A, Sattler, B, Schostag, M, Hansen, LH, Jacobsen, CS and 616
Psenner, R. Large Cryoconite Aggregates on a Svalbard Glacier Support a Diverse Microbial 617
Community Including Ammonia-Oxidizing Archaea. Environmental Research Letters 2013; 618
26 Zawierucha, K, Kolicka, M, Takeuchi, N and Kaczmarek, L. What Animals Can Live in 620
Cryoconite Holes? A Faunal Review. Journal of Zoology 2015; 295(3): 159-169 doi: 621
10.1111/jzo.12195 622
623
27 Table 1. Species Composition of Cryoconite Material (pooled for three cryoconite holes) 625
626
Cyanophyta Chlorophyta Streptophyta Chromophyta
Leptolynbya spp.
Nostoc spp.
Oscillatoria spp.
Pseudoanabaena spp.
Chlamydomonas cf. nivalis
Chlamydomonas spp.
Ancylonema nordenskiöldii
Cylindrocystis brebissonii
Mesotaenium berggrenii
Pennate diatom spp.
627
628
28 Table 2. Concentration of pigments quantified in by HPLC. Values are given as µg.g-1 630
freeze-dried cryoconite material. 631
632
Hole 1 Hole 2 Hole 3
FUCO
(Fucoxanthin) 0.0464 0.0000 0.0513
NEOX
(Neoxanthin) 0.0917 0.0000 0.0227
VX
(Violaxanthin) 0.1180 0.0141 0.0408
DDX
(Diadinoxanthin) 0.0602 0.0275 0.0250
ZX (Zeaxanthin) 0.0543 0.0000 0.0000
LUT (Lutein) 0.6769 0.0176 0.0635
CANT
(Canthaxanthin) 0.4924 1.1182 0.6538
CHLB
(Chlorophyll b) 1.3474 0.4198 0.0801
ECHI
(Echinenone) 0.6267 0.1702 0.2387
CHLA
(Chlorophyll a) 10.6670 6.1472 5.4459 CART
(Carotenoids) 0.3431 0.0000 0.0622
633
634
635
29 Table 3. Pigment ratios relative to Chlorophyll a. For abbreviations, see Table 2.
637
638
Site 1 Site 2 Site 3
FUCO 0.0044 0.0000 0.0094
NEOX 0.0086 0.0000 0.0042
VX 0.0111 0.0023 0.0075
DDX 0.0056 0.0045 0.0046
ZX 0.0051 0.0000 0.0000
LUT 0.0635 0.0029 0.0117
CANT 0.0462 0.1819 0.1200
CHLB 0.1263 0.0683 0.0147
ECHI 0.0588 0.0277 0.0438
CART 0.0322 0.0000 0.0114
639
30 641
[image:30.595.71.523.74.534.2]642
Figure 1. Location of sampling and in situ fluorescence measurements (blue dot) on the surface 643
of Longyearbreen, Spitsbergen, Svalbard. Samples were collected from clean ice with 644
intermittent cryoconite coverage, away from adjacent to areas with high concentrations of 645
surface debris (upper insert, lower blue triangle) and meltwater channels (lower insert, upper 646
blue triangle). 647
31 649
650
651
652
653
Figure 2. Cyanobacteria and algae from Longyearbreen cryconite: a) Nostoc sp. colony; b) 654
Dividing cells of Mesotaenium berggrenii; c) Zygospore of Chlamydomonas cf. nivalis; d) 655
Filament of Ancylonema nordenskiolldii. 656
657
658
659
[image:31.595.78.489.119.427.2]32
PAR (mol m-2 s-1)
0 1000 2000 3000 4000
rETR
(re
l.
units)
0 50 100 150 200 250 300 350
Increasing light curves Decreasing light curves Eilers and Peeters model all data
661
662
Figure 3. Increasing rapid light curve (RLC) data (closed symbols, mean ± s.e., n = 15) showing no 663
saturation in comparison with decreasing RLC data (open symbols, mean ± s.e., n = 15) showing 664
saturated light curves. Fitted line is the Eilers and Peeters (1988) model regressed to the 15 replicate 665
curves data points. Increasing and decreasing light curves were carried out on separate samples each 666
time and with sequentially increasing or decreasing light levels steps respectively. 667
668
669
[image:32.595.75.398.81.325.2]33
PAR (mol m-2 s-1)
0 1000 2000 3000 4000
N
PQ
0 1 2 3 4 5 6
Decreasing Increasing
[image:33.595.85.376.91.325.2]671
Figure 4. Increasing rapid light curve (RLC) non-photochemical quenching (NPQ) data (closed symbols, 672
mean ± s.e., n = 15) and decreasing RLC NPQ data (open symbols, mean ± s.e., n = 15) for the light 673
curves shown in Figure 3. Increasing and decreasing light curves were carried out on separate samples 674
each time and with sequentially increasing or decreasing light levels steps respectively. 675
676
677
34
F
lu
ore
scen
ce y
ei
ld
40 60 80 100 120 140 160
F' Fm'
PAR (mol m-2
s-1
)
0 1000 2000 3000 4000
F
lu
ore
scen
ce y
ei
ld
s
20 40 60 80 100
A
B
679
[image:34.595.75.346.74.451.2]680
Figure 5. Operational fluorescence yield (F’, closed symbols) and maximum fluorescence yield (Fm’, 681
open symbols) yield for increasing (a) and decreasing (b) rapid light curves shown in Figure 1 (both 682
data sets mean ± s.e., n = 15). Data are represented as the percentage of the initial values obtained 683
from the first light curve step in each case (hence 100% at 0 µmol m-2 s-1 for increasing and 100% at 684
3,600 µmol m-2 s-1 PAR for decreasing light curve steps). 685
686
687
35
Time (seconds)
0 200 400 600 800 1000 1200 1400
Quantum
ef
fi
cienc
y
0.0 0.1 0.2 0.3 0.4 0.5 0.6
689
[image:35.595.75.395.79.325.2]690
Figure 6. Quantum efficiency during induction recovery curve measurements (mean ± s.e., n = 8). The 691
boxed area shows the efficiency during the induction phase with applied actinic light, other data points 692
are in darkness. 693
694
695
36 697
Time (seconds)
0 200 400 600 800 1000 1200 1400
Perc
entage
c
hange in
fl
uore
s
c
enc
e y
eild
-100 -80 -60 -40 -20 0 20 40
F and F' (dark and light respectively) Fm and Fm' (dark and light respectively)
[image:36.595.72.436.88.379.2]698
Figure 7. Percentage change, relative to initial values, of the operational fluorescence yield (F and F’ 699
in the dark and light respectively) and maximum fluorescence yield (Fm and Fm’ respectively) during 700
induction recovery curves (mean ± s.e., n = 8). The boxed area shows the yields measured during the 701
induction phase with applied actinic light, other data points are in darkness. 702