Dibromidobis(pyridine-3-carbonitrile-j
N
1)mercury(II)
Reza Ghiasi
Department of Chemistry, Basic Science Faculty, East Tehran Branch, Islamic Azad University, Qiam Dasht, Tehran, Iran
Correspondence e-mail: rezaghiasi1975@gmail.com
Received 6 April 2011; accepted 8 April 2011
Key indicators: single-crystal X-ray study;T= 120 K; mean(C–C) = 0.008 A˚;
Rfactor = 0.030;wRfactor = 0.084; data-to-parameter ratio = 23.1.
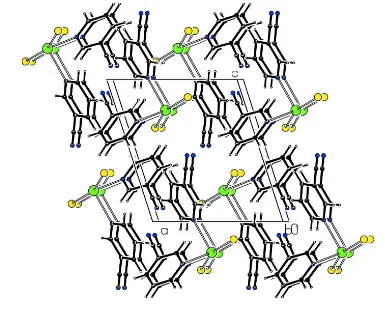
In the crystal structure of the title compound, [HgBr2(C6H4N2)2], the Hg atom is four coordinated by two pyridine N atoms and two Br anions in a considerably distorted tetrahedral environment. –interactions between adjacent pyridine rings [centroid–centroid distance of 3.648 (3) A˚ ] stabilize the crystal structure.
Related literature
For related structures, see: Ghiasi (2011); Steffen & Palenik (1977); Liet al.(2004).
Experimental
Crystal data
[HgBr2(C6H4N2)2] Mr= 568.61
Triclinic,P1 a= 8.5823 (6) A˚ b= 9.4069 (6) A˚ c= 9.8562 (7) A˚
= 81.935 (5)
= 71.435 (6)
= 80.508 (6)
V= 740.70 (9) A˚3 Z= 2
MoKradiation
= 15.78 mm 1 T= 120 K
0.450.220.20 mm
Data collection
Bruker SMART CCD diffractometer
Absorption correction: multi-scan (SADABS; Bruker, 1998) Tmin= 0.033,Tmax= 0.052
8486 measured reflections 3967 independent reflections 3751 reflections withI> 2(I) Rint= 0.043
Refinement
R[F2> 2(F2)] = 0.030 wR(F2) = 0.084 S= 1.18 3967 reflections
172 parameters
H-atom parameters constrained
max= 1.13 e A˚ 3
min= 2.48 e A˚ 3
Data collection:SMART(Bruker, 1998); cell refinement:SAINT
(Bruker, 1998); data reduction:SAINT; program(s) used to solve structure: SHELXTL (Sheldrick, 2008); program(s) used to refine structure: SHELXTL; molecular graphics: ORTEP-3 for Windows
(Farrugia, 1997); software used to prepare material for publication:
WinGX(Farrugia, 1999).
Supplementary data and figures for this paper are available from the IUCr electronic archives (Reference: BT5511).
References
Bruker (1998).SMART,SAINTandSADABS. Bruker AXS Inc., Madison, Wisconsin, USA.
Farrugia, L. J. (1997).J. Appl. Cryst.30, 565. Farrugia, L. J. (1999).J. Appl. Cryst.32, 837–838. Ghiasi, R. (2011).Acta Cryst.E67, m101.
Li, X.-H., Wu, H.-Y. & Hu, J.-G. (2004).Acta Cryst.E60, m1533–m1535. Sheldrick, G. M. (2008).Acta Cryst.A64, 112–122.
Steffen, W. L. & Palenik, G. J. (1977).Inorg. Chem.16, 1119–1127.
Acta Crystallographica Section E Structure Reports Online
supporting information
Acta Cryst. (2011). E67, m595 [doi:10.1107/S1600536811013274]
Dibromidobis(pyridine-3-carbonitrile-
κ
N
1)mercury(II)
Reza Ghiasi
S1. Comment
Recently, the crystal satructure of dibromozinc(II)-di-3-pyridine-carbonitrile have been reported, (Ghiasi, 2011). On the other hand there are several complexes, with formula, [MX2L2], such as [ZnCl2(4-cypy)2], (Steffen & Palenik, 1977),
[CuBr2(3-Cypy)2], (Li et al. 2004), [where py is pyridine, 4-cypy is 4-cyanopyridine and 3-cypy is 3-cyanopyridine] have
been synthesized and characterized by single-crystal X-ray diffraction methods. The molecular structure of the title compound is shown in Fig. 1. The HgII atom is four-coordinated in a slightly distorted tetrahedral configuration by two N
atoms from two pyridine rings and two Br- anions. The Hg—Br and Hg—N bond distances and angles (Table 1) are
within normal ranges. π-π interactions between adjacent pyridine rings [centroid···centroid distance of 3.648 (3) Å, symmetry code: –x,1-y,1-z] stabilize the packing of the crystal structure.
S2. Experimental
Mercury(II) bromide (0.72 gr, 2 mmol) was disolved in methanol (12 ml) and the solution was mixed with a methanolic solution (10 ml) of 3-pyridinecarbonitrile (0.42 g, 4 mmol). This solution was left to evaporate slowly at room
temperature. After one week, colorless prismatic crystals of the title compound were isolated (yield 0.64 g, 56.0%, m.p. < 570 K).
S3. Refinement
Figure 1
The molecular structure of the title molecule, with the atom-numbering scheme. Displacement ellipsoids are drawn at the 50% probability level.
Figure 2
[image:3.610.107.492.355.675.2]Dibromidobis(pyridine-3-carbonitrile-κN1)mercury(II)
Crystal data
[HgBr2(C6H4N2)2]
Mr = 568.61
Triclinic, P1 Hall symbol: -P 1
a = 8.5823 (6) Å
b = 9.4069 (6) Å
c = 9.8562 (7) Å
α = 81.935 (5)°
β = 71.435 (6)°
γ = 80.508 (6)°
V = 740.70 (9) Å3
Z = 2
F(000) = 516
Dx = 2.549 Mg m−3
Mo Kα radiation, λ = 0.71073 Å Cell parameters from 8405 reflections
θ = 2.2–29.2°
µ = 15.78 mm−1
T = 120 K Prism, colorless 0.45 × 0.22 × 0.2 mm
Data collection
Bruker SMART CCD diffractometer
Graphite monochromator phi and ω scans
Absorption correction: multi-scan (SADABS; Bruker, 1998)
Tmin = 0.033, Tmax = 0.052
8486 measured reflections
3967 independent reflections 3751 reflections with I > 2σ(I)
Rint = 0.043
θmax = 29.2°, θmin = 2.2°
h = −11→11
k = −12→12
l = −13→13
Refinement
Refinement on F2
Least-squares matrix: full
R[F2 > 2σ(F2)] = 0.030
wR(F2) = 0.084
S = 1.18 3967 reflections 172 parameters 0 restraints
Primary atom site location: structure-invariant direct methods
Secondary atom site location: difference Fourier map
Hydrogen site location: inferred from neighbouring sites
H-atom parameters constrained
w = 1/[σ2(F
o2) + (0.0481P)2 + 0.8751P]
where P = (Fo2 + 2Fc2)/3
(Δ/σ)max = 0.013
Δρmax = 1.13 e Å−3
Δρmin = −2.48 e Å−3
Special details
Geometry. All e.s.d.'s (except the e.s.d. in the dihedral angle between two l.s. planes) are estimated using the full covariance matrix. The cell e.s.d.'s are taken into account individually in the estimation of e.s.d.'s in distances, angles and torsion angles; correlations between e.s.d.'s in cell parameters are only used when they are defined by crystal symmetry. An approximate (isotropic) treatment of cell e.s.d.'s is used for estimating e.s.d.'s involving l.s. planes.
Refinement. Refinement of F2 against ALL reflections. The weighted R-factor wR and goodness of fit S are based on F2,
conventional R-factors R are based on F, with F set to zero for negative F2. The threshold expression of F2 > σ(F2) is used
only for calculating R-factors(gt) etc. and is not relevant to the choice of reflections for refinement. R-factors based on F2
are statistically about twice as large as those based on F, and R- factors based on ALL data will be even larger.
Fractional atomic coordinates and isotropic or equivalent isotropic displacement parameters (Å2)
x y z Uiso*/Ueq
C3 −0.1559 (7) 0.5491 (5) 0.3719 (5) 0.0241 (9) H3 −0.2534 0.5073 0.3971 0.029* C4 −0.0218 (6) 0.5089 (5) 0.2548 (5) 0.0224 (9) C5 −0.0290 (6) 0.4010 (5) 0.1668 (6) 0.0241 (9) C6 0.1248 (7) 0.5712 (5) 0.2222 (5) 0.0227 (9) H6 0.2146 0.5409 0.1454 0.027* C7 0.2284 (7) 1.0208 (6) −0.0244 (6) 0.0277 (10) H7 0.1906 1.0754 0.0541 0.033* C8 0.1848 (9) 1.0747 (6) −0.1468 (6) 0.0355 (13) H8 0.1204 1.1641 −0.1508 0.043* C9 0.2387 (8) 0.9933 (6) −0.2636 (6) 0.0308 (11) H9 0.2099 1.0259 −0.347 0.037* C10 0.3368 (6) 0.8616 (5) −0.2530 (5) 0.0221 (9) C11 0.3959 (7) 0.7725 (6) −0.3706 (6) 0.0265 (10) C12 0.3758 (7) 0.8154 (5) −0.1251 (5) 0.0237 (9) H12 0.4413 0.7271 −0.118 0.028* Br1 0.59621 (7) 0.60216 (6) 0.12550 (6) 0.02802 (12) Br2 0.25093 (7) 1.02533 (5) 0.34027 (6) 0.02714 (12) Hg1 0.38539 (2) 0.805335 (18) 0.216864 (18) 0.02106 (7) N1 0.1397 (5) 0.6727 (5) 0.2979 (4) 0.0223 (8) N2 −0.0327 (6) 0.3162 (5) 0.0956 (6) 0.0311 (10) N3 0.3219 (6) 0.8943 (5) −0.0129 (5) 0.0238 (8) N4 0.4417 (7) 0.7012 (5) −0.4646 (6) 0.0351 (11)
Atomic displacement parameters (Å2)
U11 U22 U33 U12 U13 U23
Geometric parameters (Å, º)
C1—N1 1.347 (6) C7—H7 0.93 C1—C2 1.384 (7) C8—C9 1.385 (8)
C1—H1 0.93 C8—H8 0.93
C2—C3 1.391 (7) C9—C10 1.389 (7)
C2—H2 0.93 C9—H9 0.93
C3—C4 1.390 (7) C10—C12 1.399 (7) C3—H3 0.93 C10—C11 1.436 (7) C4—C6 1.401 (7) C11—N4 1.148 (7) C4—C5 1.446 (7) C12—N3 1.334 (7) C5—N2 1.144 (7) C12—H12 0.93 C6—N1 1.337 (6) Br1—Hg1 2.4581 (5) C6—H6 0.93 Br2—Hg1 2.4736 (5) C7—N3 1.333 (7) Hg1—N1 2.481 (4) C7—C8 1.381 (8) Hg1—N3 2.496 (4)
N1—C1—C2 122.7 (5) C8—C9—C10 118.4 (5) N1—C1—H1 118.7 C8—C9—H9 120.8 C2—C1—H1 118.7 C10—C9—H9 120.8 C1—C2—C3 120.0 (5) C9—C10—C12 119.1 (5) C1—C2—H2 120 C9—C10—C11 120.7 (5) C3—C2—H2 120 C12—C10—C11 120.1 (4) C4—C3—C2 117.1 (5) N4—C11—C10 179.3 (6) C4—C3—H3 121.4 N3—C12—C10 121.9 (5) C2—C3—H3 121.4 N3—C12—H12 119 C3—C4—C6 120.0 (5) C10—C12—H12 119 C3—C4—C5 121.2 (5) Br1—Hg1—Br2 159.99 (2) C6—C4—C5 118.8 (5) Br1—Hg1—N1 98.01 (10) N2—C5—C4 179.0 (6) Br2—Hg1—N1 97.02 (10) N1—C6—C4 122.1 (5) Br1—Hg1—N3 97.22 (10) N1—C6—H6 119 Br2—Hg1—N3 95.88 (10) C4—C6—H6 119 N1—Hg1—N3 90.10 (14) N3—C7—C8 123.4 (5) C6—N1—C1 118.1 (4) N3—C7—H7 118.3 C6—N1—Hg1 121.2 (3) C8—C7—H7 118.3 C1—N1—Hg1 120.3 (3) C7—C8—C9 118.7 (5) C7—N3—C12 118.5 (5) C7—C8—H8 120.6 C7—N3—Hg1 120.3 (3) C9—C8—H8 120.6 C12—N3—Hg1 121.2 (3)