Self-stratifying microbial fuel cell: The importance
of the cathode electrode immersion height
Xavier Alexis Walter
*, Carlo Santoro, John Greenman, Ioannis Ieropoulos
**Bristol BioEnergy Centre, Bristol Robotics Laboratory, T-Block, Frenchay Campus, University of the West of England (UWE), Bristol, BS16 1QY, United Kingdom
a r t i c l e i n f o
Article history:
Received 16 March 2018 Received in revised form 26 June 2018
Accepted 2 July 2018 Available online xxx
Keywords: Bioenergy Microbial fuel cell Urine
Membrane-less
a b s t r a c t
Power generation of bioelectrochemical systems (BESs) is a very important electrochemical parameter to consider particularly when the output has to be harvested for practical ap-plications. This work studies the effect of cathode immersion on the performance of a self-stratified membraneless microbial fuel cell (SSM-MFC) fuelled with human urine. Four different electrolyte immersion heights, i.e.14= ,24= ,34= and fully submerged were consid-ered. The SSM-MFC performance improved with increased immersion up to34= . The output dropped drastically when the cathode was fully submerged with the conditions becoming fully anaerobic. SSM-MFC with34= submerged cathode had a maximum power output of 3.0 mW followed by 2.4 mW, 2.0 mW, and 0.2 mW for the24= ,14= and fully submerged conditions. Durability tests were run on the best performing SSM-MFC with34= cathode immersed and showed an additional increase in the electrochemical output by 17% from 3.0 mW to 3.5 mW. The analysis performed on the anode and cathode separately demonstrated the stability in the cathode behaviour and in parallel an improvement in the anodic performance during one month of investigation.
©2018 The Author(s). Published by Elsevier Ltd on behalf of Hydrogen Energy Publications LLC. This is an open access article under the CC BY license (http://creativecommons.org/ licenses/by/4.0/).
Introduction
Through the metabolic activity of anaerobic electro-active respiring microorganisms, a microbial fuel cell (MFC) con-verts reduced organic matter (i.e. chemical energy) into elec-tricity[1,2]. In MFCs, microorganisms employ an anode, i.e. a solid electrode, as the terminal electron acceptor of their electroactive anaerobic [3]. This anaerobic respiration of organic matters releases smaller organic molecules, protons
and CO2into the electrolyte. Whilst the protons move from
the anode to the cathode, the electrons pass through an external circuit before arriving at the cathode. At the cathode, the protons and electrons react through a reduction reaction with an oxidant, thus producing current (electrons flow). Several oxidants were considered for the cathode reduction reaction[4]but oxygen is preferred and the most used due to its intrinsic high reduction potential, naturally availability at practically no cost.
*Corresponding author. Bristol BioEnergy Centre (B-BiC), Bristol Robotics Laboratory, T-Block, Frenchay Campus, University of the West of England, Bristol, BS16 1QY, United Kingdom.
**Corresponding author. Bristol BioEnergy Centre (B-BiC), Bristol Robotics Laboratory, T-Block, Frenchay Campus, University of the West of England, Bristol, BS16 1QY, United Kingdom.
E-mail addresses: [email protected] (X.A. Walter), [email protected] (C. Santoro), [email protected]
(J. Greenman),[email protected](I. Ieropoulos).
Available online at
www.sciencedirect.com
ScienceDirect
journal hom epa ge: www.elsev ier.com/locate/he
https://doi.org/10.1016/j.ijhydene.2018.07.033
In addition to the conversion of chemical energy into electrical energy, the MFC technology is of interest because it can treat organic waste from various sources [5e7], with comparable removal rates to the industry sector of waste-water management [8] without spending large amount of energy compared to the existing wastewater treatment pro-cesses that are energy extensive. Due to its capacity of accepting a wide range of organic fuel, this technology could be deployed in numerous types of environment, such as remote and off-grid areas (e.g. refugee camps, small villages)
[9], or the heart of modern society (e.g. wastewater treatment plans, public toilets). Several developments have been pur-sued in recent years on the anode and cathode electrode and on the MFC design in order to increase the power generation that despite has increased few fold still remain low[10e12]. Considering the anode electrode, several novel materials have been investigated[13e15]. Those materials have to possess characteristics such as electrical conductivity, resistance to corrosion, mechanical strength and high surface area[14]. It is important also to consider the cost factor that in a low-power producing technology has to be taken into serious account for scaling up the technology.
[image:2.595.308.539.473.696.2]These features need to match the final purpose of enhancing the interaction between electroactive bacteria and the electrode and also allow the flow of organics and nutrients within the matrix. The most suitable materials that fulfil all the previously mentioned features are mainly carbonaceous materials or metallic materials[16e19]. On the other hand, the oxygen reduction reaction (ORR) is often the limiting reaction occurring in MFCs due to its sluggish kinetic[20,21]. This is due to the neutral (or circumneutral) environment containing low concentration of Hþand OH, both being reactants of the ORR following the acidic or alkaline pathway[22e24]. In order to accelerate the ORR, a catalyst is usually used[25e27]. Three main types of catalyst are used and categorised into: i) plat-inum group metal (PGM) group, ii) platplat-inum group metal-free (PGM-free) and iii) carbonaceous based [25e27]. Whilst platinum-based materials were initially adopted as cathode catalysts, low durability in polluted environments and very high cost hinder its large utilization[28,29]. Recently PGM-free catalysts based on transition metal (e.g. Fe, Mn, Co and Ni
[30,31]) were investigated showing high performance and durability in long run experiments. Unfortunately, the pro-duction cost still remains high[32]and the commercialisation of the product in large scale is still to be implemented.
Mainly due to their lower costs, despite lower electro-chemical performance, carbonaceous-based catalysts are preferred to PGM and PGM-free and highly utilised for MFCs cathodes[27,33,34]. Among the carbonaceous-based catalyst, the most adopted is activated carbon (AC) since it is commercially available at relatively low cost and in large quantities. AC performance in neutral media were superior to carbon black[35]and show high durability in long-term op-erations [36,37]. Furthermore, AC mixed with PTFE (poly-tetrafluoroethylene) and pasted on a stainless steel mesh is, at the current stage, the catalyst that presents (i) a good perfor-mance to cost ratio, (ii) a simple production process and (iii) a good stability over time (i.e. mechanical and chemical resis-tance)[34,38].
Considering MFC design for practical implementation, us-able power levels and increased treatment efficiency are reached when numerous MFCs are assembled in stack or cascade[39,40]. Assembling MFC stacks implies finding equi-librium between unit size, design simplicity and cost. Recently a new concept of self-stratifying membraneless MFC (SSM-MFC) was introduced. This new design not only answer these requirements, but also allows size-scalability with negligible power density losses[9,41,42]. The SSM-MFCs have a plurality of cathodes placed in the upper layers of the electrolyte (i.e. urine) and a plurality of anodes placed in the lower layers, a concept already employed in wastewater treatment [43]. In this work, AC-based cathodes were investigated in SSM-MFC fed with urine as organic source fuel. The effect of the cath-ode immersion height on the electrochemical output and the chemical oxygen demand (COD) degradation was studied. The cathodes performance was initially examined in “clean” media and then in operating SSM-MFCs. Polarisation and power curves were recorded after steady state was reached and after additional 30 days in order to study the durability in long-terms performances.
Material and methods
Reactors construction and operation
The SSM-MFCs were built around a 15 mm acrylic U-shaped core that was sandwiched between two 5 mm thick acrylic plates (Fig. 1). Two U-shaped silicon gaskets maintained the water-tightness. Each SSM-MFCs contained two cathodes placed above two anodes. Two bolts were passing through the whole embodiment and each electrode pairs (Fig. 1). These stainless-steel 316 M4-size bolts were maintaining the
electrodes in position and maintaining a good physical con-tact with them, whilst protruding 20 mm from the sides. Crocodile clips were used to connect the monitoring cables and the fixed resistive loads. The cathodes consisted of a AC/ PTFE (activated carbon (AC); polytetrafluoroethylene (PTFE)) mixture pressed on a stainless-steel 316 mesh (8x8 mesh; 8.3±0.2 g; MeshDirect, UK). The mixture was based on 80%wt of AC (SK1 P75, CPL Carbon Link, UK) and 20%wt PTFE (60% dispersion JX-301, Beijing Starget Chemicals Co.,Ltd, China). The final weight of a single cathode was of 16.7±0.5 g with a AC/PTFE mixture loading of 186±7 mg.cm2. Each cathode
had the following dimensions: 100 mm long, 45 mm wide and 2 mm thick. In parallel, each anode was fabricated using 1000 cm2carbon fibre veil (10 g.m2; Technical Fibre Products
Ltd, Cumbria, UK) that was folded down to a projected surface area of 50 cm2(50 mm100 mm). A strip of stainless-steel 316
mesh (100 mm 15 mm) was fixed in the middle of each anode to act as both a current collector and a structural support.
All the electrodes were submerged in the same electrolyte that was undiluted human urine. The urine was daily collected from a tank pooling together the urine donated by anonymous and healthy individuals with no known previous medical conditions. The urine was kept in a tank for a maximum of 24 h and had probably undergone partial urea hydrolysis by the naturally occurring microflora. The confir-mation of this partial hydrolysis was given by the pH values that were well above neutral measuring between 8.5 and 9.3. The solution conductivity of the urine had measured values of 28±2 mScm1. It was previously reported that human urine
on average comprises 4.7e10.4 g.L1 dry matter of which
65e85% are organic compounds[11]. Urea is the main con-stituent of the total organic solids (z50%)[44]. The SSM-MFCs were inoculated with a mixture comprising 50% (v/v) of the output stream of a matured MFC fuelled with urine, and 50% (v/v) of freshly collected urine. SSM-MFCs with identical height were build and four different immersion depths were investigated. The depths were defined as the proportion of cathode height submerged in the electrolyte:14= ,24= ,34= and 44= . For the44= condition, the urine level was 2 mm above the
cathode. Each of these depths was tested in duplicate and all error bars indicated in the manuscript (unless otherwise stated) stand for the range of these duplicates. The SSM-MFCs were continuously fuelled by the same multichannel peri-staltic pump (Watson&Marlow LTD, UK) and the hydraulic retention time (HRT) was similar among the cells investigated measuring 265± 13 min. The SSM-MFCs were initially run under a constant 500Uload for z5 days, then 300 U, and finally 150U. Only the optimum depth was then tested further under a 120Uload.
Data capture and system characterisation
The SSM-MFC outputs were measured in millivolts (mV) against time using an Agilent LXI 34972A data acquisition/ switch unit (Farnell, UK). Measurements were recorded every 3 min. The current I in Amperes (A) was calculated using Ohm's law,I¼V/R, whereVis the measured voltage in Volts (V) and R is the known value of the external resistor. The power outputPin watts (W) was calculated asP¼IV.
The initial cathode polarizations were performed in neutral electrolyte media and particularly in phosphate buffer with a pH of 7.06 and a solution conductivity of 14.86 mS.cm1). Before starting the polarisation curve in
“clean”media, the cathodes were exposed to the electrolyte for at least 24 h. Linear sweep voltammetry (LSV) were per-formed using a Biologic potentiostat (SP-50, Science instru-ment, France) under a three-electrodes configuration with the anodes being used as counter electrodes, the cathodes as the working electrodes and Ag/AgCl (3M KCl) as reference elec-trode. The scan rate used was 0.25 mV.s1in order to avoid
overestimation of the performance [45]. The cathodes were scanned from open circuit potential (OCP) to250 mV (vs Ag/ AgCl).
The polarisation curves of the mature SSM-MFCs were performed with a two-electrode configuration (potentiostat Biologic SP-50) whereby the reference electrode channel was short-circuited with the counter electrode that was connected to the cathode and the working electrode channel was con-nected to the anode. Simultaneously a reference electrode (Ag/AgCl) was placed equidistant between anode and cathode (i.e. 5 mm from each other,Fig. 1) and the anode and cathode separate potential variation during the polarisation curve was measured using a PicoTech data logger (ADC-24, Pico Tech-nology Ltd). This operation was done in order to obtain the polarisation curves of both anodes and cathodes separately. Also in this case, the scan rate was 0.25 mV.s1and ranged
from OCV to 50 mV.
The chemical oxygen demand (COD) analyses were per-formed using the potassium dichromate oxidation method (COD HR test vials, Camlab, UK) with 0.2 mL of inlet and outlet samples taken before and after the MFC treatment. The du-plicates samples of the inlet were taken in the tubbing commonly feeding all the SSM-MFCs. The outlet samples were taken directly at the output of each SSM-MFCs. The outputs of the conditions tested in duplicate were then averaged. The results here presented show the average of two distinct SSM-MFCs having the same immersion height. The vials were heated at 150C during two hours and cooled to room tem-perature before the measurements were taken using an MD 200 photometer (Lovibond, UK).
Results and discussion
Cathodes polarisation curves in clean media
The cathodes were initially characterised in“clean”media (i.e. phosphate buffer solution, pH¼7.06; EC¼14.86 mS.cm1) and
were approximately 355 mV. These results are in agreement with previous literature utilising activated carbon based cathodes[46,47].
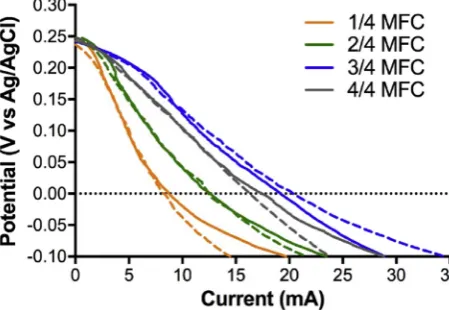
The results from the polarisation curves show an increase in electrocatalytic activity when the submerged part increase from14= ,24= to34= of the cathode height. Particularly,
consid-ering the current produced at 0 mV vs Ag/AgCl, the cathode submerged14= produced 8.44± 0.4 mA. In comparison, the
current increased up to 12.5±0.1 mA when under24=
condi-tions, and to 19.7±0.8 mA when under 34= condition. This
corresponded to an enhancement of 48% and 133%, respec-tively. Interestingly the electrochemical output slightly decreased when the cathodes were fully submerged (44=
condition) even if remain better than the 24= condition
measuring a produced current of 16.8±0.8 mA (Fig. 2). The latter corresponded to a reduction of 15% compared to the most performing condition (i.e.34= ). Overall, the results show
that the cathodes behaviours are reproducible.
At this initial stage and in“clean”media, results indicate that the optimum immersion height was34= of the cathode
submerged in the electrolyte (Fig. 2). The more the surface area of the cathode is submerged into the electrolyte, the higher are the performance (Fig. 2). However, results of these polarisation curves already show that in clean media the cathodes is limited when completely submerged (i.e.44= condition; Fig. 2). This
might be due to the fact that the despite higher surface area was in contact with the liquid electrolyte, the oxygen diffusion from the surface of the water column (air/liquid interface) to the bottom part of the cathode might be limiting.
Temporal power production under continuous loading
After the cathode polarisation curves, the SSM-MFCs were inoculated using the effluent of other MFCs also fuelled with urine and fresh urine with a ratio in volume of 1:1. Microbial fuel cells were left in open circuit for roughly 5 h prior con-necting the external load. Following the initial phase of inoc-ulation, the resistive loads applied to the SSM-MFCs were
progressively decreased from 500U(z5 days), 300U(z2 days) to 150 U(10 days). Since the SSM-MFCs were placed under continuous flow of fuel, once the produced power plateaued, it was considered that the SSM-MFCs reached steady state. Once the steady states were reached, then heavier loads were applied. An example of this condition (steady state) is clearly visible in Fig. 3, after 150 h when placed under the 150 U constant load.
The results recorded for 10 days under continuous 150U
external load show that the24= and34= immersion conditions
had the highest power output compared to the other two conditions that were investigated. The SSM-MFCs under34=
condition were the most efficient in agreement with the cathode polarisation results obtained in phosphate buffer. The SSM-MFCs that had their cathodes fully submerged (44=
conditions) did not produce any significant power (3.0 ± 1.8mW;Fig. 3). Differently than cathode polarisation experiment carried out in clean media (Fig. 2), the SSM-MFCs with fully submerged cathodes did not have good perfor-mances in a complex media colonized by life. This probably indicates that the implication of the microbiota activity (e.g. anoxia). Considering the last 75 h of the experiment, during which steady state was reached (n ¼1800;Fig. 3), the SSM-MFCs with the cathodes submerged to 14= were producing z38% less power than the SSM-MFCs under 34= conditions
(1075±85mW and 1725±32mW during the last 75 h, respec-tively). Compared to the34= conditions, the SSM-MFCs with24=
submerged cathodes were producing 89% less power (1535±29mW).
Polarisation of the SSM-MFCs in urine
After maintaining steady state condition for a period of time of 3 days (Fig. 3), the SSM-MFCs were characterised through an overall polarisation curve in a classic two-electrode configu-ration, with the electrolyte completely replaced by fresh urine. The anode and cathode potentials were at the same time recorded separately, using another data logger, against a sin-gle Ag/AgCl 3M KCl reference electrode, which was placed
Fig. 2ePolarisation curves of the cathodes in phosphate buffer (pH¼7.06; EC¼14.86 mS.cm¡1) prior inoculation. Solid and dashed lines represent duplicate independent reactors. The data are not presented as average with error bars in order to emphasise the reproducibility of the tests, at low current levels.
[image:4.595.53.278.518.673.2] [image:4.595.308.539.536.696.2]equidistant from both electrodes. SSM-MFCs were operating at constant electrolyte pH of 9.3. At this pH, the theoretical open circuit voltage (OCV) of an operating MFC is averagely 1130 mV. This is the consequence of the redox potential dif-ference between the cathodic reaction involving the oxygen (zþ460 mV vs Ag/AgCl at pH¼9.3) and the anodic organic oxidation reaction performed by the anaerobic microbiota (z -670 mV vs Ag/AgCl at pH¼9.3).
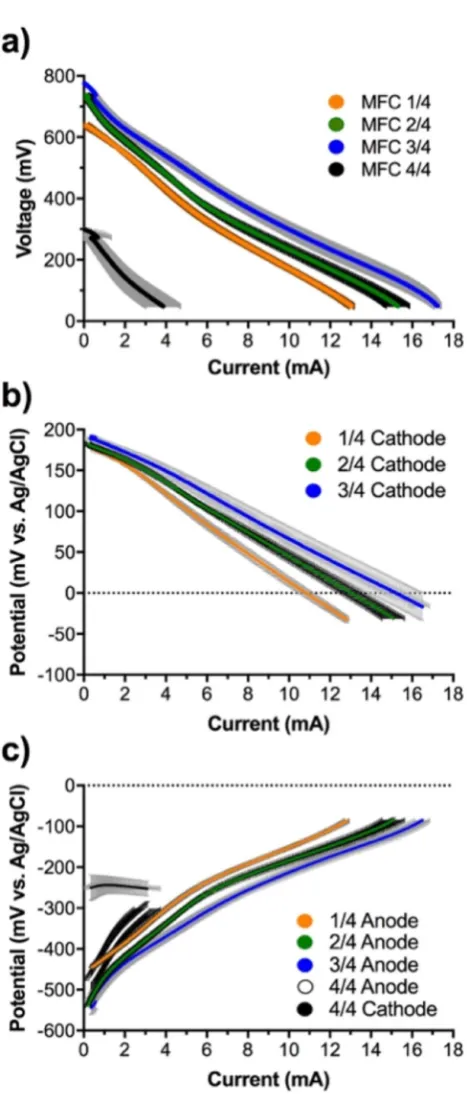
As shown by the polarisation curves, beside the SSM-MFCs that had completely submerged cathodes, the SSM-MFCs displayed two OCV levels. On one hand, the24= and34=
con-ditions had similar OCV values of 733±7 mV and 755±28 mV, respectively. On the other hand, the SSM-MFC with cathode submerged to14= had OCV values of 643±7 mV (Fig. 4a). The
fully submerged cathodes displayed the lowest OCV values of 237±16 mV. The34= condition displayed the higher
electro-chemical performance, followed by the24= and14= conditions.
The SSM-MFCs with the fully submerged cathodes displayed the worst performance (Fig. 4a).
Generally, the slopes of all semi-submerged cathodes were somewhat linear, implying that they were driven by ohmic losses. However, some differences could be observed. Despite starting from the same OCV, the34= had higher slope than24= ,
for lower current, whereas both of them had a similar slope at higher current (>7 mA). The SSM-MFC with cathodes sub-merged to14= had similar slope compared to the34= conditions,
even if it seems penalised mainly from the initial starting point that was roughly 110 mV lower (Fig. 4a). This difference of OCV values indicates that a phenomenon is affecting either the cathode or the anode operating in the latter conditions. In order to understand which of the two electrodes is affected, the anodes and cathodes were considered and studied separately.
The cathode potential curves indicate that, with the exception of the fully submerged cathodes, all conditions displayed a similar cathode OCP (Fig. 4b). These results imply that the differences in the measured OCVs were then mainly affected by the anode OCP and not by the cathode OCP. Averagely, the cathode OCP values of all the semi-submerged cathodes were 183±8 mV vs Ag/AgCl. These are values that are in agreement with previously published literature [35]. Conversely, the OCP of the fully submerged cathodes were displaying a negative value of 250 ± 32 mV vs Ag/AgCl (Fig. 4c). Negative cathode OCP implies that when the cath-odes were completely submerged (i.e. urine level 2 mm above the cathode) complete anoxic environment is occurring. This observation confirm that part of the cathode is necessary to be exposed directly to the atmosphere for SSM-MFC to function efficiently[41]. This finding is of extreme importance since it implies that complete anoxia is reached at 2 mm depth in a urine column colonised by microorganisms. However, as shown by the results, the cathodes of all the semi-submerged were clearly not in anoxia, even though they were submerged more than 2 mm in depth. It be could hypothesized that the emerged part of these cathodes was acting as a redox snorkel for the biofilm developing in the anaerobic part of the urine column by driving the potential of the cathodes as if they were completely in aerobic conditions. This hypothesis is sup-ported by previous studies that employ this “snorkel phe-nomenon” to enhance chemical oxygen demand (COD)
Fig. 4eElectrochemical characterisation of the mature SSM-MFCs. a) Voltage-current polarisation curves of the whole cell form OCV to 50 mV. b) Potential-current polarisation curves of the cathodes. c) Potential-current polarisation curves of the anodes. The curves are the average of each conditions duplicates and the error bars stand for the values range. N.B.The cathode potential-current curve for the fully submerged44= condition, is shown in
[image:5.595.311.545.75.623.2]removal rate in wastewater[48,49]. The SSM-MFCs having34=
submerged cathodes had the best electrochemical perfor-mance (Fig. 4b), followed by the SSM-MFCs having24=
sub-merged cathodes, and finally the SSM-MFCs having 14=
submerged cathodes. This might be due to the fact that more surface area of the electrode is directly in contact to the electrolyte and therefore more active sites are available for catalysing and reducing oxygen. Moreover, the ohmic resis-tance decreased with more cathode area exposed to the electrolyte and this is confirmed by the decreasing slope of the cathodes (Fig. 4b).
Considering the anode potential curves, the anode OCP of the24= and34= conditions had similar values of539±4 mV vs
Ag/AgCl and544±18 mV vs Ag/AgCl, respectively (Fig. 4c). These values are comparable to previously published work in slightly alkaline environment and anaerobic conditions[50]. Conversely, the SSM-MFCs having 14= submerged cathodes
had higher anode OCP values of445±6 mV vs Ag/AgCl. This higher anode OCPs could be explained by the lower column height of urine that separate the anode electrode from the atmosphere and consequently it can be speculated that that oxygen or other oxidants (e.g. nitrate) could interfere with the anodic oxidation potential. This result, is further supported by the slope of the14= submerged SSM-MFC being the same as the
anode potential of the24= submerged cathode (Fig. 4c).
How-ever, another hypothesis could be that the anode potential reflects the limitation of the cathode potential due to the fact that less surface area of the electrode is exposed to the elec-trolyte. In comparison to these two tested conditions, the anode potential curve of the 34= conditions is flatter and
display the best electrochemical performance, in accordance with previous results (Figs. 3 and 4a,b).
Power production and treatment efficiency
An important parameter to consider for practical imple-mentation is the maximum power that can be produced by a microbial fuel cell (MFC) along with its treatment efficiency. When deployed under real condition of use, most MFC sys-tems try to find a balance between these two aspects[51e53]. Hence, with the exception of microbial electrochemical snorkel [48,49], microbial fuel cells do not run under maximum current but they run close to the maximum power transfer point.
The power curves were obtained from the polarisation curves shown inFig. 4a. Power curves results indicate that when the cathodes were completely submerged, the SSM-MFCs produce low levels power of 211 ± 55 mW (Fig. 5). Conversely, results from the power curves shows that, the SSM-MFC having34= submerged cathodes produced the
high-est power level of 3000±157mW at a voltage of 321±1 mV and a current of 9.4±0.5 mA (Fig. 5). In terms of maximum power, the following best conditions were the SSM-MFCs obtained with24= submerged cathodes (2396 ±101mW; 281 ± 1 mV;
8.5 ± 0.4 mA) and then with 14= submerged cathodes
(1984±21mW; 281±1 mV; 7.1±0.1 mA) (Fig. 5). Interestingly, if the two-latter tested conditions had different power levels, their maximum power transfer point was reached at the same voltage (281±1 mV). Submerging the cathodes from14= to24=
increased the potential maximum power production of 21%. A
further14= increase of the submerged cathode surface area
enhanced the maximum power production of a further 25%, resulting in a total increase of 51%. Finally, completely sub-merging the cathodes decreased the potential maximum power production by 89%. These results confirm that the more the surface area of cathode is immersed, the higher the maximum potential power produced was, whilst maintaining the need of having part of the cathodes exposed to air.
As explained above, deploying MFC-system in real life environment implies the treatment of organic waste streams. Measuring the chemical oxygen demand (COD) removal is the most common way to evaluate the treatment efficiency of a system. Therefore, the COD was measured at the inlet of the SMM-MFCs and compared to the values measured at the outlet of the four tested conditions. It has to be reminded that COD removal rates are correlated to the hydraulic retention time (HRT) and that during the whole experiment, the HRT between the tested conditions were kept very similar as explained above.
The SSM-MFCs had an initial COD loading of 5.37±0.06 gCOD.L1 (Fig. 6a). Compared to the tested three
semi-submerged cathode conditions, the SSM-MFCs with fully submerged cathode displayed an insignificant COD removal of z0.1%. Conversely, the semi-submerged cathodes displayed an organic load removal ranging from 9.4%, 22.2%, to 39.4%, in correlation to the cathode immersion height of14= ,24= , and34=
respectively (Fig. 6a). The final COD concentration for the three condition was 4.86±0.65 gCOD.L1, 4.18±0.45 gCOD.L1
and 3.25±0.78 gCOD.L1respectively.
In order to see a correlation between power and treatment efficiency, the average maximum power produced (Fig. 5) was plotted against the COD removal rate (Fig. 6a). Results show that the COD removal rate was positively correlated to the power/current produced and therefore to the immersion height of the cathodes (i.e. surface area of cathode in contact with the electrolyte) (Fig. 6b). These results demonstrate that the SSM-MFCs having34= submerged cathodes were the most
efficient in terms of COD removal.
Stability of the system over time
The long-term stability of microbial fuel cells is often not re-ported in literature but it is of extreme importance to evaluate possible practical application and evaluate the robustness of the system over time. The most performant SSM-MFCs were therefore monitored over a period of 30 days to assess the stability of the SSM-MFC system. Based on the results previ-ously described, the SSM-MFCs with34= submerged cathodes
that were the best performing were selected. Following results from the polarisation experiment (Fig. 5), the resistive load was changed to 120Uand the voltage monitored over time (sampling 1 point every 3min). The power was then calculated using ohms'law (P¼VI).
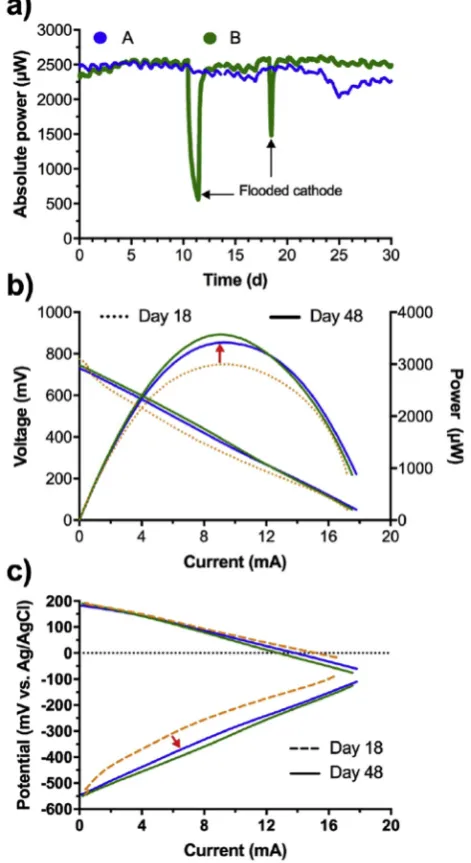
During the course of the experiment, the outlet pipe of SSM-MFC-B got clogged twice (Fig. 7a, MFC-B, green color). The consequence of a clogged pipe is that the urine level inside the SSM-MFC rises and completely submerged the cathodes causing drastic drop in the power output recorded. This behaviour further supports the fact that completely sub-merged cathodes are detrimental to the performance of
SSM-MFCs. Interestingly, the results show that once the pipe was manually unclogged and the level of urine decreased covering only¾of the cathode, the MFC-B rapidly recovered its previ-ous power output, thus illustrating the robustness of system toward perturbation (Fig. 7a). Without taking the clogging Fig. 6e(a) Chemical oxygen demand (COD) concentration
between the inlet common to all the SSM-MFCs and the respective outlets of each SSM-MFC. The data are the average from duplicate and independent SSM-MFCs and the error bars stand for the values range. (b) Plot of the average power against the COD removal rate depending on the tested conditions.
[image:7.595.57.286.65.366.2] [image:7.595.311.547.72.504.2]issue into account, results show that both duplicate had similar power output over 23 days. Over that period of time, the SSM-MFCs were producing 2469±70mW (n¼21668). From day 23 to day 25, an unidentified phenomenon occurred which affected the power performance of MFC-A. From day 25 to day 30 the power increased but did not reach the same power output as at day 23 (Fig. 7a). The power output can be considered anyway reproducible with an average at day 30 of 2398±116mW (n¼960). Nonetheless, results show that the setup was stable over a period of 30 days.
At day 30, the SSM-MFCs were then refuelled with fresh urine and left in OCV for 1 h. Overall polarisation curves of the SSM-MFCs were measured with the simultaneous recording of anode and cathode electrode potentials during the polarisation and presented inFig. 7b and c respectively. Interestingly, the polarisation curves show similar OCV and slope compared to the one run initially. The power obtained actually increased by 16.7% compared to the initial recorded power. The potentials of anode and cathode recorded sepa-rately were important to understand the change in perfor-mance shown in the overall polarisation curve (Fig. 7b). Cathode polarisation curves measured after 30 days in steady-state operations were similar to the one recorded initially (Fig. 7c). Remarkably, the anode polarisation curves improved over time probably due to a better anode coloni-sation from electroactive bacteria. The anode and cathode polarisation curves of the SSM-MFCs showed reproducibility with a very low deviation.
Conclusion
In this study, carbon veil anode and activated carbon-based cathode were investigated in SSM-MFCs fuelled with urine. The main goal of this work was to identify the best cathode submersion height in order to increase the power output and the organic removal of the SSM-MFC. Among the four different heights investigated (14= ,24= ,34= and44= ), the
cath-ode and overall performance increased progressively from
14= to34= indicating that a greater contact between cathode
and electrolyte positively affect the oxygen reduction elec-trocatalysis. A further increases in height till the cathode was fully submerged, lowered drastically the cathode and cell potential suggesting the establishment of anoxic con-ditions. One month long-terms performance were run for the SSM-MFCs with the cathode immersed for 34= . The
power measured through polarisation curves actually indi-cated an increase of 16.7% from the initial value of 3.0 mWe3.5 mW. Anode and cathode polarisation curves showed that the cathode behaviour was constant over the 1 month operation while the anode actually improved over time.
Acknowledgement
The authors would like to acknowledge the Bill& Melinda Gates Foundation for funding the scientific work (grant no. OPP1149065).
r e f e r e n c e s
[1] Rabaey K, Verstraete W. Microbial fuel cells: novel biotechnology for energy generation. Trends Biotechnol 2005;23:291e8.
[2] Logan BE, Hamelers B, Rozendal RA, Schrorder U, Keller J, Freguia S, et al. Microbial fuel cells: methodology and technology. Environ Sci Technol 2006;40:5181e92. [3] Kumar A, Hsu LHH, Kavanagh P, Barriere F, Lens PNL,
Lapinsonniere L, et al. The ins and outs of microorganism-electrode electron transfer reactions. Nat Rev Chem 2017;1. [4] Ucar D, Zhang Y, Angelidaki I. An overview of electron
acceptors in microbial fuel cells. Front Microbiol 2017;8. [5] Ledezma P, Stinchcombe A, Greenman J, Ieropoulos I. The
first self-sustainable microbial fuel cell stack. Phys Chem Chem Phys 2013;15:2278e81.
[6] Bajracharya S, Srikanth S, Mohanakrishna G, Zacharia R, Strik DP, Pant D. Biotransformation of carbon dioxide in bioelectrochemical systems: state of the art and future prospects. J Power Sources 2017;356:256e73.
[7] Pandey P, Shinde VN, Deopurkar RL, Kale SP, Patil SA, Pant D. Recent advances in the use of different substrates in microbial fuel cells toward wastewater treatment and simultaneous energy recovery. Appl Energy 2016;168:706e23. [8] Rozendal RA, Hamelers HVM, Rabaey K, Keller J,
Buisman CJN. Towards practical implementation of bioelectrochemical wastewater treatment. Trends Biotechnol 2008;26:450e9.
[9] Walter XA, Stinchcombe A, Greenman J, Ieropoulos I. Urine transduction to usable energy: a modular MFC approach for smartphone and remote system charging. Appl Energy 2017;192:575e81.
[10] Logan BE. Scaling up microbial fuel cells and other bioelectrochemical systems. Appl Microbiol Biotechnol 2010;85:1665e71.
[11] Santoro C, Arbizzani C, Erable B, Ieropoulos I. Microbial fuel cells: from fundamentals to applications. A review. J Power Sources 2017;356:225e44.
[12] Rinaldi A, Mecheri B, Garavaglia V, Licoccia S, Di Nardo P, Traversa E. Engineering materials and biology to boost performance of microbial fuel cells: a critical review. Energy Environ Sci 2008;1:417e29.
[13] Mustakeem. Electrode materials for microbial fuel cells: nanomaterial approach. Mater Renew Sustain Energy 2015;4. [14] Wei J, Liang P, Huang X. Recent progress in electrodes for
microbial fuel cells. Bioresour Technol 2011;102:9335e44. [15] Guzman JJL, Pehlivaner Kara MO, Frey MW, Angenent LT.
Performance of electro-spun carbon nanofiber electrodes with conductive poly(3,4-ethylenedioxythiophene) coatings in bioelectrochemical systems. J Power Sources
2017;356:331e7.
[16] Baudler A, Schmidt I, Langner M, Greiner A, Schroder U. Does€ it have to be carbon? Metal anodes in microbial fuel cells and related bioelectrochemical systems. Energy Environ Sci 2015;8:2048e55.
[17] Erable B, Byrne N, Etcheverry L, Achouak W, Bergel A. Single medium microbial fuel cell: stainless steel and graphite electrode materials select bacterial communities resulting in opposite electrocatalytic activities. Int J Hydrogen Energy 2017;42:26059e67.
[18] Guerrini E, Cristiani P, Grattieri M, Santoro C, Li B, Trasatti S. Electrochemical behavior of stainless steel anodes in membraneless microbial fuel cells. J Electrochem Soc 2014;161:H62e7.
[20] Rismani-Yazdi H, Carver SM, Christy AD, Tuovinen OH. Cathodic limitations in microbial fuel cells: an overview. J Power Sources 2008;180:683e94.
[21] Madjarov J, Popat SC, Erben J, G€otze A, Zengerle R, Kerzenmacher S. Revisiting methods to characterize bioelectrochemical systems: the influence of uncompensated resistance (iRu-drop), double layer capacitance, and junction potential. J Power Sources 2017;356:408e18.
[22] Kinoshita K. Carbon: electrochemical and physicochemical properties. New York: John Wiley Sons; 1998.
[23] Kinoshita K. Electrochemical oxygen technology. New York: John Wiley Sons; 1992.
[24] Erable B, Feron D, Bergel A. Microbial catalysis of the oxygen reduction reaction for microbial fuel cells: a review. ChemSusChem 2012;5:975e87.
[25] Antolini E. Composite materials for polymer electrolyte membrane microbial fuel cells. Biosens Bioelectron 2015;69:54e70.
[26] Yuan H, Hou Y, Abu-Reesh IM, Chen J, He Z. Oxygen reduction reaction catalysts used in microbial fuel cells for energy-efficient wastewater treatment: a review. Mater Horiz 2016;3:382e401.
[27] Wang Z, Cao C, Zheng Y, Chen S, Zhao F. Abiotic oxygen reduction reaction catalysts used in microbial fuel cells. ChemElectroChem 2014;1:1813e21.
[28] Minachev KM, Shuikin NI, Rozhdestivenskaya ID. Poisoning of platinum catalysts with a low content of active metal on a Carrier, under conditions of dehydrogenation catalysis. Bull Acad Sci USSR Div Chem Sci 1952;1:567e75.
[29] Santoro C, Li B, Cristiani P, Squadrito G. Power generation of microbial fuel cells (MFCs) with low cathodic platinum loading. Int J Hydrogen Energy 2013;38:692e700. [30] Costa de Oliveira MA, Mecheri B, D'Epifanio A, Placidi E,
Arciprete F, Valentini F, et al. Graphene oxide nanoplatforms to enhance catalytic performance of iron phthalocyanine for oxygen reduction reaction in bioelectrochemical systems. J Power Sources 2017;356:381e8.
[31] Kodali M, Santoro C, Serov A, Kabir S, Artyushkova K, Matanovic I, et al. Air breathing cathodes for microbial fuel cell using Mn-, Fe-, Co- and Ni-containing platinum group metal-free catalysts. Electrochim Acta 2017;231:115e24. [32] Santoro C, Kodali M, Herrera S, Serov A, Ieropoulos I,
Atanassov P. Power generation in microbial fuel cells using platinum group metal-free cathode catalyst: effect of the catalyst loading on performance and costs. J Power Sources 2018;378:169e75.
[33] Santoro C, Kodali M, Kabir S, Soavi F, Serov A, Atanassov P. Three-dimensional graphene nanosheets as cathode catalysts in standard and supercapacitive microbial fuel cell. J Power Sources 2017;356:371e80.
[34] Wang Z, Mahadevan GD, Wu Y, Zhao F. Progress of air-breathing cathode in microbial fuel cells. J Power Sources 2017;356:245e55.
[35] Merino-Jimenez I, Santoro C, Rojas-Carbonell S, Greenman J, Ieropoulos I, Atanassov P. Carbon-based air-breathing cathodes for microbial fuel cells. Catalysts 2016;6.
[36] Zhang X, Pant D, Zhang F, Liu J, He W, Logan BE. Long-term performance of chemically and physically modified activated carbons in air cathodes of microbial fuel cells.
ChemElectroChem 2014;1:1859e66.
[37] Santini M, Marzorati S, Fest-Santini S, Trasatti S, Cristiani P. Carbonate scale deactivating the biocathode in a microbial fuel cell. J Power Sources 2017;356:400e7.
[38] Walter XA, Greenman J, Ieropoulos I. Binder materials for the cathodes applied to self-stratifying membraneless microbial fuel cell. Bioelectrochemistry 2018;123:119e24.
[39] Ieropoulos I, Greenman J, Melhuish C. Microbial fuel cells based on carbon veil electrodes: stack configuration and scalability. Int J Energy Res 2008;32:1228e40.
[40] Ledezma P, Greenman J, Ieropoulos I. MFC-cascade stacks maximise COD reduction and avoid voltage reversal under adverse conditions. Bioresour Technol 2013;134:158e65. [41] Walter XA, Gajda I, Forbes S, Winfield J, Greenman J, Ieropoulos I.
Scaling-up of a novel, simplified MFC stack based on a self-stratifying urine column. Biotechnol Biofuels 2016;9:93. [42] Walter XA, Merino-Jimenez I, Greenman J, Ieropoulos I. PEE
POWER®urinal IIeurinal scale-up with microbial fuel cell scale-down for increased lighting. J Power Sources 2018. [43] Jiang D, Curtis M, Troop E, Scheible K, McGrath J, Hu B, et al.
A pilot-scale study on utilizing multi-anode/cathode microbial fuel cells (MAC MFCs) to enhance the power production in wastewater treatment. Int J Hydrogen Energy 2011;36:876e84.
[44] Rose C, Parker A, Jefferson B, Cartmell E. The
characterization of feces and urine: a review of the literature to inform advanced treatment technology. Crit Rev Environ Sci Technol 2015;45:1827e79.
[45] Velasquez-Orta SB, Curtis TP, Logan BE. Energy from algae using microbial fuel cells. Biotechnol Bioeng
2009;103:1068e76.
[46] Watson VJ, Nieto Delgado C, Logan BE. Improvement of activated carbons as oxygen reduction catalysts in neutral solutions by ammonia gas treatment and their performance in microbial fuel cells. J Power Sources 2013;242:756e61. [47] Watson VJ, Nieto Delgado C, Logan BE. Influence of chemical
and physical properties of activated carbon powders on oxygen reduction and microbial fuel cell performance. Environ Sci Technol 2013;47:6704e10.
[48] Erable B, Etcheverry L, Bergel A. From microbial fuel cell (MFC) to microbial electrochemical snorkel (MES):
maximizing chemical oxygen demand (COD) removal from wastewater. Biofouling 2011;27:319e26.
[49] Yang Y, Guo J, Sun G, Xu M. Characterizing the snorkeling respiration and growth of Shewanella decolorationis S12. Bioresour Technol 2013;128:472e8.
[50] Oliot M, Etcheverry L, Mosdale A, Basseguy R, Delia ML, Bergel A. Separator electrode assembly (SEA) with 3-dimensional bioanode and removable air-cathode boosts microbial fuel cell performance. J Power Sources 2017;356:389e99.
[51] Hiegemann H, Herzer D, Nettmann E, Lubken M, Schulte P, Schmelz KG, et al. An integrated 45 L pilot microbial fuel cell system at a full-scale wastewater treatment plant. Bioresour Technol 2016;218:115e22.
[52] Wan JF, Gu J, Zhao Q, Liu Y. COD capture: a feasible option towards energy self-sufficient domestic wastewater treatment. Sci Rep 2016;6.