1
ENVIRONMENTAL IMPACTS OF FOOD RETAIL
:
A
FRAMEWORKMETHOD AND CASE APPLICATION
This paper is currently as a corrected proof. Although corrected proofs do not have all bibliographic details available yet, they can already be cited using the year of online publication and the DOI , as follows: author(s), article title, Publication (year), DOI. The web address for this paper and DOI is at: http://www.sciencedirect.com/science/article/pii/S095965261501313X
Peter Bradley1,2
1Centre for Environmental Strategy, School of Engineering (D3), University of Surrey, Guildford, Surrey GU2 7XH, UK
2 Bristol Economic Analysis, University of the West of England, Frenchay Campus, Coldharbour Lane, Frenchay, Bristol, BS16 1QY, 0117 328 3444.
Keywords: retail; sustainable production; sustainable procurement; environmental input-output; sustainable consumption; city.
2
planning sustainable provision and procurement; by helping benchmark sustainable shopping provision, prioritisation of retail businesses and product categories for sustainable procurement/choice editing.
1. Introduction and Background
Environmental impacts of food products such as CO2 and water use are a global issue and critical to living within threshold values for key global environmental pressures that society must observe to stay within a safe operating space for humanity (Garnett 2008, Rockström et al 2009, Beddington et al 2011). In the UK and Europe, food provision plays a key role in the generation of greenhouse gases (GHGs). The food chain produces GHG emissions at all stages in the life cycle, including farming and its inputs, manufacture, distribution, refrigeration, retailing, food preparation in the home and waste disposal (Garnett 2011) 1. Food provision also strongly implicates water use, for example, the total water footprint of the UK is 102 Gm3 per year, nine times the annual flow of the river Thames, the majority, 74.8 GM3/yr of this is embodied in agricultural products (WWF 2008).
Food retailers globally have a key role in determining consumption and sustainable production choices in our food systems and therefore associated environmental impacts. On this basis, the aim of this paper is twofold: 1.) To present a method for overcoming barriers in applying input-output to investigate environmental impacts embodied in food product provision by the food retail sector. 2. ) To present a framework for enabling comprehensive GHG emissions and water use estimates/accounts for individual and all food retail businesses within a city and with resolution to individual products; this can be used to help prioritise products on which to focus sustainable procurement as well as provision within an area.
Background
Sustainable consumption has the potential to play a key role in reducing GHGs and water use associated with meeting food related needs and wants globally (UNEDSA 2007, Garnett 2008, 2011 Audsley et al 2009). In order to bring about changes in consumption toward lower
3
embodied GHG products, institutions have developed systems for carbon footprint labelling such as PAS2050. It is however, not a given that information and labelling of products available in some shops will give rise to more sustainable products or large scale shifts in consumption towards lower embodied GHG or water products (Sustainable Consumption Roundtable 2006, Vittersø and Tangeland 2014, Akenji 2014 amongst others). Once information is provided, there is a need for consumers to acknowledge information and actively alter consumption towards lower impacting products (Berry et al 2008). The success of labelling in bringing about the transition to lower carbon or lower water food provision rests on the notion that consumer purchasing habits will switch to low impacting alternatives and that these will be available (Gadema et al 2011). In relation to consumer choice however, Clarke et al (2006) identifies that there appears to be a notable degree of stability in many shopping practices over time, and further that attitudinally, the underlying factors determining store choice are broadly the same in 2002 as they were 20 years earlier in 1982. Gadema et al (2011) provide empirical evidence on the attributes that determine consumer choice of products (in stores). They identify that carbon embodied in food is fairly low down the priority list in terms of attributes that determine the consumers decisions within shops, other attributes such as quality, nutrition, price etc. are generally considered more important2. The UK Sustainable Development Commission (2007) states that most people expect products brought to be environmentally and socially responsible, similarly as they expect safety of products to be a pre-requisite, research by the Green Alliance (2010) also support this view.
In relation to availability, Clarke et al (2006) also provide challenging information here, they identify the difficulties that consumers can sometimes face in terms of consumer choice, both shop and product availability are affected by locality and geography which are key aspects that effect consumer choice. Jackson et al (2006a) conclude (from their research) that quality and price are crucial attributes of choice within stores, but importantly also identify the concepts of consumer convenience and accessibility as playing a key role in consumer choice between
stores. This concept/differentiation of between and within stores is likely to be important in sustainable consumption and therefore a potential fruitful area for further research. From reading Jackson et al (2006a) it is clear that local shopping provision within a given locality is influenced by the businesses that are available within an area. Due to locality, some consumers have limited choice and in this way their choice is “locked in” to certain shops and available products (often less sustainable) due to the context of their life situation.
2
4
The research above as well as others such as Broken and Allwood (2012) and Vörösmarty et al (2011), suggests a strong role for retail businesses but also government/NGOs in ensuring availability and provision of sustainable products within an area as a pre-requisite. Retailers have a key role to play in monitoring the emissions and water use of the products they choose to sell and actively procuring out or alternatively, warning against the most environmentally damaging products (in their shops). In this way they help ensure more sustainable choices by consumers. In this sense, food retailers have a role as gatekeepers to the environmental sustainability of consumer choices and enablers of sustainable consumption.
In order to help retailers in this role and encourage provision of sustainable products within a local area, perspectives and frameworks that can help retailers efficiently produce proxy benchmarks for their businesses and products are urgently needed. Building on the literature above, frameworks should also provide a comprehensive geographical referenced benchmarking to allow government to estimate impacts (GHGs, water use etc.) and opportunities for sustainable shopping provision within an area. When focusing on estimates to inform sustainable procurement and choice editing, impacts attributable to provision should be identified (as opposed to emissions attributed to consumption or production); see Bradley et al (2013) for a detailed discussion and justification.
Until now, the desired framework discussed above has been missing for the food retail sector therefore leading to one of the aims of this paper. Benchmarks from such a framework can help illustrate impacts and prioritise product categories and areas for monitoring and choice editing, therefore not just leaving all the decisions and action up to consumers. Importantly, such benchmarks need to be efficient and enable a businesses to quickly prioritise the most important products (in terms of environmental impacts) for further attention, for their business, as it is clear from even large food retailers experience that businesses struggle with resource required to estimate their environmental impacts embodied in provision (Guardian 2012). Tesco recently started leading in this area, pledging to label all its products with their carbon footprint. In 2012 however they dropped their carbon label pledge citing that too much work was involved and that other retailers failed to follow their lead (Guardian 2012).
5
2009). This forms a substantial barrier to efficient environmental estimations for this sector. This is because within the national input-output accounts, food product’ transactions for the Retail sector are stripped out and put within the sectors that produce the products. So for Food retail, the product transactions are put within the Manufacturing of food products and beverages sub sectors. This is done when putting together the input-output tables. The transactions in all sub sectors of Manufacturing of food products and beverages, appear as intermediate and final demand. A method is documented in this paper to overcome this issue, addressing the first aim of this paper and enabling environmental I-O modelling to generate provision estimates for the food retail sector, as well as the development of the desired framework for this important sector. The framework is applied to a case study for the UK.
The framework for CLARE is described in Section 2. Section 3 demonstrates the framework for food retail businesses in Southampton (UK). Discussions and conclusions are conducted in Section 4.
2
The framework method
6
Figure 1: An outline of the Commercial Local Area Resource and Emissions (CLARE) Model.
For CLARE-direct, modelling makes use of sector (macro) and individual business (micro) data but final outputs are produced for businesses (micro level). EIO analysis modelling is done at the sector level (macro). For CLARE-indirect, modelling makes use of sector (macro) and business (micro) data but final outputs are produced for businesses and products (micro level). For simplicity, the term emissions will be used to describe GHG emissions or water use for the remainder of this section. A method and approach for estimation of environmental estimates for individual and all businesses in an area for all other sectors (beyond Retail) was published in Bradley et al (2013) along with an input-output modelling perspective when investigating emissions embodied in provision (consistent with the life cycle analysis/inventory approach applied by businesses); the provision perspective.
2.1 CLARE-direct (production perspective estimation)
The key equation that CLARE-direct applies to estimate direct emissions occurring from a business is quite simple as seen in equation 1. This example is for a single company in sector j.
j o o t u
e (1)
Where:
CLARE-direct
CLARE-indirect Environmental
input – output
Estimates of GHG emissions
7 o
e is the direct emissions occurring from business o (CO2e for this paper);
o
t is the estimated turnover for the business o; and
j
u is the average emissions per unit turnover for the relevant sector (sector j), corresponding
with the business;
The challenge in implementing CLARE-direct is to find data to represent a single business, this is illustrated here for a single business in the UK.
Before equation 1 can be applied, both to and uj have to be estimated for a business. A range
of steps are required to produce to and uj using various datasets and equations (datasets can
be seen in Figure 2). The first step is to select the specific food retail sector (i) for which one needs to estimate emissions of businesses within a geographic area.
The remaining steps, 2, 3 and 4 are outlined in Figure 2 (equation 1 is conducted lastly at the
bottom of the figure). Steps 2 and 3 are applied to estimate to. Step 4 is applied to estimate
j
[image:7.595.152.499.467.683.2]u .
Figure 2: An overview of CLARE–direct.
Once the sector is identified from step 1, the Business Structure Database (BSD) can be searched for all businesses within the sector, within a defined area. Once businesses are found from the BSD it is possible to identify the full 5 digit (most disaggregated level) Standard
Emissions per £1M turnover (or GVA)
for SIC coded sectors
Emissions of a SIC coded business (o)
within a specific area
UK emissions & turnover by sector Business Structure
Database (BSD)
Number of employees (size band) and SIC code of
business in a specific geographical
location
Average annual turn-over per employee for each sector employee
size band (£M)
Turnover of the business (o)
8
Industrial Code (SIC) that each business belongs to, the number of employees3 and the post code. For each business in the group, the following steps are conducted.
The average annual turnover for the relevant business now needs to be estimated (step two). The Annual Respondents Database (ARD) is used for this. Unlike the BSD, this dataset does not include businesses representing 99% of all UK output, but is a large dataset and has good representation for different business sub sectors (ONS 2008). For the businesses that are within the database however, the number of variables and the ‘richness’ of the data is much higher than in the BSD. The ARD is searched to find all businesses within the same size band and SIC sector (5 digit) as the relevant business found in the BSD. Businesses found are termed as matching businesses. The key details used to match businesses are the SIC code and number of employees. Once matched retail businesses are found, the calculation of the average turnover per employee for these businesses occurs in step 2 as follows:
n
i i
i j
m t n
f 1 i = 1 to n where n is the number of businesses in the sample (2)
Where:
j
f is the average turnover per employee for a given size band and SIC code j;
ti is the turnover for the matching businesses i found in the ARD; and
mi is the number of employees in business i within the matching sample.
This enables turnover estimation for business (o) isolated from the BSD dataset as shown in equation 3 (step 3):
to = f jmo (3)
Where:
o
t is the estimated business turnover for the business o; and
o
m is the number of employees of the business o.
Step four uses various databases to obtain the annual emissions (or water use) data for a sector (and size band if possible) and turnover. Emissions per unit turnover is estimated in equation 4:
j j j
t e
u (4)
9
Where:
j
u is the emissions coefficient for sector j (i.e. emissions per unit of turnover);
ej are the emissions of sector j; and
tj is the turnover of sector j.
j
u from equation 4 and to from equation 3 are used in equation 1 to estimate direct emissions;
Environmental data:
GHG data were predominantly used from ONS (2010) in this study, but BERR Energy Consumption in the United Kingdom: Service Sector Data Tables (BERR 2008), were also used along with knowledge of the Defra carbon dioxide intensity per unit of fuel burnt to provide a more disaggregated figure for direct estimation for the Food retail sector as documented in Bradley (2013). For direct and indirect water use estimation, the most up to date data was the Defra water supply and abstraction data (2006) sent by Harris (2010) on behalf of Defra. Beyond water supplied and abstracted by industry (termed blue water), water (in the form of moisture) stored within UK soil (green water) is used by vegetative plants that the UK agriculture industry sell on to consumers. The environmental impacts associated with the latter water use (green) are generally a lot lower than from those of water supplied by water companies or abstracted (WaterWise 2007) and the focus was blue water. The definitions of blue and green water are from Hoekstra and Chapagain (2007). Environment Agency C&I Waste survey (2002) and (1999) were used for sector wide C&I waste figures. These data were the best sector wide data, robustness checks of these data (due to their age) were performed in Bradley et al (2009), and this work suggests that they estimate reasonably well. This was the only disaggregated and detailed sector wide dataset for C&I waste collected in a consistent way across all sectors and therefore applicable in the environmental input-output model.
2.2 EIO method for the Food retail sector
Leontief first developed input-output analysis and the frameworks that enable this analysis (Millar and Blair, 1985). The basic Leontief input-output model can be extended into an EIO model capable of estimating emissions attributable to consumption in a given region, resulting from final demand expenditure (in sectors).The framework referred to by Miller and Blair (1985) as the limited Leontief EIO system is used to develop the basic EIO framework for this study. See equation (5):
y ) A I ( ' u
e 1
(5)
10
e is a vector of the emissions attributable to final consumption; u is a vector of emissions coefficients for a region; and
'
u is the transpose of u. I is an identity matrix;
A is the technical coefficient matrix4; and y is a vector of final demands.
As mentioned, there is an issue with modelling food retail using input-output, as food products sold by the retail sector are primarily present in producing sectors in I-O tables (not the retail sector). To overcome this issue and enable EIO modelling for the food retail sector, this study takes the approach of generating product by product indirect emissions multipliers for the relevant producing sectors and then apply these to product sales data for relevant food retail businesses (of an area). This allows one to then estimate the indirect emissions embodied in each and every product sold by the food retail sector (all relevant businesses within an area). The EIO modelling used to generate estimates with CLARE-indirect is now presented. In section 2.3, CLARE-indirect is applied in combination with EIO estimates to estimate indirect emissions resulting from food retail product sales.
To be consistent with the data in CLARE-indirect there is a need for emissions to be in the form of emissions per £ of sales to final demand of each of the Manufacturing of food products and beverages sub-sectors. To get to this stage, firstly we need to estimate the emissions embodied in household5 final demand sales for each of the sub sectors. For this reason EIO modelling of the Food Retail sector, makes use of the following equation: 0 0 0 0 ) ( ' 2 2 hh hh y 1 A I u
e (6)
4
A technical coefficient (aij) of the A matrix characterises the inputs from industry i that are required as a result of an increase in one unit of industry j. Such a coefficient is generated by dividing inter-industry sales from sector i to sector j (over e.g. a year) by the output of industry j for the same time frame.
11 Where:
2
ehhis a vector of emissions embodied in household final demand of the Manufacturing of food products and beverages sub sector (sector 2); and
hh
y2 is the household final demand of the Manufacturing of food products and beverages
sub-sector (sector 2);
This method estimates the direct and indirect emissions attributable to household final demand of the Manufacturing of food products and beverages sub-sector (sector 2). In reality there are sixteen sub-sectors within the Manufacturing of food products and beverages sector in the UK input-output accounts; sector 2 only represents one of them. The modelling in this project is carried out for all 16 detailed food producing sub sectors.
Amending the model to avoid double counting for the Food retail sector
The EIO modelling for the Food retail sector in the current study will (as an output) produce figures of direct as well as indirect emissions embodied in product sales. In CLARE-direct however, direct emissions and water use are already estimated, so to use both estimates of CLARE-direct and CLARE-indirect would result in double counting. Therefore in this study EIO is used purely to capture indirect emissions (which are later used by CLARE-indirect). There is therefore a need to develop methods to adjust the EIO model outputs, so that direct emissions of the sector (Food retail sector) are not included within estimates produced. This is done by adjusting the emissions coefficient
u of the Food retail sector in the EIO model.
Amendments for the Food retail sector’s products
12 1 2 2 2 4 5 0
0 '( ) 0
0 0 1
e I - A
hh hh u u y u u (7) Where:
u2 is the emissions coefficient for the Manufacturing of food products and beverages sub-sector. u1, u4 and u5are the emissions coefficients of sectors 1, 4 and 5. Sector 3 is the Retail sector and so has its emissions coefficient replaced with a zero6.
For equation 7 there are two first steps in conducting adjustments to the u vector before the model can be run:
First obtain the environmental accounts used in making the u vector. Then take out from the environmental accounts the direct emissions for the Retail sector7. The change will then be reflected in the emissions coefficient vector (u) of the model, as seen in equation 7;
The model (equation 7) is then run. The new outputs from the model will have emissions attributable to the Manufacturing of food products and beverages sub-sector final demand (yhh
2 ). The emissions estimate will however, exclude any emissions
originating from the Food retail sector (so direct emissions of the Food retail sector), thus avoiding double counting.
Adjusting the emissions coefficients u of the EIO model works in avoiding double counting and removing all direct emissions from all Food retail businesses at the sector level (with no international trade), but not at the individual business level with trade. At the individual food retail business level, indirect emissions are potentially occurring from businesses in the same sector and so therefore are not part of a business of concerns direct emissions but perhaps part of its indirect. If this is the case then these
13 indirect emissions should be counted in hh
2
e , but from equation 7 they will not be. In this study, the ‘small business assumption’ is applied: In principle some food retail business indirect emissions may occur from other retail businesses and should technically appear as indirect emissions for the business of concern, but these emissions are very small/minimal and so it is assumed that they can be ignored. From supply and use tables it can be seen that the Retail sector trades very little with itself, and the Manufacturing of food products and beverages sub-sector buys very little from the Retail sector, so this further reduces any error and justifies the ‘small business assumption’.
The foreign emissions attributable to household final demand of the Manufacturing of food products and beverages sub-sector, now has to be estimated. In order to account for this, the basic framework is extended to a two region model following Proops et al. (1993) and Jackson et al (2006). The two region model was deemed to be the clearest and best way to ensure transparency and tractability through the framework and estimates produced. Transparency and tractability of any framework that attempts to produce detailed estimates for business are important as business may want to compare their emissions estimates with those of CLARE. To do so would require knowledge of the assumptions and datasets applied. Use of large numbers of datasets for many countries as would occur if a multiregional EIO model was used, would reduce the tractability and transparency of estimates the pros and cons of this decision are discussed in Appendix A. The two region model also enables the study to keep a relatively high level of disaggregation throughout the modelling. Using the two region model of Proops et al (1993) and later Jackson et al (2006), this is conducted as seen in equation 8.
(8)
Where:
is a vector of the foreign emissions attributable to UK household final demand of the Manufacturing of food products and beverages sub-sector;
hh 2 hh 1 2 0 y
'( ) ( ) 0
0 0 1
e u I - A B I - A
hh 2
14
is the imports use coefficients matrix for imports from region β to region α .
Double counting of direct emissions is not an issue when modelling the rest of the world emissions, as the UK business for which modelling in conducted is based in the UK, so the chances of any double counting are very minimal.
Input – output table data
Input-output data and accounts previously used for EIO modelling were from Wiedmann et al (2008). These tables are fairly disaggregated at 123 UK sectors and were the most up to date and robust tables available at the time of PhD. The tables were developed by leading experts in the field, the Department for Environment Food and Rural Affairs commissioned the tables and so these were the most valid tables for use. The PhD project managed to further disaggregate 3 key agriculture sectors further (resulting in a 126 sector model) and this is documented in detail in Bradley (2013), detailed checks were conducted to ensure that the model estimated correctly, these are also provided in the thesis. This was important in ensuring more accurate estimation for food product categories.
2.3 CLARE-indirect (food retail businesses)
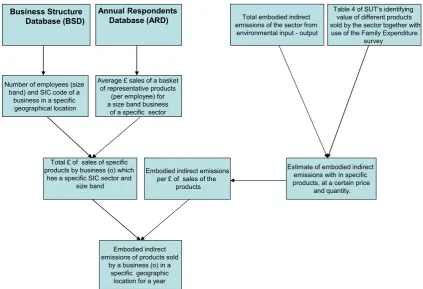
Clare-indirect puts businesses at the forefront of attention as opposed to sectors (EIO). For selected businesses, CLARE-indirect estimates the sales of products by businesses (total products) and attributes indirect emissions of products to these business product sales (using estimates from sector level models). A detailed system diagram is provided in Figure 3.
15
Figure 3: An overview of CLARE-indirect (for Food retail sector businesses). The first step is to pick the specific retail sector for which one needs to estimate emissions of business or businesses within a geographic area. Once the sector is identified, the BSD can be searched for all retail businesses of the detailed sub sector, within a defined area (all businesses with postcodes within Southampton Unitary authority). Once business(es) are found from the BSD it is possible to reveal the full 5 digit SIC that each business belongs to, the number of employees and the post code of the business. For each business of the group of businesses selected, the following step 2 is conducted (the example business shown in Figure 3 and equation 9, is denoted by subscript (o)).
In step two there is a need to calculate the average sales for a basket of representative products for a specific size band and SIC of the retail business, which matches the SIC and employee profile of the business identified in step one. This is done through searching the Annual Respondents Database to find all retail businesses with matching details. Once matched businesses are found, calculation of the average sales for the range of different products supplied by the business is estimated (per employee). This is shown mathematically for product r in the equation below:
Total embodied indirect emissions of the sector from
[image:15.595.113.537.69.358.2]environmental input - output
Table 4 of SUT’s identifying value of different products sold by the sector together with use of the Family Expenditure
survey
Average £ sales of a basket of representative products
(per employee) for a size band business
of a specific sector Number of employees (size
band) and SIC code of a business in a specific geographical location
Estimate of embodied indirect emissions with in specific products, at a certain price
and quantity. Total £ of sales of specific
products by business (o) which has a specific SIC sector and
size band
Embodied indirect emissions per £ of sales of the
products
Embodied indirect emissions of products sold
by a business (o) in a specific geographic
location for a year
Business Structure Database (BSD)
16
n i i r i r j m p ns_ 1 i = 1….n (8)
Where: r
j
s_ is the average sales of a product r per employee for the given size band and SIC code j;
r i
p is the sales of a product r for matching retail businesses i found in the ARD; and
mi is the number of employees of the businesses i.
Step three brings together outputs from steps one and two and estimates the total sales of each product type for the retail business of concern (business o), by taking the average sales of products per employee and multiplying this by the number of employees (m is this time taken from the BSD as opposed to the ARD) for the business (o). The procedure can be written out mathematically as follows:
o r
j r
o s m
p _ (9)
Where: r o
p is the estimated sales of product r for a specific retail business o; and o
m is the number of employees of the business o.
17
(ONS 2005). An assumption of step four is that emissions can be distributed pro-rata to specific types of products in accordance with how the Family Spending report allocate (in a more detailed way) expenditure to products. It is hoped that in future, data will become available that will allow this assumption to be avoided.
Once the amount of embodied indirect emissions for a set of products is known, a set of average embodied indirect emissions intensities can be produced for the products. This is done by dividing total embodied indirect emissions within products by the total household expenditure on products, as seen mathematically in equation 10:
r h r h r
y e
u_ (10)
Where: r
u_ is the average embodied indirect emissions per unit of expenditure for a given product r;
r h
e is the total embodied indirect emissions for the total amount of a product r that households (h) buy; and
r h
y is the household (h) expenditure for the given same products r.
Finally step five requires the bringing together of steps three and four to estimate the emissions attributable to the product (r) sales of the retail business of concern (business o). This is calculated by applying the following equation:
r r o r
o p u
e _ (11)
Where: r o
18
3.1 Demonstrating the framework with the case study
In this section a demonstration of the application of the framework to model the food retail sector in Southampton at different scales and different levels of resolution is provided. This can help in answering different questions for businesses and policy makers.
Aggregate results: Southampton Unitary Authority
Results for food retail businesses in Southampton, UK are reported in Figures 4 and 5. Results are primarily for GHGs, water use, but also commercial and industrial (C&I) waste. Clearly from Figures 4 and 5, it can be seen that the Food retail businesses have very high indirect water impacts. Most of this water is extracted for food production by the fish and fish farming and Agriculture sectors8. The large amount of indirect GHGs are the result of the food products sold by these businesses, the most important sector where these emissions are actually emitted is Agriculture. With regards to food waste, indirect emissions are also more dominant than direct, production and provision estimates are more even for C&I waste. The general dominance of indirect impacts, flags up the opportunity to retailers to develop strategies and policies for sustainable procurement to reduce emissions and water use embodied in the products that they make available to consumers.
19
Figure 4: The direct (production perspective) and indirect (provision perspective) GHG emissions, C&I waste, food waste and water use of food retail businesses in
Southampton Unitary Authority in 2004.
Figure 5: The percentage of direct (production perspective) and indirect (provision perspective) GHG emissions, water use, C&I waste, and food waste for food retail
businesses.
0 100000 200000 300000 400000 500000 600000
GHGs water use C&I waste food waste
To
n
n
e
s
Indirect Direct
0 10 20 30 40 50 60 70 80 90 100
GHGs water use C&I waste food waste
Per
ce
n
t
food retail businesses
[image:19.595.134.518.390.706.2]20
3.2 Emissions and water use of businesses
The resolution possible when using CLARE is now demonstrated for different business types. Business types are businesses classified at the most detailed five digit SIC codes. Results for different business types are presented by looking at emissions and water use profiles for typical individual businesses with 10 employees, in Figure 6. These are not actual existing individual businesses as publishing such information would be disclosive, but such estimates are available in in the outputted business estimates stored in the secure environment9, which can be accessed by any qualified analyst/planners desk top computer.
From Figure 6, it can be seen that businesses can have quite different emissions impacts. Meat retail has the highest GHGs and C&I waste impacts. It is noticeable that the impacts are mainly embodied indirect impacts. Therefore, the focus for these businesses should very much be on assessing how they can reduce their indirect impacts, through sustainable procurement or other mechanisms. Retail of tobacco businesses have comparatively low impacts. For the imported component, see Appendix B.
21
Figure 6: The GHGs and C&I waste profiles for different Food retail and Hospitality business types. 0
100 200 300 400 500 600 700
Direct GHGs
Indirect GHGs
Direct C&I waste
22
23
Figure 7: The water use profiles for different Food retail and Hospitality business types.
0 5 10 15 20 25 30 35 40 45 50 Retail_Non specialised stores
Retail_fruit and veg Retail_ meat and
meat products Retail_fish and shellfish Retail_bread, cakes, flour confectionary and. Retail_alcoholic and other beverages
Retail_tobbacco products Other retail_food, beverages and tobacco, specialised Wate r (t h o u san d s o f m e tr e s cu b e d )
Businesses with 10 employees
Direct water use
24
3.3 Indirect emissions and water use of products
Emissions and water use embodied in products of the businesses provides a further level of resolution for businesses and policy makers and can help prioritise product types for sustainable procurement and choice editing by businesses. Broken and Allwood (2012) identify that choice editing is a key strategy that as yet has been under exploited by companies.
25
Figure 8: The indirect GHG profiles for different product types for each business (with 10 employees).
Retail_Non specialised stores Retail_fruit and veg
Retail_ meat and meat products Retail_fish and shellfish
Retail_bread etc
Retail_alc. and non alc. beverages Retail_tobbacco prod.
Other retail_ specialised (food, beverages and tobacco)
0 100 200 300 400 500 600
G
H
G
s
(t
on
ne
s)
Products
Retail_Non specialised stores
Retail_fruit and veg
Retail_ meat and meat products
Retail_fish and shellfish
Retail_bread etc
26
27
Figure 9: The indirect water use profiles for different product types for each business.
Retail_Non specialised stores Retail_fruit and veg
Retail_ meat and meat products Retail_fish and shellfish
Retail_bread etc
Retail_alc. and non alc. beverages Retail_tobbacco prod.
Other retail_ specialised (food, beverages and tobacco)
0 5 10 15 20 25 30
w
at
e
r
(t
hou
sa
nds
of
m
e
tr
e
s
cube
d)
Products
Retail_Non specialised stores
Retail_fruit and veg
Retail_ meat and meat products
Retail_fish and shellfish
Retail_bread etc
28
4
Conclusions
This paper identified two barriers to EIO modelling of the food retail sector; one being that the retail sector is often heavily aggregated in I-O tables; the second being due to the way that I-O tables are constructed (in the UK and other countries). This paper presents a method for overcoming these barriers and enables environmental input-output analysis to be conducted for the important food retail sector. Overcoming these barriers and enabling environmental input-output for this key sector is an important contribution of scientific value. The resulting CLARE framework for the food retail sector can be applied for individual and all retail businesses and products of an area by postcode. The generation of such a framework model capable of this has not been presented before and is a key contribution of scientific value. Results and findings from such a framework model can be used by government and businesses to efficiently benchmark important areas for sustainable procurement within business and in terms of benchmarking shopping provision within areas of cities. In these ways, the framework and its estimates can be of value as a first step, to benchmarking environmental impacts of businesses and product provision/shopping provision in a city. The benchmarking allows policy makers to identify likely impacts of retailers and encourage them to prioritise and demonstrate credentials for sustainable procurement as ‘gatekeepers’ for sustainable consumption. A key value added by the approach, is that it enables policy makers to produce direct and indirect emissions and water use estimates across businesses and areas from the same sectors on a comparable basis with consistent datasets and methods, system boundary and a transparent approach. This addresses issues found in the business reporting literature.
29 Acknowledgements
30 Appendix A
Limitations and assumptions of the modelling approach the CLARE model has a number of assumptions and limitations that should be made clear. CLARE-direct assumes that turnover can be estimated for the business of concern based on knowing a business’s employment, and the average turnover per employee for a detailed business employee size band and subsector. In future this assumption can be avoided for some businesses, as the Business Structure Database has enterprise data where actual turnover is recorded and it is thought to be quite accurate to use this in some situations. Monte Carlo simulations carried out as part of the study, show that for many businesses of an area, the application of average turnover per employee is a reasonable way of estimating turnover and the emissions or water use of a business.
More detailed assessment of the assumption is however required. CLARE-direct also assumes that the average direct emissions or water use per unit turnover (for a detailed sector and sometimes
employee size band) can be used in conjunction with the estimated turnover of a business to produce the emissions or water use for a business. The extent of inaccuracy caused by this assumption was
found to rely very heavily on the extent to which sector and sometimes employee size band emissions data is aggregated, particularly for earlier work on waste. In general it was found that this assumption when making use of heavily aggregated sector data has the most potential to cause inaccuracies in CLARE-direct. CLARE-indirect makes the same assumption when estimating turnover for businesses as used when estimating for CLARE-direct. It is also assumes that average indirect emissions or water use per unit of turnover at a sector level can be used in conjunction with the turnover of a business to produce a correct estimate of the indirect emissions or water use for a business. Again, it was found that detailed environmental data particularly for waste has a strong influence on improved estimation. Disaggregation of economic datasets can also be important, but was not found to be as critical. The assumptions inherent in EIO analysis also apply to the indirect estimates developed in the current study. For more detail
on these assumptions and limitations with regards to GHGs see Jackson et al. (2007). See Miller and Blair (1985) for more detail and references on the assumptions of both input-output and EIO.
31
application of CLARE for single business applications will require agreement and involvement of government, but the potential is clearly there. CLARE makes use of SIC codes, in some situations a business may be classed under two different SIC codes and some may find that SIC codes do not sufficiently describe their activities.
In estimating indirect emissions and water use, the current study made use of a two region model when
conducting sector EIO modelling. The two region model applies the domestic technology
32
A full multi regional model, or a quasi-multi-regional input-output model, as developed by Druckman and Jackson (2009), could be have been used. For a review of various types of models to account for trade effects, see Wiedmann et al (2007). With regards to uncertainties for different types of models see Weber (2008). Weber (2008, p.22) states that: “It is clear that several large uncertainties exist in the creation and use of environmental MRIO models, though it is also clear that their use is increasing due to the increasing desire to model international trade and differences in production practices across countries. Different modellers choose MRIO for different reasons, and for some uses (such as approximating multidirectional trade for a large number of commodities in countries with less detailed IOTs) the advantages of MRIO models probably outweigh the additional uncertainties in their use. However, as argued here, it is important to remember that MRIO models are no panacea for modelling the impacts of global trade. The necessary aggregation and simplification, along with exchange rate uncertainty, rest-of-world assumptions, and several other unquantifiable uncertainties make MRIO a minefield for practitioners desiring fairly accurate numbers”. He goes on to state that:
33 Appendix B
Figure 8b: The imported indirect GHG profiles for different product types for each business (with 10 employees).
Retail_Non specialised stores Retail_fruit and veg
Retail_ meat and meat products Retail_fish and shellfish
Retail_bread etc
Retail_alc. and non alc. beverages Retail_tobbacco prod.
Other retail_ specialised (food, beverages and tobacco)
0 20 40 60 80 100 120 140 160 180
GHGs
(t
o
n
n
e
s)
Products
Retail_Non specialised stores
Retail_fruit and veg
Retail_ meat and meat products
Retail_fish and shellfish
Retail_bread etc
34
Figure 9b: The imported indirect water use profiles for different product types for each business (with 10 employees).
Retail_Non specialised stores Retail_fruit and veg
Retail_ meat and meat products Retail_fish and shellfish
Retail_bread etc
Retail_alc. and non alc. beverages Retail_tobbacco prod.
Other retail_ specialised (food, beverages and tobacco)
0 1 2 3 4 5 6 7
wat
e
r
(t
h
o
u
san
d
s
o
f m
e
tr
e
s c
u
b
e
d
)
Products
Retail_Non specialised stores
Retail_fruit and veg
Retail_ meat and meat products
Retail_fish and shellfish
Retail_bread etc
35
Figure 10b: The imported indirect C&I waste profiles for different product types for each business (with 10 employees).
Retail_Non specialised stores Retail_fruit and veg
Retail_ meat and meat products Retail_fish and shellfish
Retail_bread etc
Retail_alc. and non alc. beverages Retail_tobbacco prod.
Other retail_ specialised (food, beverages and tobacco)
0 2 4 6 8 10 12 14 16
C&
I
waste
(
To
n
n
e
s)
Products
Retail_Non specialised stores
Retail_fruit and veg
Retail_ meat and meat products
Retail_fish and shellfish
Retail_bread etc
36 References
Akenji L. (2014). Consumer scapegoatism and limits to green consumerism. Journal of Cleaner production, 63, pp. 13-23.
Australian Bureau of Statistics (2000). Australian National Accounts: Concepts, Sources and
Methods. Accessed: 21/05/2015. Available at:
http://www.abs.gov.au/AUSSTATS/[email protected]/2f762f95845417aeca25706c00834efa/2c38faaf4e 50a211ca2569a400061627!OpenDocument
Audsley, E., M. Brander, J. Chatterton, D. Murphy-Bokern, C. Webster and A. Williams (2009). How low can we go? An assessment of greenhouse gas emissions from the UK food system and the scope for reduction by 2050. WWF- UK and the Food Climate Research Network.
Berry, T., Crossley, D., & Jewell, J. (2008). Check-out carbon: The role of
carbon labelling in delivering a low-carbon shopping basket. London: Forum for the Future.
Broken N.M.P and J.M. Allwood (2012). Strategies to reduce the carbon footprint of consumer goods by influencing stakeholders. Journal of Cleaner of Cleaner Production, 35, pp. 118-129.
Foran, B., M. Lenzen, C. Dey, M. Bilek (2005) “Integrating sustainable chain management with triple bottom line accounting”. Ecological Economics, 52, (2), pp.143-147.
Beddington, J., Asaduzzaman, M., Fernandez, A., Clark, M., Guillou, M., Jahn, M., Erda, L., Mamo, T., Van Bo, N., Nobre, C.A., Scholes, R., Sharma, R., Wakhungu, J., (2011). Achieving Food Security in the Face of Climate Change: Summary for Policy Makers from the Commission on Sustainable Agriculture and Climate Change. CGIAR Research Program on Climate Change, Agriculture and Food Security (CCAFS), Copenhagen, Denmark.
37
Biennial Conference of the International Society for Ecological Economics (ISEE) December 15 - 19 2006, Delhi, India.
Bradley, P., T. Jackson, A. Druckman and E. Papathanasopoulou. (2007). Attributing Upstream (Process) Wastes to Household Consumption Activities - a case study for selected waste streams of the UK; 1995 and 2004. 11th European Roundtable on Sustainable Consumption and Production., Basel, Switzerland. 20-22 June 2007.
Bradley, P., Druckman, A., Jackson, T. and Thomas, C. (2009) Accounting for food waste: Comparative analysis within the UK. Proceedings of the ICE - Waste and Resource Management, 162 (1). pp. 5-13. ISSN 1747-6526
Bradley P, Jackson T, Druckman A (2010). Commercial Local Area Resource and Emissions Modelling (CLARE). ISEE Conference, 22-25 August 2010, Oldenburg and Bremen, Germany.
Bradley, P., Druckman, A. and Jackson, T. (2013) The development of commercial local area resource and emissions modelling – navigating towards new perspectives and applications. Journal of Cleaner Production, 42. pp. 241-253.
Bradley (2013). The Development Of Commercial Local Area Resource and Emissions Modelling. PhD. University of Surrey, Guildford, UK.
Bureau of Economic Analysis (2009). BEA BRIEFING: A Primer on BEA’s Industry Accounts. By Mary L. Streitwieser. Accessed: 21/05/2015 Available at: http://www.bea.gov/methodologies/index.htm#industry_meth
38
Department for Business Enterprise and Regulatory Reform (2008). Energy consumption in the United
Kingdom: Service sector data tables, 2008 update. United Kingdom. Publication URN: 08/456.
Accessed 01.03.09. Available at: http://www.berr.gov.uk/files/file47217.xls
Defra (2005). Greenhouse gas (GHG) conversion factors. July 2005. Accessed: in 2008/09. Available at: http://www.defra.gov.uk/environment/business/reporting/conversion-factors.htm
Environment Agency (2009). “Economic climate affects business investment in energy and water efficiency”. Accessed 10/01/2009. Available at: http://www.environment-agency.gov.uk/news/101332.aspx?coverage=National&persona=Business%2c+Event%2c+Hom e%2c+Prosecution%2c+Science§or=Agriculture%2c+Climate+change%2c+Construction% 2c+Consultations%2c+Drought%2c+Energy%2c+Fishing+and+aquaculture%2c+Flood%2c+Pol lution%2c+Regulation%2c+Reports%2c+Waste%2c+Water%2c+Wildlife+and+conservation&fr ompanel=1
Foran, B., M. Lenzen, C. Dey, M. Bilek (2005) “Integrating sustainable chain management with triple bottom line accounting”. Ecological Economics, 52, (2), pp.143-147.
Gadema Z., D. Oglethorpe (2011). The use and usefulness of carbon labelling food: A policy perspective from a survey of UK supermarket shoppers. Food Policy, 36, p. 815-822.
Garnett T (2011). Where are the best opportunities for reducing greenhouse gas emissions in the food system (including the food chain)? Food Policy, 36, pp. 23-32.
Garnett T (2008). Cooking up a storm. Food, greenhouse gas emissions and our changing climate. Food Climate Research Network, Centre for Environmental Strategy, University of Surrey.
Green Alliance (2010). A pathway to greener products Recommendations from Green Alliance’s Designing Out Waste consortium. Published by Green Alliance, London, UK.
Accessed: 15.07.11 Available at:
39
Guardian (2012). Tesco drops carbon-label pledge Available at:
http://www.theguardian.com/environment/2012/jan/30/tesco-drops-carbon-labelling Accessed: 04.02.2015
Hoekstra, A.Y. and Chapagain A.K (2007). “Water footprints of nations: Water use by people as a function of their consumption pattern”. Water resources management, Vol. 21 (1). pp. 35-48.
Jackson P., R. Perez del Aguila, I. Clark, A. Hallsworth, R. De Kervenoael and M. Kirkup (2006a). Retail restructuring and consumer choice 2. Understanding consumer choice at the household level. Environment and Planning A, 28, pp. 47-67.
Jackson, T., E. Papathanasopoulou, P. Bradley and A. Druckman (2006). Attributing Carbon Emissions to Functional Household Needs: a pilot framework for the UK. International Conference on Regional and Urban Modelling, Brussels. 1-2 June 2006.
King, K. and L. Tsagatakis (2006). Mapping small industrial emissions. Produced by AEA, UK
for Defra. Accessed 01/07/08. Available at
http://www.defra.gov.uk/environment/statistics/globatmos/download/regionalrpt/local-regionalco2-mappingsmallemissions.pdf
Lenzen M, Foran B, Dey C (2006). Triple-Bottom-Line Accounting of Economy and Environment. International Symposium for Interactive Analysis of Economy and Environment, held by the Japan Research Institute under the auspices of the Cabinet Office of the Government of Japan. Tokyo 4th March 2006.
Matthews, H. S. and Lave, L. (2003). "Using Input-Output Analysis for Corporate Benchmarking." Benchmarking: An International Journal 10 (2), 152-167.
40
Office for National Statistics (2005). Family Spending: A report on the 2003-04 Expenditure and Food Survey. Basingstoke, Hampshire, UK.
Office for National Statistics (2008). Virtual Microdata Laboratory. Accessed 24.07.08. Available from: http://www.ons.gov.uk/about/who-we-are/our-services/unpublished-data/business-data/vml
Proops, G.L.R., M. Faber and G. Wagenhals (1993). Reducing CO2 Emissions. Springer-Verlag, Berlin, Germany.
Rockström J., W. Steffen, K. Noone, Å. Persson, F. S. Chapin, E.F. Lambin, T. M. Lenton, M. Scheffer, C. Folke1, H.J. Schellnhuber, B. Nykvist, C.A. de Wit, T. Hughes, S. Van der Leeuw, H. Rodhe, S. Sörlin, P.K. Snyder, R. Costanza1, U. Svedin, M. Falkenmark1, L. Karlberg, R.W. Corell, V. J. Fabry, J. Hansen, B. Walker, D. Liverman, K. Richardson, P. Crutzen & J.A. Foley (2009). “A safe operating space for humanity”. Nature, Vol. 461, pp. 472-475.
Sustainable Consumption Roundtable (2006). I will if you will, towards sustainable consumption. A joint initiative by the Sustainable Development Commission and the New Economics Foundation. UK.
Sustainable Development Commission (2007). You are what you sell. London, UK. Accessed
in 22.01.08. Available at:
http://www.sd-commission.org.uk/file_download.php?target=/publications/downloads/roadmap_booklet_es%20 (2).pdf
Szyrmer, J.M., 1992. Inputeoutput coefficients and multipliers from a total flowperspective. Environment and Planning A, 24, (7), pp. 921-937.
41
production. Promoting climate-friendly household consumption patterns. Available at:
http://www.un.org/esa/sustdev/publications/household_consumption.pdf Accessed: 10/08/2015.
Vittersø and Tangeland (2014). The role of consumers in transitions towards sustainable food consumption. The case of organic food in Norway. Journal of Cleaner Production, 92, pp. 91– 99.
Vörösmarty G., Dobos I and T. Tátrai (2011). Motivations Behind Sustainable Purchasing, in Burritt R.L., Schaltegger S., Bennet M., Pohjola T. and Csutora M (Eds). Environmental Management Accounting and Supply Chain Management. Springer Science and Business Media B.V. 2011.
World Wildlife Fund (2008). UK Water Footprint: the impact of the UK’s food and fibre
consumption on global water resources. Available at:
http://www.google.co.uk/url?sa=t&rct=j&q=&esrc=s&source=web&cd=1&ved=0CCsQFjAA& url=http%3A%2F%2Fwww.waterfootprint.org%2FReports%2FOrr%2520and%2520Chapagain
%25202008%2520UK%2520waterfootprint-vol1.pdf&ei=1cC2U6P1AeqO7QaEqYDIDQ&usg=AFQjCNF2nrz6MG2OBEKNGSuFd1dPwZ SE8g&bvm=bv.70138588,d.bGQ Accessed: 04.07.2014
Wiedmann, T., Wood, R., Lenzen, M., Minx, J., Guan, D. and Barrett, J. (2008). Development of an Embedded Carbon Emissions Indicator - Producing a Time Series of Input-Output Tables and Embedded Carbon Dioxide Emissions for the UK by Using a MRIO Data Optimisation System. Final Report to the Department for Environment, Food and Rural Affairs by Stockholm Environment Institute at the University of York and Centre for Integrated Sustainability Analysis at the University of Sydney. Project Ref.: EV02033, July 2008. Defra, London, UK. http://randd.defra.gov.uk > Search for project no.