Using guided individualised feedback to review self-reported quality of life in health and its importance
Abstract
This pilot study investigated the effects of providing guided, individualised feedback
on subjective quality of life (QoL), using results from the multi-dimensional
WHOQOL-BREF profile.
Participants (n=129; 85 chronically ill) were recruited in the community, and primary
care. They were randomized to receive written or verbal guidance on interpreting a new
graphical summary profile, which simultaneously presented (a) their individual self-ratings of
QoL, and (b) the importance attributed to each QoL dimension. Before and after feedback,
participants completed health status, subjective QoL, QoL importance, goal-oriented QoL,
and mood measures.
Receiving individualised feedback was associated with increased psychological QoL,
with modest effect size. No effects were found for physical, social or environmental QoL or
QoL importance, health status, mood or goal-oriented QoL. There were no differences
between modes of delivering guidance, indicating equal effectiveness. Chronic illness
participants reported poorer QoL, moved more slowly towards their QoL goals, and had
larger differences between core QoL and QoL Importance than healthy participants.
Guided individualised empirical feedback about QoL judgements could be used to
promote psychological wellbeing. Although professional interpretation of feedback is
unnecessary, if shared, patients’ profiled WHOQOL information could support
self-monitoring, self-management, and clinical decision-making.
Introduction
In 2011, the UK Government launched a new mental health strategy: ‘No Health Without
Mental Health’ (Department of Health), reflecting increasing policy focus on the importance
of wellbeing. Recent healthcare models have also placed great emphasis on supporting active
participation in personal care. Consequently there has been rapid growth in using
patient-reported outcome measures (PROMs) in the NHS, like health-related quality of life (QoL)
(NHS England, 2013). While PROMs mostly serve to audit the outcomes of healthcare, they
can also assist health professionals by providing empirical evidence of intervention outcomes
on wellbeing, although these are rarely observed or formally assessed (Valderas et al., 2008).
At an individual level, PROMs have particular value in enabling patients and their
health professionals to jointly identify goals and priorities for future health and health care
(Marshall, Haywood, & Fitzpatrick, 2006), and the NHS Operating Framework states the
organisation should ‘...put patients at the centre of decision-making, with their experience of
health’ (Department of Health, 2011, p. 8). International QoL research has increasingly
focused on person-centred methods (Hahn, 2012; Iris, Debacker, Benner, Hammerman, &
Ridings, 2012; Skevington & McCrate, 2012), underscoring current shifts towards targeting
treatments in personalised healthcare. This approach requires new ways to investigate the
QoL of individuals, in contrast to epidemiological research.
Although person-centred studies have examined the effects of QoL assessment on
individual patient satisfaction (De Wit et al., 2008; Gutteling et al., 2008; Hilarius, Kloeg,
Gundy, & Aaronson, 2008; Mills, Murray, Johnston, Cardwell, & Donnelly, 2009;
Rosenbloom, Victorson, Hahn, Peterman, & Cella, 2007), few have specifically examined
whether patients’ QoL can improve as an consequence of completing a QoL measure and
receiving feedback about it. This represents an intervention in its own right, and evidence for
Rosenbloom et al., 2007; Santana et al., 2010), others provide limited evidence of positive
outcomes such as improved emotional wellbeing (Velikova et al., 2004), disease-specific
QoL and mental QoL (Gutteling et al., 2008), behavior, psychosocial health and family
activities (De Wit et al., 2008). Although indicating that QoL feedback is an important
mechanism whereby wellbeing can be influenced, the exact process remains unclear, as
feedback methods vary widely.
Recently, there has been renewed interest in measuring the importance that individuals
attach to different aspects of their QoL (Baile, Palmer, Bruera, & Parker, 2011; Snyder et al.,
2011), as distinct from importance to populations (da Rocha, 2011; Molzahn, Kalfoss,
Skevington, & Schick Makaroff, 2011; Molzahn, Skevington, Kalfoss, & Schick Makaroff,
2010; Skevington & O'Connell, 2004; Wu, 2009). Taking an unusual approach, Skevington
and O’Connell (2004) examined international data about QoL and its importance. They found that the poorest QoL could be identified where a particular dimension of QoL was rated not
only as poor (low scores), but also as very important (high scores) and that where there was a
large difference (gap) between the two ratings, high importance had a supplementary
disenhancing effect on poor QoL. They suggested that this knowledge could help patients and
professionals target areas of wellbeing for improvement.
The main aim of the present study was to pilot a new procedure to give graphical
feedback on both types of information, and investigate its effect on wellbeing. This is an
original investigation in feedback research. We predicted that self-generated empirical
information would promote self-awareness of current states, and movement towards future
personal QoL goals. Self-management interventions based on this premise affect wellbeing
positively during chronic illness (Ditewig, Blok, Havers, & van Veenendaal, 2010;
Labrecque et al., 2011) and the feasibility of technology -based symptom monitoring has
important to apply this pilot research in a chronic illness population, and healthy participants
were recruited for comparison purposes.
The investigation was grounded in Carver & Scheier’s self-regulation theory (SRT)
(Carver & Scheier, 1982, 1998) which asserts that the function of self-regulation is to reduce
sensed discrepancies between an individual’s judgement of their actual state and their desired
state. To do this, individuals use information from feedback to adapt to, or steer towards their
goal(s). Perceived progress, or lack of it, is theorised to have affective and behavioural
consequences. This is relevant to our study because achieving one’s goals is also theorised to
be an important source of information that people use to judge their QoL. The present study
is underpinned by the World Health Organization (WHO) definition of QoL: ‘An
individuals' perceptions of their position in life, in the context of the culture and value systems in which they live, and in relation to their goals, expectations, standards and concerns.’ (The WHOQOL Group, 1995, p. 1405). In view of the synergy between self-regulation mechanisms and QoL feedback, we sought to measure goal-related QoL.
Based on previous findings on the positive effects of QoL feedback (De Wit et al.,
2008; Velikova et al., 2004), we hypothesised that inspecting and interpreting individualised
QoL feedback after completing these measures would promote general wellbeing. In the
absence of suitable prior research, we could not predict whether chronic illness and healthy
participants would differ under these conditions, and if so how. However, we expected that
chronic illness participants would report poorer physical QoL than healthy (Dickson, Toft, &
O'Carroll, 2009; Kilian, Matschinger, & Angermeyer, 2001).
We investigated whether verbal guidance on how to interpret the QoL results delivered
at the time of feedback would be more strongly associated with improvements in wellbeing
than following written guidance from printed instructions. Patients are keen to discuss their
& Schornagel, 2000), but little comparative work with written feedback has been conclusive
so we had no predictions about modes of administering feedback. As prior research identifies
the poorest QoL (Skevington & O'Connell, 2004), we predicted that people with chronic
illness would have poorer QoL on some dimensions of the profile, and would rate these
aspects of QoL as more important than healthy participants, so resulting in greater differences
between core QoL and importance. Furthermore, this is the first study to use a new
short-form WHOQOL Importance measure compatible with facets of WHOQOL-BREF.
Methods Participants
A UK sample was purposively recruited in the local community and primary care. We
designed a pilot study for a feedback intervention where participants acted as their own
individual controls, and comparisons were made between chronic illness and well subgroups.
Ethical approval for the study was granted by the University of Bath Psychology Department
Research Ethics Committee, and the South West 5 NHS Research Ethics Committee. The
sample was designed to target 70% participants with a chronic illness, and 30% healthy, for
comparison. Pragmatically, it is important for health and social care services to know whether
this intervention is effective in limiting long-term conditions. The illness subgroup was
screened for length of diagnosis, to ensure their condition was chronic. They were included if
diagnosed with a chronic physical illness 12 or more months previously. Co-morbidities were
recorded and participants were asked which chronic condition most affected their QoL.
Advertisements inviting participation from healthy and chronically ill people were
installed on UK websites of the Multiple Sclerosis (MS) Society; Asthma UK; the National
Eczema Society; Epilepsy Action and the British Lung Foundation, and n=104 responded, of
which 87 (84%) participated. Supplementary recruitment of mostly healthy participants was
Recruitment was also conducted in an NHS Primary Care practice where 250 patients were
invited to participate by their General Practitioner. Quota sampling was used to achieve
equipoise in the sample design, across a range of chronic physical health conditions. Replies
were received from 70 (28%), and 61 (87%) participated.
Measures
Quality of Life and its Importance (The WHOQOL-BREF)
The WHOQOL-BREF is a multidimensional international instrument that assesses subjective
QoL over the past two weeks. It contains 26 items covering 25 QoL dimensions; 24 items are
scored in one of four domains: physical, psychological, social relationships and
environmental QoL. Two general items assess overall health and QoL. Item response is on a
five- point Likert interval scale. The WHOQOL-BREF shows good cross-cultural
psychometric properties, including in the UK(Skevington & McCrate, 2012). It is reliable,
valid and sensitive to changes in clinical condition (Skevington, Lotfy, & O'Connell, 2004).
It is widely used in clinical trials, for monitoring interventions, and in various service
settings. Its patient-centred design and psychometric properties make it suited to individual
assessment (Diehr et al., 2006; O'Carroll, Smith, Couston, Cossar, & Hayes, 2000; Saxena,
Carlson, Billington, & Orley, 2001; Skevington et al., 2004; Skevington & McCrate, 2012;
Skevington & O'Connell, 2004; The WHOQOL Group, 1998).
Importance items corresponding to topics of QoL facets in the core measure were
developed concurrently with the WHOQOL-100 (Saxena et al., 2001); these two measures
have very weak correlations in very large datasets (Skevington & O'Connell, 2004). The
Importance measure shows good internal consistency reliability, stability, and has been tested
for some aspects of validity (Molzahn et al., 2011; Molzahn et al., 2010; Skevington &
O'Connell, 2004; Wu, 2009). We used a short form of the WHOQOL-100 Importance scale
was selected to match one of the 26 topics in the WHOQOL-BREF.
In the present study, scores from the BREF and the short
WHOQOL-Importance measure were used to produce individualised graphical summary profiles (See
Figure 1). These profiled results displayed the participant’s core QoL responses in bar charts,
overlaid with indicators of their importance ratings (red triangles) for every QoL facet. This
graphical profile was based on an early version of a CD-ROM based system, developed at
[X], and used by patients and physicians to inspect the results in a previous pilot study.
[INSERT FIGURE 1 HERE]
Health Status (EQ-5D)
Health status overall was measured using the visual analogue scale of the EQ-5D (The
EuroQoL Group, 2010) (0 = worst imaginable health; 100 = best imaginable health). The
National Institute for Clinical Excellence (NICE) recommends the EQ-5D as the preferred
UK measure of health-related QoL in adults (National Institute for Health and Clinical
Excellence, 2008), and its validity in assessing chronic illnesses is confirmed (Dyer,
Goldsmith, Sharples, & Buxton, 2010; Janssen, Lubetkin, Sekhobo, & Pickard, 2011; Pickard
et al., 2008).
Mood (PANAS)
The Positive and Negative Affect Schedule (PANAS) (Watson, Clark, & Tellegen, 1988) was
selected to measure positive and negative affect independently. This instrument contains two
internally consistent 10-item mood scales that are largely uncorrelated and stable (Watson et
al., 1988). Items are rated from 1 to 5, and scores summed for each affect type (range 10-50).
The PANAS shows good psychometric properties in general, clinical and non-clinical UK
populations (Crawford & Henry, 2004; Ostir, Smith, Smith, & Ottenbacher, 2005).
Goal-Oriented Quality of Life (GOSS)
perceptions of how quickly people believe they are moving towards, or away from five
specific goals relating to: family/relationships, health, work/finances, social life/activities,
spirituality and beliefs. The GOSS has good internal consistency (alpha ≥ 0.8) andis
meaningfully related to the ‘change in health’ item of another health status measure - the
SF-36 (Jenkinson, Wright, & Coulter, 1993). For this study, the wording of the GOSS was
adapted so as to map it conceptually onto the six QoL domains of the WHOQOL-100 (The
WHOQOL Group, 1995): physical health, psychological, social relationships, environment,
independence and spiritual QoL. Each of the six items in this revised measure (the GOSS-Q)
asks about perceived movement ‘today’ in relation to ideal QoL (1 = “moving very quickly
away”; 7 = “moving very quickly towards” (range from 7 – 42). The adapted measure has
good internal consistency reliability (alpha ≥ 0.8) (Llewellyn & Skevington, 2014).
Procedure
Having given fully informed consent, participants completed all baseline (T1) measures at
home, online or on paper, and returned their questionnaires to the primary researcher (AL).
Participants were stratified by health status (illness or health), then randomly allocated to one
of two conditions - verbal or written guidance - using independent computer generated
randomization (www.randomizer.org). Individualised graphical summary profiles from the
WHOQOL-BREF and the short WHOQOL-Importance measures were printed, in colour, to
provide the mechanism for subsequent feedback according to experimental condition.
In the verbal guidance condition, feedback session appointments were made by
telephone and individual graphical summary profiles were sent by post or email to the
participants in time for these appointments (within 1-3 weeks of baseline measurement,
depending on participants’ availability). During the appointment, participants reviewed and
interpreted their graphical summary profile while receiving guidance on how to understand
guidance condition, the graphical summary profile was sent to participants within one week
of baseline measurement, together with printed instructions providing directions about how to
review and interpret the profile by following a series of steps. The design of the graphical
summary profile was identical in both conditions and instruction protocols were matched in
terms of the steps participants should follow when reviewing and interpreting their graphs.
Any interaction with participants concerning their scores was restricted to factual and
descriptive comments; the researcher was careful not to imputemeanings.The methodology
of the two conditions had been piloted and tested previously for feasibility and acceptability
(Llewellyn, 2012).
In both feedback conditions, participants were first directed to look at all of his/her
QoL core scores, and to identify the facets where QoL was rated as good (>3.0). Then they
examined Importance scores to find any large differences between Importance and core QoL.
In particular they focused on facets where scores indicated poor QoL (<3.0) and where that
facet was also considered to be very or extremely important (>3), implementing procedures
based on Skevington and O’Connell’s (2004) findings. It was pointed out to participants that
these were the areas where they might want to consider what they could do to make the gap
smaller. For ethical reasons, the final instruction was for them to attend to facets where they
had rated both QoL and Importance as high, and so were positive.
Participants were asked to complete the time 2 (T2) measures immediately after
reviewing the graphical summary profile, but without referring back to it. We thereby
intended that the T2 measures would capture their new post-feedback self-judgements, not
ones they might have derived through systematic comparisons with previous answers.
Data analysis
The WHOQOL-BREF scores were transformed so that the four domains (physical health,
WHOQOL Group SPSS syntax file (obtainable from:
http://apps.who.int/iris/bitstream/10665/77932/1/WHO_HIS_HSI_Rev.2012.03_eng.pdf). A
new syntax was written by the authors to similarly transform the WHOQOL Importance
scores into Importance domains. SPSS v18 was used for statistical analysis. Normality testing
showed that skewness and kurtosis were acceptable for most variables. Negative Affect
scores (PANAS) were reciprocally transformed (Hair, Anderson, Tatham, & Blacke, 1999).
Factorial repeated measures MANOVA was used to examine differences over time, by
health status (ill or healthy), and by experimental condition (verbal or written guidance). In
the first analysis we included five dependent variables (DVs): each of the four
WHOQOL-BREF core domains and the EQ-5D VAS rating. All were acceptably correlated. MANOVA
was applied to the WHOQOL Importance domain scores, which were poorly correlated with
the WHOQOL-BREF. Mixed-factorial ANOVAs examined differences over time and
between groups for the other DVs: GOSS-Q and PANAS. Bonferroni corrections and
Greenhouse-Geisser adjustments factors were applied (Dancey & Reidy, 2004). Effect size
was calculated using Cohen’s guidelines for interpreting F (Cohen, 1988), with equivalent values of partial eta squared , as generated by SPSS (Kinnear & Gray, 2010). We investigated
the differences between core QoL and Importance scores for each health status group at each
time point, using dependent t-tests, with Bonferroni corrections. Significance was set at p = 0.013 to correct for multiple testing.
Results
Baseline questionnaires (T1) were completed by 165 participants, 129 of whom also
completed T2. Seventy-four % of those with chronic illness completed both sets of
questionnaires, compared to 87% of healthy people, suggesting physical health may have
been a factor in attrition. Of those completing questionnaires twice, 66%were women; 35%
(25%) and women (20%), and varied little by age band. After randomization, 71 participants
(55%) received verbal guidance, of whom 65% reported a chronic illness; and 58 (45%)
received written guidance (67% ill).
Most participants (64%) had received tertiary education (college, university or
postgraduate), were White (96%), and lived with a spouse, partner or family (76%). Most
resided in sub/urban areas (69%) and 28% were retired, 34% were employed full-time, and
12% part-time. The chronic illness group (n = 85) was a heterogeneous sample of people reporting chronic illnesses (defined by the International Classification of Diseases (World
Health Organization, 2010)). These included musculoskeletal and connective tissue (21%);
respiratory system (19%); nervous system (19%); circulation (13%); dermatology (11%); and
endocrine, nutrition and metabolic conditions (8%); others 9%.
Outcome Changes between Pre-test (T1) and Post-test (T2)
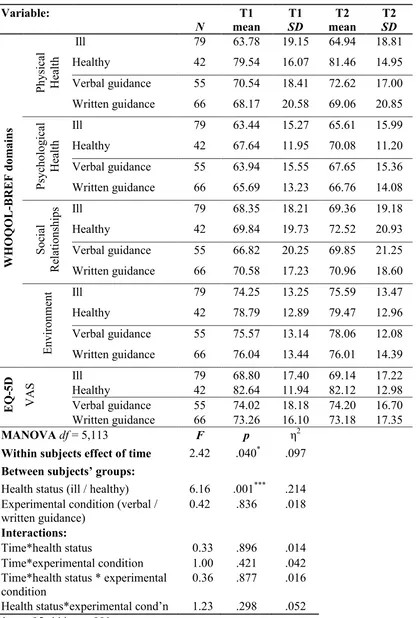
The MANOVA analysis of the WHOQOL-BREF and EQ-5D VAS showed a significant
main effect, with scores increasing over time (p <.05, η2 = .10) (see Table 1). Examination of contrasts revealed that although mean scores were mostly higher at T2, only the
WHOQOL-BREF psychological domain was significant (p <.01, η2 = .06), indicating that the main effect was associated with change in this domain. These findings support our hypothesis that being
guided through individualised QoL feedback would bring about improvements in wellbeing.
The EQ-5D VAS and WHOQOL-BREF domain scores distinguished between ill and
healthy groups (p <.001, η2 = .21), showing a large effect size. As expected, participants reporting chronic illness rated their physical health as poorer on both measures than healthy
people (EQ-5D VAS: p <.001, η2 = .17, WHOQOL-BREF physical domain: p <.001, η2 = .16). No significant differences were found between verbal and written guidance groups on
any variable. Furthermore there were no significant interactions between time, health status
[INSERT TABLE 1 HERE]
The PANAS subscales showed no significant differences between T1 and T2 and
effects of health status or experimental condition, or any significant interactions. Therefore
our findings did not support earlier predictions of improvement in affect. GOSS-Q scores did
not change significantly over time, however there was a significant between-subjects effect in
health status, with medium effect size (F (1,125) = 15.16, p <.001, η2 = .11). Goal-oriented QoL scores were significantly lower for the ill group than for healthy participants. Although
the overall means indicated that both groups were moving towards, rather than away from
their ideal QoL, higher scores for healthy participants indicated more rapid movement in this
positive direction. There were no significant interactions between time, health status and
experimental condition.
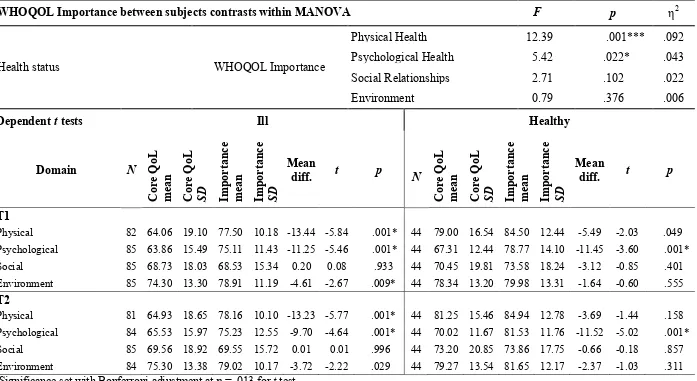
MANOVA showed that WHOQOL Importance domain scores did not change
significantly over time. However, contrary to our hypothesis, healthy participants rated the
importance of QoL more highly than ill participants (p <.01, η2 = 0.11). Contrasts revealed that this between-groups difference was related to WHOQOL Importance scores in both the
physical and psychological domains (df = 1,122, Importance physical: p <.001, η2 = .09; Importance psychological: p <.05, η2 = .04)(See Table 2).
[INSERT TABLE 2 HERE]
Differences between Quality of Life and the Importance of Quality of Life
A number of significant differences were found between WHOQOL core domain
scores and respective Importance ratings of ill participants at T1 and T2. Table 2 shows that
core physical and psychological QoL scores were rated lower than Importance (p <.001) on both occasions. This effect was found for the environment domain at T1 (p <.01), but not for the social domain. Healthy group means showed a similar pattern, but only psychological
prediction of greater differences between core QoL and Importance for those with poorer
QoL living with chronic illness.
Discussion
The aim of this study was to explore whether a novel approach to receiving feedback on
subjective judgements would lead to changes in how people consider their QoL, their
orientation towards their QoL goals, and their mood. Within this design, we also examined
whether the method by which feedback was administered had different effects. Our findings
confirm that receiving feedback on subjective QoL and importance judgements was be
positive for the psychological domain, suggesting improved mental health although the size
of this effect was modest. This result supports the prediction that sharing QoL results with
individuals who have provided the information leads to improved self-judgements. It shows
the advantages of a highly patient-centred process, in line with current NHS health care
policy. Furthermore these findings demonstrate that the WHQOL-BREF scores are sensitive
in detecting change in a community sample. This information has not been widely available.
There was no significant change in the three other WHOQOL-BREF domains or
health status on the EQ-5DVAS. These results are consistent with reports by Velikova et al.
(2004) and Del Wit et al. (2008) who showed that that emotional wellbeing and mental health
improved after QoL feedback but physical QoL showed no change. It therefore seems
plausible that physical health indicators like pain, medication, energy, sleep, work, mobility,
and daily activities, are more receptive to physical or pharmacological interventions, than to
increased self-awareness via a psychological feedback intervention. They may also possibly
have greater intrinsic strength than emotional wellbeing, so are more resistant to change.
Similarly, no intervention effects were found on core variables of social or environment QoL
domains, or on QoL Importance variables, indicating that feedback alone is insufficient to
other psychological interventions that would benefit from structured regulation and
self-monitoring could promote mutually enhancing effects. Secondary components relating to
behaviour change, such as goal setting, or motivational interviewing, could be usefully
developed and applied alongside QoL feedback.
While we had predicted post-feedback changes in mood and goal-related QoL, these
were not detected. However, this is consistent with previous studies investigating the effects
of QoL assessments with outcome measures other than the WHOQOL-BREF, for example
the Functional Assessment of Cancer Therapy (FACT), Palliative Care Quality of Life Index
(PQLI) and the Functional Living Index (FLIC) (Hilarius et al., 2008; Mills et al., 2009;
Rosenbloom et al., 2007). In the present study it is possible that there were changes but these
were not detected by the measures we used. Whether this is due to subtle differences in
concepts investigated, or measurement construction is worthy of further investigation.
Furthermore, most measures were designed for cross sectional rather than longitudinal
research, and for group rather than individual use. It is also plausible that not using
disease-specific measures may have made a difference to our ill sample, as these are generally found
to be more responsive to change (Santana et al., 2010), but this would neither have been
practicable, nor enabled us to test the generic principle of the impact of QoL feedback.
The present study examined whether providing written or verbal guidance would
differentially impact on QoL feedback. We found that both feedback modes worked equally
well. As neither showed a superior effect on wellbeing, this has implications for the future
implementation of QoL feedback interventions. As a self-management tool, providing written
instructions to assist feedback review would be less costly than time spent by a health
professional or facilitator providing verbal guidance. The consistency of the same script
would improve the reliability of the intervention. It would also allow individuals to review
We confirmed an overall QoL difference between those with chronic illness and
healthy, but found no difference in psychological QoL. This finding contrasts with previous
studies where both physical and psychological QoL of those with chronic illness was poorer
than healthy individuals (Dickson et al., 2009; Ovayolu, Ovayolu, & Karadag, 2011; Salaffi,
Carotti, Gasparini, Intorcia, & Grassi, 2009; Slatkowsky-Christensen, Mowinckel, Loge, &
Kvien, 2007). However, the ill sample in the present study comprised a wide variety of
health conditions. Arnold et al. (2004) found that although patients with back problems,
rheumatoid arthritis and heart problems reported poorer physical QoL than healthy, patients
with lung disorders and migraine differed in psychological functioning. Illness type therefore
adds complexity to these group differences in different domains. Future studies comparing
QoL in different chronic illness types may enhance our current understanding.
We found participants reported overall movement towards their ideal QoL. However,
this movement was perceived to be faster for healthy people, so it is plausible that those with
chronic illness may see positive change as more difficult than healthy, or that they invest
their energy in coping with the ramifications of their illness, rather than making plans to
achieve their QoL goals. This mechanism is in keeping with Schwartz and Drotar’s (2009)
study where health status was found to affect the pursuit of personal goals during chronic
illness in young adults. The present study also showed that physical and psychological QoL
were more important for those who were healthy than ill, possibly indicating that chronic
illness accompanies lower expectations of QoL in these domains. Although tentative, this
interpretation could be fruitfully investigated further.
The results also revealed that the differences between core QoL and Importance scores
were larger for those with a chronic illness and were more prevalent across domains. This
indicates that those living with chronic illness are more often distant from the QoL goals that
showed, those with chronic illness are also slower in moving towards their QoL goals than
the healthy group. Theoretically this is in keeping with the WHOQOL Group’s definition of
QoL which indicates that those with the poorest QoL are least likely to meet their ‘...goals,
expectations, standards and concerns’ (Skevington & O'Connell, 2004) and has important
implications for clinical practice, where health professionals may need to revise their
expectations of what someone with chronic illness can do.
A limitation of the study was the absence of a control group against which to compare
those receiving QoL feedback. Including a condition where participants completed
questionnaires twice, but did not receive feedback, would have strengthened the study rigor.
Similarly, convenience sampling meant we were unable to purposefully match the
demographic profiles of the ill and healthy groups in this pilot study and future research with
a larger sample would provide a more conclusive understanding. It is also possible that the
relatively short duration of the assessment period may have attenuated the potential feedback
effect. Allowing longer for feedback to be cognitively and affectively processed may have
had greater effect. To our knowledge there is no test of an optimum period for consideration
of feedback, and further research would be valuable.
The present study used two different modes of data collection: completing the
questionnaires online or using paper and pencil. Paper versions have been employed in the
majority of prior studies involving the WHOQOL-BREF, although recently computer-based
formats have been reported (Baumann, Ionescu, & Chau, 2011; Fellinger et al., 2005; Mason,
Skevington, & Osborn, 2004; Skevington & Day, unpublished). Arguably, having two data
collection formats in this study may have introduced an additional variable, however, Chen et
al. (2009) found no significant differences between domain scores collected either
electronically or using paper and pencil. Paper and touch-screen versions of the EQ-5D VAS
results suggest that administration mode does not make an important difference to the way
people report their subjective QoL using questionnaires.
At a qualitative level, several participants commented that thinking about QoL was a
novel experience. French and Sutton (2011) found that when people were asked to complete
questions about issues they had not previously considered, they can provide responses that
are generated on the spot, on the basis of normative understandings, rather than on genuine
personal reflections. We have no additional information about whether this process was
active in our study, but this interpretation has implications for the validity of PROMs
measures in general, and for QoL assessment in particular, especially where QoL issues are
novel to participants. However, in the present study, all our participants consented in advance
to think about their QoL, and therefore had a pretest period to reflect on their QoL before
assessment. Providing additional comprehensive information about wellbeing dimensions
before recruitment may have made the task less novel but could have conversely served to
shape the answers. It is also plausible that self-selection recruitment bias meant those who
opted to participate already had an interest in QoL, and may have been considerably
self-aware before reviewing their feedback. As such their self-assessments would have been less
likely to change after feedback. Similar conclusions have been reached in behaviour change
studies, where the effects of planning interventions have been attenuated by the prior plans
that participants had already made before taking part in the research (Sniehotta, 2009).
Although we collected data from healthy individuals and a heterogeneous chronic
illness sample, small sample sizes precluded analysis of subgroups by illness type. Future
studies should investigate the effects of feedback for individuals with different types of
chronic illnessess who could be differentially affected by pain, disability, mobility and
specific symptoms (Arnold et al., 2004).
with changes in the way people consider their subjective QoL, and in particular with
significant, but small, improvements in psychological wellbeing. This could be an important
precursor in making behavioural changes to further improve wellbeing, and ensure longevity
of effect. Previous findings suggest that without additional behavioural efforts, these
beneficial psychological effects diminish over time (De Wit et al., 2010). However, it may be
that psychological QoL change is the necessary foundation upon which changes in physical,
social and environmental QoL could subsequently be built. Future studies over longer
timescales will be helpful in testing this proposition.
The authors are very grateful to Dr Sanjeev Popli and Mrs Tracy Harris at [xxxxx] Primary
Care Trust; the Multiple Sclerosis (MS) Society; Asthma UK; the National Eczema Society;
Epilepsy Action, and the British Lung Foundation for publicising this study.
References
Arnold, R., Ranchor, A. V., Sanderman, R., Kempen, G. I. J. M., Ormel, J., & Suurmeijer, T.
P. B. M. (2004). The relative contribution of domains of quality of life to overall
quality of life for different chronic diseases. Quality of Life Research, 13(5), 883-896. Baile, W. F., Palmer, J. L., Bruera, E., & Parker, P. A. (2011). Assessment of palliative care
cancer patients' most important concerns. Supportive Care in Cancer, 19(4), 475-481. Baumann, M., Ionescu, I., & Chau, N. (2011). Psychological quality of life and its association
with academic employability skills among newly-registered students from three
European faculties. Bmc Psychiatry, 11(63).
Carver, C. S., & Scheier, M. F. (1982). Control theory - a useful conceptual framework for
Carver, C. S., & Scheier, M. F. (1998). On the self-regulation of behaviour. Cambridge, UK: Cambridge University Press.
Chen, W. C., Wang, J. D., Hwang, J. S., Chen, C. C., Wu, C. H., & Yao, G. (2009). Can the
web-form WHOQOL-BREF be an alternative to the paper-form? Social Indicators Research, 94(1), 97-114.
Cohen, J. (1988). Statistical power analysis for the behavioural sciences (2nd ed.). Mahwah, New Jersey, USA: Lawrence Erlbaum Associates.
Crawford, J. R., & Henry, J. D. (2004). The positive and negative affect schedule (PANAS):
Construct validity, measurement properties and normative data in a large non-clinical
sample. British Journal of Clinical Psychology, 43, 245-265. da Rocha, N. (2011). Evaluation of quality of life and importance given to
spirituality/religiousness/personal beliefs (SRPB) in adults with and without chronic
health conditions. Revista de psiquiatria clínica, 38(1), 19-23.
Dancey, C. P., & Reidy, J. (2004). Statistics without maths for psychology: using SPSS for Windows (3 ed.). Harlow, UK: Prentice Hall.
De Wit, M., De Waal, H., Bokma, J. A., Haasnoot, K., Houdijk, M. C., Gemke, R. J., &
Snoek, F. J. (2008). Monitoring and discussing health-related quality of life in
adolescents with type 1 diabetes improve psychosocial well-being - A randomized
controlled trial. Diabetes Care, 31(8), 1521-1526.
De Wit, M., De Waal, H., Bokma, J. A., Haasnoot, K., Houdijk, M. C., Gemke, R. J., &
Snoek, F. J. (2010). Follow-up results on monitoring and discussing health-related
quality of life in adolescent diabetes care: benefits do not sustain in routine practice.
Pediatric Diabetes, 11(3), 175-181.
Department of Health. No health without mental health: a cross-government mental health
http://www.dh.gov.uk/en/Publicationsandstatistics/Publications/PublicationsPolicyAn
dGuidance/DH_123766
Department of Health. (2011). The Operating Framework for the NHS in England 2012/2013.
Retrieved 4th January, 2013, from
https://http://www.gov.uk/government/uploads/system/uploads/attachment_data/file/2
16590/dh_131428.pdf
Detmar, S. B., Aaronson, N. K., Wever, L. D. V., Muller, M., & Schornagel, J. H. (2000).
How are you feeling? Who wants to know? Patients' and oncologists' preferences for
discussing health-related quality-of-life issues. Journal of Clinical Oncology, 18(18), 3295-3301.
Dibb, B., & Yardley, L. (2006). How does social comparison within a self-help group
influence adjustment to chronic illness? A longitudinal study. Social Science & Medicine, 63(6), 1602-1613.
Dickson, A., Toft, A., & O'Carroll, R. E. (2009). Neuropsychological functioning, illness
perception, mood and quality of life in chronic fatigue syndrome, autoimmune thyroid
disease and healthy participants. Psychological medicine, 39(9), 1567-1576. Diehr, P., Derleth, A., McKenna, S., Martin, M., Bushnell, D., Simon, G., & Patrick, D.
(2006). Synchrony of change in depressive symptoms, health status, and quality of
life in persons with clinical depression. Health and Quality of Life Outcomes, 4(27). Ditewig, J. B., Blok, H., Havers, J., & van Veenendaal, H. (2010). Effectiveness of
self-management interventions on mortality, hospital readmissions, chronic heart failure
hospitalization rate and quality of life in patients with chronic heart failure: A
Dyer, M. T., Goldsmith, K. A., Sharples, L. S., & Buxton, M. J. (2010). A review of health
utilities using the EQ-5D in studies of cardiovascular disease. Health Qual Life Outcomes, 8(13), 1-12.
Fellinger, J., Holzinger, D., Dobner, U., Gerich, J., Lehner, R., Lenz, G., & Goldberg, D.
(2005). An innovative and reliable way of measuring health-related quality of life and
mental distress in the deaf community. Social Psychiatry and Psychiatric Epidemiology, 40(3), 245-250.
French, D. P., & Sutton, S. (2011). Does measuring people change them? The Psychologist, 24(4), 272-274.
Gutteling, J. J., Darlington, A.-S. E., Janssen, H. L. A., Duivenvoorden, H. J., Busschbach, J.
J. V., & Man, R. A. (2008). Effectiveness of health-related quality-of-life
measurement in clinical practice: a prospective, randomized controlled trial in patients
with chronic liver disease and their physicians. Quality of Life Research, 17, 195-205. Hahn, J. E. (2012). Minimizing Health Risks Among Older Adults With Intellectual and/or
Developmental Disabilities: Clinical Considerations to Promote Quality of Life.
Journal of gerontological nursing, 38(6), 11-17.
Hair, J. F., Anderson, R. E., Tatham, R. L., & Blacke, W. C. (1999). Multivariate Data Analysis (5th ed.). Englewood Cliffs, N.J.: Prentice-Hall.
Hilarius, D. L., Kloeg, P. H., Gundy, C. M., & Aaronson, N. K. (2008). Use of health-related
quality-of-life assessments in daily clinical oncology nursing practice. Cancer, 113(3), 628-637.
Iris, M., Debacker, N. A., Benner, R., Hammerman, J., & Ridings, J. (2012). Creating a
Janssen, M. F., Lubetkin, E. I., Sekhobo, J. P., & Pickard, A. S. (2011). The use of the
EQ-5D preference-based health status measure in adults with Type 2 diabetes mellitus.
Diabetic Medicine, 28(4), 395-413.
Jenkinson, C., Wright, L., & Coulter, A. (1993). Quality of life measurement in health care: a
review of measures and population norms for the UK SF-36. Oxford, UK: Health
Service Research Unit.
Kilian, R., Matschinger, H., & Angermeyer, M. C. (2001). The impact of chronic illness on
subjective quality of life: a comparison between general population and hospital
inpatients with somatic and psychiatric diseases. Clinical psychology & psychotherapy, 8(3), 206-213.
Kinnear, P., R., & Gray, C., D. (2010). IBM SPSS Statistics 18 Made Simple. New York: Psychology Press.
Labrecque, M., Rabhi, K., Laurin, C., Favreau, H., Moullec, G., Favreau, H., . . . Julien, M.
(2011). Can a self-management education program for patients with chronic
obstructive pulmonary disease improve quality of life? Canadian Respiratory Journal, 18(5), e77-81.
Llewellyn, A. (2012). Understanding Quality of Life: Investigating the effects of individualised feedback on wellbeing. (PhD), University of Bath, Bath, UK.
Llewellyn, A., & Skevington, S. M. (2014). The psychometric properties of measures used in
interpreting quality of life: the WHOQOL-BREF, WHOQOL Importance and the
GOSS-Q. Unpublished manuscript.
Marshall, S., Haywood, K. L., & Fitzpatrick, R. (2006). Impact of patient-reported outcome
Mason, V. L., Skevington, S. M., & Osborn, M. (2004). Development of a pain and
discomfort module for use with the WHOQOL-100. Quality of Life Research, 13(6), 1139-1152.
Mills, M. E., Murray, L. J., Johnston, B. T., Cardwell, C., & Donnelly, M. (2009). Does a
patient-held quality-of-life diary benefit patients with inoperable lung cancer? Journal of Clinical Oncology, 27(1), 70-77.
Molzahn, A., Kalfoss, M., Skevington, S. M., & Schick Makaroff, K. (2011). Comparing the
importance of different aspects of quality of life to older adults across diverse
cultures. Age and Ageing, 40(2), 192-199.
Molzahn, A., Skevington, S. M., Kalfoss, M., & Schick Makaroff, K. (2010). The importance
of facets of quality of life to older adults: an international investigation. Quality of Life Research, 19(2), 293-298.
National Institute for Health and Clinical Excellence. (2008). Guide to the methods of
technology appraisal. London: NICE.
NHS England. (2013). Everyone counts: Planning for Patients 2013/2014. Retrieved 29th
October, 2013, from http://www.england.nhs.uk/everyonecounts/
O'Carroll, R. E., Smith, K., Couston, M., Cossar, J. A., & Hayes, P. C. (2000). A Comparison
of the WHOQOL-100 and the WHOQOL-BREF in detecting change in quality of life
following liver transplantation. Quality of Life Research, 9(1), 121-124.
Ostir, G. V., Smith, P. M., Smith, D., & Ottenbacher, K. J. (2005). Reliability of the Positive
and Negative Affect Schedule (PANAS) in medical rehabilitation. Clinical Rehabilitation, 19(7), 767-769.
Ovayolu, N., Ovayolu, O., & Karadag, G. (2011). Health-related quality of life in ankylosing
spondylitis, fibromyalgia syndrome, and rheumatoid arthritis: a comparison with a
Pickard, S. A., Wilke, C., Jung, E., Patel, S., Stavem, K., & Lee, T. A. (2008). Use of a
preference-based measure of health (EQ-5D) in COPD and asthma. Respiratory medicine, 102(4), 519-536.
Ramachandran, S., Lundy, J. J., & Coons, S. J. (2008). Testing the measurement equivalence
of paper and touch-screen versions of the EQ-5D visual analog scale (EQ VAS).
Quality of Life Research, 17(8), 1117-1120.
Rosenbloom, S. K., Victorson, D. E., Hahn, E. A., Peterman, A. H., & Cella, D. (2007).
Assessment is not enough: A randomized controlled trial of the effects of HRQL
assessment on quality of life and satisfaction in oncology clinical practice. Psycho-Oncology, 16(12), 1069-1079.
Salaffi, F., Carotti, M., Gasparini, S., Intorcia, M., & Grassi, W. (2009). The health-related
quality of life in rheumatoid arthritis, ankylosing spondylitis, and psoriatic arthritis: a
comparison with a selected sample of healthy people. Health and Quality of Life Outcomes, 7.
Santana, M. J., Feeny, D., Johnson, J. A., McAlister, F. A., Kim, D., Weinkauf, J., & Lien, D.
C. (2010). Assessing the use of health-related quality of life measures in the routine
clinical care of lung-transplant patients. Quality of Life Research, 19(3), 371-379. Saxena, S., Carlson, D., Billington, R., & Orley, J. (2001). The WHO Quality of Life
Assessment Instrument (WHOQOL-Bref): The importance of its items for
cross-cultural research. Quality of Life Research, 10(8), 711-721.
Schwartz, L. A., & Drotar, D. (2009). Health-Related Hindrance of Personal Goal Pursuit and
Well-Being of Young Adults with Cystic Fibrosis, Pediatric Cancer Survivors, and
Skevington, S. M., & Day, R. (2001).Developing a CD-ROM of the WHOQOL-BREF for
use in primary care. Unpublished manuscript.
Skevington, S. M., Lotfy, M., & O'Connell, K. A. (2004). The World Health Organization's
WHOQOL-BREF quality of life assessment: Psychometric properties and results of
the international field trial. A Report from the WHOQOL Group. Quality of Life Research, 13(2), 299-310.
Skevington, S. M., & McCrate, F. M. (2012). Expecting a good quality of life in health:
assessing people with diverse diseases and conditions using the WHOQOL-BREF.
Health Expectations, 15(1), 49-62.
Skevington, S. M., & O'Connell, K. A. (2004). Can we identify the poorest quality of life?
Assessing the importance of quality of life using the WHOQOL-100. Quality of Life Research, 13(1), 23-34.
Slatkowsky-Christensen, B., Mowinckel, P., Loge, J. H., & Kvien, T. K. (2007).
Health-related quality of life in women with symptomatic hand osteoarthritis: A comparison
with rheumatoid arthritis patients, healthy controls, and normative data. Arthritis & Rheumatism, 57(8), 1404-1409.
Sniehotta, F. F. (2009). Towards a theory of intentional behaviour change: Plans, planning,
and self-regulation. British Journal of Health Psychology, 14, 261-273.
Snyder, C. F., Blackford, A. L., Aaronson, N. K., Detmar, S. B., Carducci, M. A., Brundage,
M. D., & Wu, A. W. (2011). Can patient-reported outcome measures identify cancer
patients' most bothersome issues? Journal of Clinical Oncology, 29(9), 1216-1220. The EuroQoL Group. (2010). EQ-5D-5L. Retrieved 1st June, 2010, from
The WHOQOL Group. (1995). The World Health Organization Quality Of Life Assessment
(WHOQOL): Position paper from the World Health Organization. Social Science and Medicine, 41(10), 1403-1409.
The WHOQOL Group. (1998). Development of the World Health Organization
WHOQOL-BREF Quality of Life Assessment. Psychological medicine, 28(3), 551-558.
Valderas, J. M., Kotzeva, A., Espallargues, M., Guyatt, G., Ferrans, C. E., Halyard, M. Y., . .
. Alonso, J. (2008). The impact of measuring patient-reported outcomes in clinical
practice: A systematic review of the literature. Quality of Life Research, 17(2), 179-193.
Velikova, G., Booth, L., Smith, A. B., Brown, P. M., Lynch, P., Brown, J. M., & Selby, P. J.
(2004). Measuring quality of life in routine oncology practice improves
communication and patient well-being: a randomized controlled trial. Journal of Clinical Oncology, 22(4), 714-724.
Watson, D., Clark, L. A., & Tellegen, A. (1988). Development and validation of brief
measures of positive and negative affect: The PANAS scales. Journal of Personality and Social Psychology, 54(6), 1063-1070.
World Health Organization. (2010). ICD-10. 2nd. Retrieved 5th February, 2010, from
http://www.who.int/classifications/icd/en/
Wu, C. (2009). Enhancing quality of life by shifting importance perception among life
domains. Journal of happiness studies, 10(1), 37-47.
Yount, S. E., Rothrock, N., Bass, M., Beaumont, J. L., Pach, D., Lad, T., . . . Del Ciello, K.
(2013). A Randomized Trial of Weekly Symptom Telemonitoring in Advanced Lung
Table 1 Changes in QoL and comparison of administrative mode and health status groups (WHOQOL-BREF Domains and EQ-5D VAS MANOVA).
Variable: N T1 mean T1 SD T2 mean T2 SD WHO QO L -B REF d om ain s P hysi ca l He alt h
Ill 79 63.78 19.15 64.94 18.81
Healthy 42 79.54 16.07 81.46 14.95
Verbal guidance 55 70.54 18.41 72.62 17.00 Written guidance 66 68.17 20.58 69.06 20.85
P sycho logi ca l He alt h
Ill 79 63.44 15.27 65.61 15.99
Healthy 42 67.64 11.95 70.08 11.20
Verbal guidance 55 63.94 15.55 67.65 15.36 Written guidance 66 65.69 13.23 66.76 14.08
S oc ial R elations hips
Ill 79 68.35 18.21 69.36 19.18
Healthy 42 69.84 19.73 72.52 20.93
Verbal guidance 55 66.82 20.25 69.85 21.25 Written guidance 66 70.58 17.23 70.96 18.60
Environme
nt Ill 79 74.25 13.25 75.59 13.47
Healthy 42 78.79 12.89 79.47 12.96
Verbal guidance 55 75.57 13.14 78.06 12.08 Written guidance 66 76.04 13.44 76.01 14.39
EQ
-5D
VAS
Ill 79 68.80 17.40 69.14 17.22
Healthy 42 82.64 11.94 82.12 12.98
Verbal guidance 55 74.02 18.18 74.20 16.70 Written guidance 66 73.26 16.10 73.18 17.35
MANOVA df = 5,113 F p η2
Within subjects effect of time 2.42 .040* .097 Between subjects’ groups:
Health status (ill / healthy) 6.16 .001*** .214 Experimental condition (verbal /
written guidance)
0.42 .836 .018
Interactions:
Time*health status 0.33 .896 .014
Time*experimental condition 1.00 .421 .042 Time*health status * experimental
condition
0.36 .877 .016
Table 2 Differences in the importance of QoL in relation to health status groups, and differences between core QoL and Importance
WHOQOL Importance between subjects contrasts within MANOVA F p η2
Health status WHOQOL Importance
Physical Health 12.39 .001*** .092
Psychological Health 5.42 .022* .043
Social Relationships 2.71 .102 .022
Environment 0.79 .376 .006
Dependent t tests Ill Healthy
Domain N
Cor e QoL m ean Cor e QoL SD Import an ce m ean Import an ce SD Mean
diff. t p N
Cor e QoL m ean Cor e QoL SD Import an ce m ean Import an ce SD Mean
diff. t p
T1
Physical 82 64.06 19.10 77.50 10.18 -13.44 -5.84 .001* 44 79.00 16.54 84.50 12.44 -5.49 -2.03 .049
Psychological 85 63.86 15.49 75.11 11.43 -11.25 -5.46 .001* 44 67.31 12.44 78.77 14.10 -11.45 -3.60 .001*
Social 85 68.73 18.03 68.53 15.34 0.20 0.08 .933 44 70.45 19.81 73.58 18.24 -3.12 -0.85 .401
Environment 85 74.30 13.30 78.91 11.19 -4.61 -2.67 .009* 44 78.34 13.20 79.98 13.31 -1.64 -0.60 .555
T2
Physical 81 64.93 18.65 78.16 10.10 -13.23 -5.77 .001* 44 81.25 15.46 84.94 12.78 -3.69 -1.44 .158
Psychological 84 65.53 15.97 75.23 12.55 -9.70 -4.64 .001* 44 70.02 11.67 81.53 11.76 -11.52 -5.02 .001*
Social 85 69.56 18.92 69.55 15.72 0.01 0.01 .996 44 73.20 20.85 73.86 17.75 -0.66 -0.18 .857
Environment 84 75.30 13.38 79.02 10.17 -3.72 -2.22 .029 44 79.27 13.54 81.65 12.17 -2.37 -1.03 .311