1
West of England Sustainable Travel (WEST)
Baseline and Years One, Two, and Three
(to 2014/15)
Annual Outcomes Monitoring Report
Authors (alphabetical): Caroline Bartle, Kiron Chatterjee, Billy
Clayton, John Parkin and Miriam Ricci,
2
Executive Summary
The Local Sustainable Transport Fund was launched in January 2011 with the four West of England unitary authorities (Bath and North East Somerset, Bristol City, North Somerset and South Gloucestershire Councils) being awarded nearly £30 million by the Department for Transport from the fund on two separate but linked project programmes. The Key Commuter Routes (KCR) project programme was implemented in 2011/12 to 2012/13. The West of England Sustainable Travel (WEST) ‘Large Project’ programme was implemented in 2012/13 to 2014/15 and involved an integrated package of measures covering the entire West of England travel to work area. The WEST project was awarded extension funding covering the 2015/16 financial year, but the outcomes from this funding are not covered by this report.
The context for the programme is that the West of England area has a high level of road congestion and significant anticipated growth in housing and jobs. The WEST project represents a complex intervention due to the dynamic environment in which it is being implemented, the interaction between different measures within an overall package, the targeting of multiple behaviours, the impacts potentially taking time to build up and the effects varying across the population.
This Annual Outcomes Monitoring Report for 2014/2015 provides results on outcomes from the LSTF programme delivered up to the end of 2014/15. The data presented is divided into five areas: aggregate data; business engagement; local communities; public transport and transitions. There is a final chapter which deals with the process evaluation.
Aggregate data
Area wide data is produced for the following: travel perceptions and satisfaction; travel behaviour; congestion and reliability; carbon emissions; access to employment and commercial centres; air quality and road casualties; physical activity; economic activity.
Satisfaction
The National Highways and Transport Survey (NHTS) shows an increase in satisfaction with cycling which resumes the longer-term positive trend since 2008. Of the four authorities, respondents in South Gloucestershire reported the highest levels of satisfaction across the four cycling categories. The data for bus services demonstrate that levels of satisfaction have risen since the 2010 baseline in two of the three sub-categories: fares and service frequency. While having demonstrated rises in satisfaction for punctuality in earlier years, satisfaction with punctuality is now lower than in 2010. Overall satisfaction in all the unitary authorities is nonetheless greater than at the 2010 baseline. Satisfaction with public transport travel information provision is an area in which there has been an increase in satisfaction and this has increased consistently from year to year since the 2010 baseline. While the NHTS samples households, the Bus Passenger Satisfaction surveys, undertaken by Passenger Focus, samples bus passengers. Passenger Focus data mirror the NHTS data with increases in satisfaction with value for money and reductions in satisfaction with punctuality, with no change in overall satisfaction since 2011.
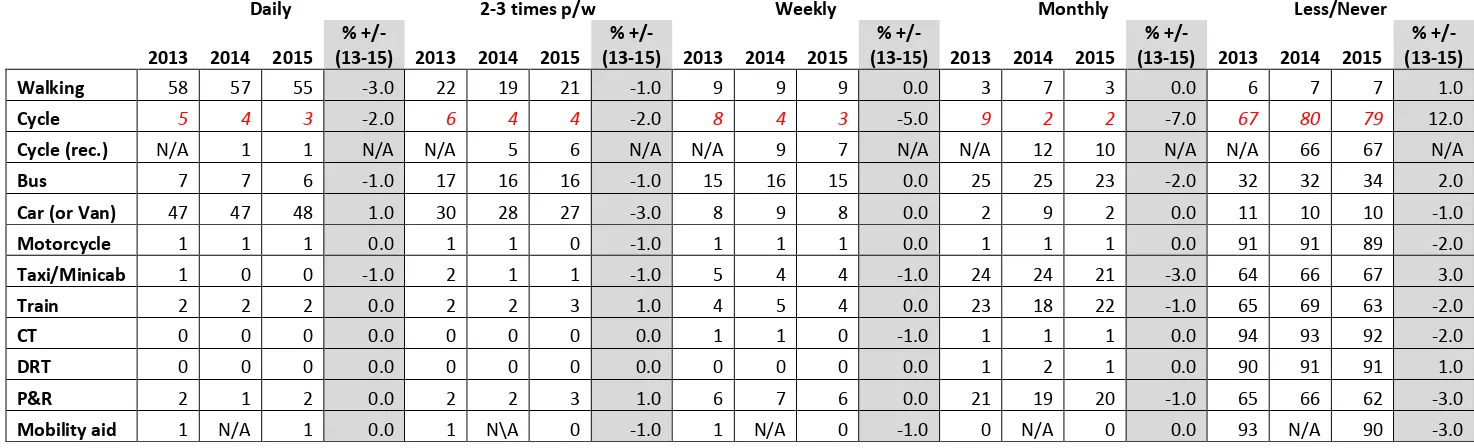
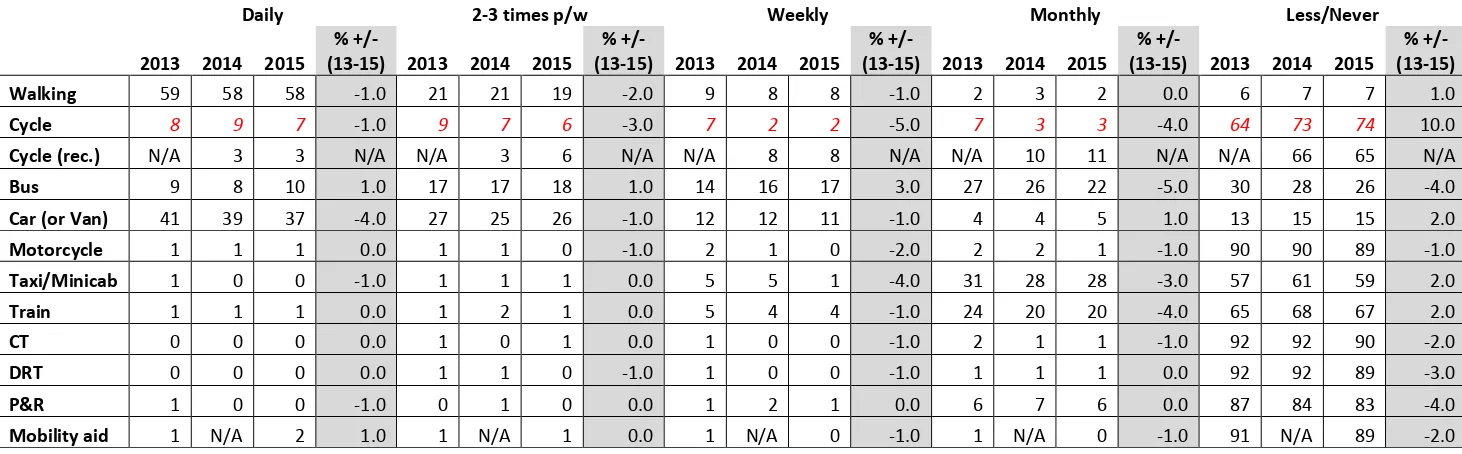
Mode share
The National Highways and Transport Survey shows around half of respondents walk and use the car daily. A lower proportion of respondents cycle regularly, with 3-10% cycling daily for general or recreational purposes. The bus is also used less often than the car on a daily basis (by 6-10% of respondents), however, it is used by 38-39% of people on a slightly less-frequent basis (either weekly or monthly).
Vehicle flow data
3 2.58%. There was an increase of 300 million car kilometres (0.77%) and this compares with an increase for Great Britain of 1.97%. It should be noted that in the case of motor traffic on non-trunk roads, (i.e. the roads managed by the four unitary authorities) these have seen an increase of 800 million vehicle kilometres, or 2.34%.
Analysis of the cordon, screenline and route traffic count data suggests changes ranging from a reduction of 28% to an increase of 16% in road traffic. A full analysis of the traffic count data will be presented in the final report in December 2016.
Bus patronage and cycle flow data
The bus patronage figures for 2014-2015 demonstrate the continuing increasing trend in bus patronage since 2010. The overall change since 2010 is +17.4%.
Levels of cycling across three of the four UAs have risen to levels above target in 2013/14. In BANES, North Somerset, and South Gloucestershire, there has been an increase of approximately 24.0% since the 2010/11 baseline. A breakdown in the management of Bristol’s cycle counter network in 2013/14 continued into 2014/15 and has meant that data for the current reporting period for this authority is not available. The most recent sub-regional figure from 2013 shows that the increase in cycle flows was meeting the target. Bristol City Council suggests, with what data is available, that there has been a 9% increase in cycling in Bristol since 2012/13.
Congestion and reliability
Between 2010/11 and 2014/15, speeds reduced slightly across BANES, Bristol, and South Gloucestershire. However in North Somerset they rose by 3.4%. Bristol had the lowest average vehicle speeds (14.5mph), whilst North Somerset had the highest (30.8mph). This is likely to be a reflection of the different urban and transport network densities of the two areas. The results for bus punctuality demonstrate that generally the WoE sub-region is maintaining positive outcomes in this area, however, there has been a drop in the proportion of buses starting on time in the 2014/15 reporting period when compared to the previous year.
Carbon emissions reductions
The results for carbon emissions shows that after initially exceeding target values, since 2009 the WoE sub-region has reduced carbon emissions year-on-year to well beneath target levels. Reductions in carbon dioxide emissions have been recorded across all four of the UAs, and annual area-wide levels emissions of carbon dioxide from road transport have fallen by 171.8 kilotonnes between 2006 and 2013. This represents an overall reduction of 11.6%. The data for Ultra-low emissions vehicles shows that across the South West region (note: not the four West of England authorities, for which data is not yet available to us), there has been an increase year-on-year in the number of low emissions vehicles licensed. Since the 2010 baseline there has been well over a tenfold increase in the number of new low emissions vehicles licensed – rising from 166 in 2010 to 1,961 in 2014.
Employment rate
The number employed in the WoE region in 2014/15 is 541,200, a 0.88% increase on the 2009/10 period. The employment rate has increased from 74.6% to 77.4%. Numbers unemployed have reduced over the same period by 32% to 24,700, representing an unemployment rate of 4.4%, 1.9% points less than in 2009/10.
Air quality and road casualties
4 Gloucestershire, there has been a decrease of 2.5µg/m3 nitrogen dioxide for sites exceeding thresholds in Kingswood from 2010-2014 and a decrease of 2.0µg/m3 nitrogen dioxide over the same period in sites exceeding thresholds in Staple Hill. The road causalities results shows a considerable reduction in the number of people killed or seriously injured on the roads in the WoE sub-region over the period 2005-2014. In total, by 2014 there had been a reduction of 22.6% in the number of road casualties killed or seriously injured compared with the 2005-2009 baseline average of 358. There has been a reduction of 11.2% in KSI incidents in relation to the 2010 baseline.
Business Engagement
Business engagement activity principally comprises of Area Travel Planning and employer grants promoted through roadshows and supporting activities. Other activities as part of business engagement include promotion of low emission vehicles and the consolidation of freight before final delivery.
Area travel plans and employers grants
Employers in the whole of the West of England area are in scope, however there has been a strong focus on three growth areas: Portside; North Fringe; and Bristol Airport. Site-specific packages to enhance access by alternatives to the car may be categorised in three ways: grants to employers for on-site measures; off-site measures; and other support services. On-site measures have been principally cycling facilities (cycle parking, showers, changing facilities and electric bikes). Off-site measures include commuter coach services to the North Fringe and the A2 Airport Link Bus and cycle routes. Other support services include a variety of offers including roadshows and bicycle maintenance and repair visits.
235 employers were engaged with the project in Bristol in 2014/15, an increase on the 104 in 2013/14 and 61 in 2012/13. 47 employers were engaged in North Somerset, 27 in BANES and 67 in South Gloucestershire. A total of 42 grants with value of £222,000 were awarded in 2014/15 compared to 50 in 2013/14.
There were 159 Sustainable Travel Roadshows at employers’ sites in 2014/15 which engaged 5,254 individuals with 951 individuals receiving detailed information and/or support.
In 2014/15, travel to work surveys were conducted across employers in Bristol and South Gloucestershire, including North Fringe employers forming part of the Strategic Employment Site evaluation, and at Bristol Airport.
Responses from 5,070 North Fringe employees (response rate 16%) in the Strategic Employment Site area shows a decrease in single occupancy car use from 51.3% in March 2014 to 49.8% in March 2015. It should be noted, however, that the responses in the two years are not drawn from exactly the same sets of employers. Bus use rose from 6.1% in 2014 to 9.3% in 2015 and cycling rose from to 11.7% in 2014 to 13.5 % in 2015.
Promotion of low emission vehicles
The project has delivered further electric vehicle charging points (EVCPs) and enabled to expansion of the car-pool scheme offered by Co-Wheels. 53 electric vehicle charging points, accounting for a total of 74 sockets, were constructed in 2014/15. There are now 68 EVCPs across 56 sites in the West of England, providing a total of 104 sockets. The network of charge points cover car parks with a total of 13,000 parking spaces and businesses with a total in excess of 19,576 staff. The electric charging points were used a total of 3,071 times between 1st April 2012 and 1st January 2015 with total electricity
5 Consolidation of freight
DHL operates the Bristol/Bath freight consolidation centre near Junction 18 of the M5, and uses two electric delivery vehicles. LSTF funding is being used to enhance the freight consolidation centre with additional resources to facilitate the expansion of the service to further retailers and organisations across BANES and BCC. Overall in 2014/15, the freight consolidation scheme has served a total of 133 retailers across Bristol and Bath (12 less than in the previous financial year) and as a result of their participation in the scheme the consolidation centre has prevented over 2,074 delivery trips to the two city centres with an estimated reduction in carbon dioxide emissions of 23,657 tonnes.
Local communities
Local community projects comprise of the following: community grants and neighbourhood fund measures; walking and cycling infrastructure measures; and 20mph measures. Active neighbourhood fund grants in Bristol City help local communities to address local barriers to sustainable travel. Priority Neighbourhood Fund capital grants provide a similar mechanism in South Gloucestershire. In addition to grants, Community Active Travel Officers (CATOs) (Bristol) and the Walk to Health Officer (South Gloucestershire) have engaged at community events and with community groups.
The evaluation is being undertaken as follows: bespoke monitoring of grants by Bristol; six community focus groups; and interviews with CATOs. Throughout the period of implementation of the community grants, monitoring agreements were put in place and six focus groups have been undertaken.
Community grants
Analysis of the community grant agreements is on-going and will be provided in the final evaluation report. Three case study examples of the focus groups are presented as well as one monitoring agreement.
Cycling and walking infrastructure
Over a dozen cycling and walking infrastructure improvements have been put in place during 2014/15 and these build on the networks and facilities that have been constructed in previous years. Full analysis will be contained in the 2015/16 AOMR.
20 mph measures
6
Public Transport
Public transport improvements are to services and infrastructure. Service improvements comprise of the following: X18 commuter bus service Kingswood to Aztec West; express commuter coach service Weston-super-Mare to the North Fringe; X2 and X3 Bristol to Portishead (additional to existing X1); 19 and 13 university services (an extension to the 13 was replaced in part by the new X74 service; community transport and responsive commuter services; community transport and demand-responsive commuter services. Bus punctuality improvements include improvements on routes on the A4174, Little Stoke Lane and Emersons Way. Infrastructure improvements have been made on the 24 route and the 6/7 route in Bristol. Financial support, with associated promotion, has included work on the 379 Midsomer Norton to Bristol route.
WEST LSTF and Better Bus Area funding is also improving the on-board environment, travel information, and the promotion of services. These measures include the following: improvements to Real Time Information (RTI) at stops and on buses; next-stop displays and audio announcements; network management measures in BANES; Wi-Fi installation on 300 buses.
Data collection for public transport measures involve satisfaction surveys on corridors served by new or enhanced services, and collecting service-specific patronage figures. Since its introduction, the X18 service has experienced a steady growth in patronage. The Kings Ferry commuter coach service has seen steady patronage growth (after the decline in use at the end of the initial free period). The X18 is popular with a younger demographic and the other express coach services with an older demographic. On the X18, the highest proportions of participants reported having either not made the journey before the introduction of the service (47%), or having switched from using another bus service (40%). This finding represents an interesting shift from the previous year’s results, where the majority (53%) had reported switching from car travel. The largest proportion of passengers on The Kings Ferry express coach service had switched from car travel (47%), and the second highest did not make the journey before (20%), demonstrating that this service has been effective in attracting car users.
The University of the West of England service 13 has shown a decline in boardings in 2014/15 but part of its route has been replaced by the X74. The service 19 has seen growth and is now operating commercially. The data for levels of satisfaction on the X1 corridor show a generally increasing trend in levels of satisfaction since 2011, and this is consistent with the longer-term positive trend since 2007. In contrast to the data from the X1 corridor, levels of satisfaction on the X2 and X3 corridor have fallen slightly between 2011 and 2014.
Service enhancements in BANES have rendered 75.3% of passengers satisfied, 15.9% points fewer than in 2012. Satisfaction with punctuality declined to 56.1% a 36.9% point reduction on 2012. 70.7% reported being satisfied with the frequency of buses, 12.6% points less than in 2012. 76.8% were satisfied with value for money, 11.9% points less than in 2012.
Transitions Projects
Four types of project are being carried out to encourage sustainable behaviour change at transition points in the lives of individuals in specific groups as follows: the move to secondary school; transition from compulsory education into jobs or further education and training; transition from College/Sixth Form to first year at university, and transition from first year hall of residence to second year private accommodation; and transition into a new home.
Move to secondary school
7 were run, alongside route planning, pedestrian training, scooter training and led bike rides, and the installation of 20mph zones around schools. 208 scooter spaces and 112 cycle spaces were installed in schools and footways and signing surrounding schools was improved. A schools travel challenge was run with over 1973 participants from 16 schools. In total in 2014/15, 129,020 children participated in sustainable transport activities delivered by the ATSOs. Focus groups in two secondary schools showed that active travel interventions helped pupils to become more aware of sustainability and health issues, to become more confident about travelling on their own, to understand how to cycle safely on the road and repair a bike and to challenge gender stereotypes and help young girls to become confident cyclists.
Transition to work
The Wheels to Work West scheme was launched in September 2013 to work with partner organisations to assist job seekers access training and employment opportunities. In excess of 3000 bus tickets have been distributed to help people access work and training. 25 bikes and 10 scooters were loaned over 2014/15. 20 new Wheels to Work West partner organisations have been engaged in 2014/15, taking the total number of engaged partners to 49. An online questionnaire survey has gathered data on bus ticket use at the time of application for tickets at the partner organisation site. A total of 2,090 completed questionnaires were obtained up to September 2015. Almost half of the respondents were 30 years old or younger and most did not have a driving licence. Attending a training course was selected by 41% of the sample as the main purpose of the free bus journey, followed by starting a new job (23%) and attending a job interview (16%). While a quarter of the sample stated they would still make the journey and pay the full bus fare, half (49%) claimed they would not be able to make the journey. Cost was the most cited barrier to making the journey by bus without the free bus ticket. Qualitative comments made by recipients of bus tickets and loan bikes/scooters indicated that they had been enabling factors in finding and maintaining employment.
Move to university
Interventions to encourage behaviour change in the move to university and from year one to year two at university have been implemented in partnership with the University of Bristol and the University of the West of England, Bristol. Based on the previous year’s pilots and a commissioned insight report, a travel marketing campaign was designed making use of some existing TravelWest branding. This was delivered from May to November 2014 starting with a pre-arrival summer e-communications campaign which reached prospective students and followed-up with a series of events during the first 6 weeks of term. The pre-arrival email campaign reached about 80,000 people and social media reached about 104,655 people for first 6 weeks of term. There were 1500 engagements from 40 separate events in the first six weeks of term. The annual UWE travel cordon count for all travel to two campuses (Bower Ashton and Frenchay), including students, staff and visitors on a given day in November, showed a reduction in car alone mode share from 34% to 28%, although park and walk increased from 3% to 7%, a reduction in bus mode share from 31% to 28% and small increases in use of other modes.
Move to new home
9
Contents
1. Introduction ... 12
1.1 Introduction and purpose of report ... 12
1.2 Overview of the WEST programme ... 12
2. Monitoring and Evaluation of WEST Programme ... 16
2.1 Evaluation approach ... 16
2.2 Indicators ... 17
2.3 Annual Outputs Report ... 25
3. Area wide data ... 26
3.1 Travel perceptions and satisfaction ... 26
3.2 Travel behaviour ... 39
3.3 Congestion and reliability ... 61
3.4 Carbon emissions ... 65
3.5 Access to employment and commercial centres ... 67
3.6 Air quality and road casualties ... 68
3.7 Physical activity ... 73
4 Business Engagement ... 75
4.1 Delivery progress with Area Travel Plans and Employer Grants ... 75
4.1.1 Employers engaged through LSTF business support activities ... 75
4.1.2 Employer grants ... 83
4.1.3 Sustainable Travel Roadshows ... 85
4.1.4 Sustainable Travel Roadshows ... 89
4.2 Data collection plan for Area Travel Plans ... 90
4.2.1 Results for Area Travel Plans... 90
4.2.2 South Gloucestershire Council and Bristol City Council Travel to Work Survey ... 90
4.2.3 Bristol Airport Employee Travel Survey, 2014 ... 92
4. Local Communities ... 98
4.1 Delivery progress with Community Grants and Neighbourhood Fund measures ... 98
4.1.1 Overview of interventions ... 98
4.1.2 Delivery progress ... 98
4.2 Data collection plan for Community grants and neighbourhood fund measures ... 99
4.2.1 Community Grant monitoring agreements ... 99
4.2.2 Community focus groups ... 101
4.3 Delivery progress with Walking and Cycling infrastructure measures ... 103
4.3.1 Overview of interventions ... 103
4.3.2 Delivery progress ... 104
4.4 Data collection plan for Walking and Cycling infrastructure measures ... 105
4.5 Results for Walking and cycling infrastructure measures ... 107
4.5.1 BANES ... 107
4.5.2 North Somerset ... 110
4.5.3 South Gloucestershire ... 112
4.6 Delivery progress with 20mph measures in Bristol ... 113
4.6.1 Overview of interventions and delivery progress ... 113
10
4.8 Results for 20mph measures ... 114
4.8.1 Household Interview Surveys ... 114
5. Public Transport ... 121
5.1 Delivery progress with Public Transport ... 121
5.1.1 Overview of interventions - Services and infrastructure ... 121
5.1.2 Overview of interventions - On-board improvements and service promotion ... 121
5.1.3 Delivery progress ... 122
5.2 Data collection plan ... 123
5.3 Results for Public Transport ... 123
5.3.1 Commuter bus and coach services ... 123
5.4 Satisfaction survey results ... 128
5.4.1 Gender ... 129
5.4.2 Age ... 130
5.4.3 Journey purpose ... 132
5.4.4 Commuter – length of employment ... 133
5.4.5 Frequency of travel on service ... 135
5.4.6 Passenger satisfaction ... 136
5.4.7 Year respondent began using service ... 140
5.4.8 Previous mode of access ... 141
5.4.9 Method of introduction to service ... 143
5.4.10 Car access ... 143
5.4.11 RTI use ... 145
Summary ... 145
5.4.12 Services 13 and 19 ... 146
5.4.13 GBBN Kickstart ... 147
5.4.14 GBBN Service enhancements (BANES) ... 151
6. Transitions ... 158
6.1 Delivery progress with The Move to Secondary School ... 158
6.1.1 Overview of interventions ... 158
6.1.2 Delivery progress ... 159
6.2 Data collection plan for The Move to Secondary School ... 162
6.3 Results for The Move to Secondary School ... 162
6.4 Delivery progress with Wheels to Work West ... 164
6.4.1 Overview of interventions ... 164
6.4.2 Delivery progress ... 164
6.5 Data collection plan for Wheels to Work West ... 165
6.6 Results for Wheels to Work West ... 165
6.7 Delivery progress with Universities ... 171
6.7.1 Overview of interventions ... 171
6.7.2 Delivery progress ... 171
6.8 Data collection plan for Universities ... 172
11
6.10 Delivery progress with New Developments ... 175
6.10.1 Overview of interventions ... 175
6.10.2 Delivery progress ... 175
6.11 Data collection plan for New Developments ... 186
6.12 Results for New Developments ... 186
7. Process evaluation ... 188
7.1 Purpose ... 188
7.2 Methodology: data collection and analysis ... 188
12
1.
Introduction
1.1
Introduction and purpose of report
The Local Sustainable Transport Fund was launched in January 2011 with the four West of England unitary authorities (Bath and North East Somerset, Bristol City, North Somerset and South Gloucestershire Councils) being awarded nearly £30 million by the Department for Transport from the fund on two separate but linked project programmes. The Key Commuter Routes (KCR) project programme was implemented in 2011/12 to 2012/13. The West of England Sustainable Travel (WEST) ‘Large Project’ programme was implemented in 2012/13 to 2014/15 and involved an integrated package of measures covering the entire West of England travel to work area. The WEST project was awarded extension funding covering the 2015/16 financial year, but the outcomes from this funding are not covered by this report.
The WEST Outcome Monitoring Plan was produced in July 20131 and sets out how the WEST project
programme will be monitored and evaluated in accordance with a Framework provided by DfT2. The
first Annual Outcome Monitoring Report (AOMR) covering the period to March 2013 was published in December 20133. That report also established the baseline position on outcomes, which is
generally based on data for 2010/11 (the year prior to any LSTF investment) with results also presented for 2011/12 (the year preceding WEST programme and first year of two years of KCR programme). The second AOMR covered the period to March 2014. This is the third AOMR and covers the period to March 2015. A final overall evaluation report will be produced in December 2016. As well as outcomes, this report (and its predecessors) contain a summary of progress with delivering elements of the programme to 2014/15, as this is necessary context for interpreting outcomes.
After the Introduction section, the evaluation approach and plan is summarised. Results are then presented on area-wide outcomes. This is followed by detailed reporting on progress with delivery of the programme, organised into four sections covering the business engagement, local
communities, public transport and transitions project areas. Finally, a summary is provided on process evaluation which is being undertaken alongside monitoring of outcomes.
1.2
Overview of the WEST programme
The WEST project programme involves an integrated package of measures covering the entire West of England travel to work area which is being implemented in the period 2012/13 to 2014/15 and is aligned with the planned development of homes and jobs in priority growth areas up to 2030. The outcomes of the extension funding in 2015/16 will be presented together with an overall evaluation of the project in December 2016.
The project has a main emphasis on influencing travel made at peak times of day with nine projects under the following three themes:
1UWE (2013). West of England Sustainable Travel (WEST) Outcome Monitoring Plan (Version 3.0). University of the West
of England, Bristol.
2 DfT (2012). Local Sustainable Transport Fund Monitoring and Evaluation Framework. Department for Transport, London. 3 UWE (2013). West of England Sustainable Travel (WEST) Annual Outcome Monitoring Report 2012-13.
13 Stimulating Growth in Priority Areas (‘tackling congestion to get business and our economy
moving’ with aims to reduce peak-hour congestion, make it easier for employees to gain access to work and reduce carbon emissions)
o Area Travel Plans
o Key Commuter Routes (continuing work started with Key Commuter Routes LSTF project)
o Business travel
Connected and Thriving Centres (‘completing end-to-end journeys’ with aims to support the local economy, improve access to employment, training and education, encourage walking and cycling for local journeys and ensure that our town and city centres can continue to prosper)
o Local economic activity in urban areas o Sustainable travel in key centres
Transitions to a Low-Carbon Lifestyle (‘Training, skills and securing long term benefits’ which recognises that our interventions to change travel behaviour are more likely to be effective if they occur at times of change in people’s lives, and focuses effort on influencing travel choice at these life transitions to taking advantage of life transitions as opportunities for behavioural change)
o The move to secondary school o Access to work and skills o Universities
o New developments
The West of England project area is shown in Map 0 with 11 key commuter routes (‘key corridors’) and three strategic employment areas (where Area Travel Plans are being developed) indicated. The project programme is being delivered via dedicated LSTF teams in five delivery areas working with the four unitary authorities (which each have LSTF project managers):
Business engagement
Marketing and communications Public transport
Support services Transitions
The context for the programme is that the West of England area has a high level of road congestion and significant anticipated growth in housing and jobs. It has the lowest peak period speeds on main routes of any major urban area in England and car-based commuting comprising 63% of journeys to work. Road transport is estimated to account for one third of carbon emissions generated in the area. The programme has a focus on priority growth areas which account for at least 70,000 of the 95,000 new jobs that are aimed to be created by 2030. Business leaders and the Local Enterprise Partnership (LEP) see good access to the labour market and talent pool as a priority for economic growth in the area.
The West of England represents a self-contained journey to work area with 89% of people living in the area also working in the area. 51% of the population of the area (550,000) live on the 11 Key Commuter Routes targeted by the programme. Both of these data highlight the good potential for interventions within the area to have an impact on commuting behaviour and congestion.
2011-14 26 and five major transport schemes that are being implemented in the next ten years alongside JLTP3. Three West of England authorities have also been successful in 2013 with a Cycling City Ambition Fund grant application.
The different themes and projects in the WEST project are designed to interconnect spatially and support end-to-end journeys. WEST is aimed at achieving impacts in the short term (building on past successful initiatives) and medium and long term (as new developments and transport infrastructure are completed and more people experience life transitions).
The national LSTF programme has the following two primary objectives:
support the local economy and facilitate economic development, for example by reducing congestion, improving the reliability and predictability of journey times or enhancing access to employment and other essential services; and
reduce carbon emissions, for example by bringing about an increase in the volume and proportion of journeys made by low carbon, sustainable modes including walking and cycling.
WEST also aims to address the four secondary objectives of the national LSTF programme:
helping to deliver wider social and economic benefits (e.g. accessibility and social inclusion) for the community;
improving safety;
bringing about improvements to air quality and increased compliance with air quality standards, and wider environmental benefits such as noise reduction; and
promoting increased levels of physical activity and the health benefits this can be expected to deliver.
15
16
2.
Monitoring and Evaluation of WEST Programme
2.1
Evaluation approach
As noted in the WEST Outcome Monitoring Plan (OMP) submitted to DfT in July 2013, the evaluation of LSTF projects is required to meet the following DfT objectives:
to investigate the contribution of the fund to delivering economic growth and carbon reduction;
to understand how the fund has delivered against some or all of the secondary objectives; to provide accountability to taxpayers and Parliament;
to fill evidence gaps to inform the case for future local, national or third party funding for sustainable travel and to improve development and appraisal of future proposals; and provide an effective method for benchmarking and comparison.
DfT issued some common metrics it wishes LSTF Large Projects (including the WEST programme) to measure in its Monitoring and Evaluation Framework. These have been taken into account in developing the OMP.
The West of England authorities have additional aims from evaluation of the WEST programme: to assess the value for money of the programme by considering outcomes/impacts against
local objectives;
to learn about the effectiveness of different interventions in the local context to support improved design of future interventions;
to test the effectiveness and impact of innovative approaches (e.g. the four projects in transitions theme); and
to inform the future strategy for local sustainable transport from 2015/16 onwards. This leads to the following research questions which provide the foundation for the evaluation:
1. What level of engagement was achieved with stakeholders and the public and what factors led to increased engagement?
2. What is the change in acceptance of using low carbon travel alternatives for commuting, education and local non-work journeys?
3. What is the overall change in use of different travel modes for commuting, education and local non-work journeys and how far can this be attributed to LSTF interventions?
4. How do changes in commuting, education and local non-work journeys contribute to wider impacts (carbon, economic growth)?
5. How are outcomes/impacts distributed geographically and by socio-demographic groups? 6. What measures have been particularly successful and why, and what measures have been
less successful and why?
7. What indication is there that changes in use of low carbon travel alternatives will be sustained or grow beyond the investment period?
17 varying across the population. It is therefore apparent that the evaluation needs to address the questions of how the intervention causes change, as well as what impacts are achieved.
The evaluation approach has been developed following the steps recommended in the DfT guidance on transport impact evaluation4. It has been determined that an extended intervention logic
evaluation approach is appropriate. This is because the evaluation resources do not allow large-scale collection of primary data. The approach involves bringing in elements of a theory-based approach into a study of outcomes so that the evaluation can answer questions about why change was produced (as well as what change occurred). The main features of this approach are:
Collection of routine secondary monitoring data relevant to the programme; Stakeholders provide views on connections between outputs and outcomes; and New data is collected where important gaps are identified and resources permit it. A programme logic map was included in the OMP which provides a systematic and visual representation of how the interventions carried out are expected to achieve the programme objectives through engagement with target agents and users and modification of travel knowledge, perceptions, capabilities, behaviour and satisfaction. More specific logic maps have been produced for the four project areas of the WEST programme that have been defined for the purposes of monitoring and evaluation (business engagement, local communities, public transport, transitions). Section 2.2 explains how the logic maps enabled the identification of indicators to monitor in the WEST programme evaluation.
In addition to monitoring and evaluating the outcomes of the WEST programme, there is value in learning about the process of delivering the programme. Hence a process evaluation is being conducted. This involves documenting what happens in a programme in order to learn about the effectiveness of its delivery. Quantitative Information on the implementation of the WEST
programme will be obtained through project management data on inputs and outputs. This will be complemented by qualitative data in the form of self-completion questionnaires completed by delivery managers every six months. These will seek to help answer:
What interventions were implemented, by whom, and who were the recipients? What resources, including financial, were mobilised in each intervention? Which interventions worked well and why?
Which interventions worked less well and why?
What lessons have been learnt and how can these lessons help improve the design and delivery of future programme interventions?
Two forms have been designed to gain an understanding of objectives, activities, issues and thoughts during the reporting period. One form is designed to be completed by managers of specific work packages or measures within the WEST programme, with another form for those who manage wider project areas, tranches or themes.
Summary findings from the process evaluation are included in Chapter 8 of this report.
2.2
Indicators
Data requirements follow from the logic maps which show how interventions are expected to achieve objectives via delivery of projects (outputs), engagement of agents and users (participation), changes in travel perceptions, behaviour and satisfaction (outcomes) and benefits to society
4 Hills, D. and Junge, K. (2010). Guidance for Transport Impact Evaluations: Choosing an Evaluation Approach to Achieve
18 (impacts). The outcome indicators represent the short to medium term changes in thoughts about transport and travel behaviour of people living, working and visiting the West of England. The Impact indicators represent the longer term effects for society. These are dependent on outcomes being achieved.
An Indicators Framework produced for the OMP is shown in Table 2.1. It is similar to the programme logic map but it itemises the set of outcome and impact indicators that we have identified as being priorities to monitor. Impact indicators are categorised according to different objectives and themes of the programme. The Indicators Framework shows which indicators are derived from data being collected centrally by DfT. The indicators in Table 2.1 are area-wide indicators that apply across the entire West of England area and population. There are also outcome and impact indicators which are being monitored for targeted sub-areas or sub-populations within the West of England area. These are considered in this report in the chapters relating to the four project areas (business engagement, local communities, public transport, transitions).
As part of the extended intervention logic evaluation approach, data is collected on inputs, outputs and external factors, as well as on outcomes and impacts. This is in order to test whether anticipated mechanisms for change occur. Indicators for inputs, outputs, outcomes and impacts are as follows:
1. Inputs – expenditure and resources are monitored monthly based on quarterly spend information. Information on this is reported to DfT at the end of each financial year with a summary included in the Annual Outputs Report. These data are not presented in this report.
2. Outputs (infrastructure and services) – infrastructure and services delivered are monitored internally based on monthly progress reports from work package managers with the information collated in monthly ‘Highlights Reports’ which record achievement or slippage of milestones. Summary of progress at the end of each financial year is reported to DfT in the Annual Outputs Report. This report includes more detailed information about outputs than included in the Annual Outputs Report as this is important for interpretation of results on outcomes.
3. Participation – engagement with agents (e.g. employers, communities, schools, and universities) and users (e.g. employees, students) is monitored based on project management data (e.g. number of employers applying for grants, number of residents participating in community events). Summary of progress is reported to DfT in the Annual Outputs Report. This report also includes more detailed information about participation than that included in the Annual Outputs Report, and this is again because this information is important for interpretation of results on outcomes.
19
Table 2.1 - WEST Indicators Framework
Programme broad themes
Projects Outcome
indicators
Impact indicators Local objectives (impacts)
Theme 1: Stimulating
growth in priority areas
Area travel plans 1. Travel
perceptions and attitudes Perceptions of transport alternatives Attitudes towards different modes
2. Travel behaviour
Mode use frequency for different journey purposes Vehicle flows Bus patronage Cycling flows 3. Travel satisfaction Satisfaction with transport services, facilities and information Bus satisfaction
Economic growth – road congestion AM peak journey time per mile Variation in journey time Bus punctuality
Economic growth – employment Access to employment Access to commercial centres Modal split at workplaces Journey to work satisfaction Proportion of WEST area in
employment Carbon emissions
Carbon emissions per capita associated with road transport Number of new alternative and
conventional fuel vehicles Quality of life
Nitrogen dioxide concentration levels in AQMAs
Road casualties (KSI) Physical activity and health
Walking level per person Cycling level per person
1.1
Widened lower carbon access to employment and improved economic growth through reduced congestion
Key commuter routes
1.2
Reduced carbon emissions per capita for journeys to work
Business travel 1.3
Improved health, reduced sickness levels and increased workforce productivity
Theme 2: Connected and thriving centres
Local economic activity in urban
areas
2.1
Strengthened local economies
Sustainable travel in key centres
2.2
Improved sustainable transport links / access for employment, training, retail, education and leisure
Theme 3: Transitions to a
low carbon lifestyle
The move to secondary schools
2.3
Increased physical activity and improved health through greater use of walking/cycling for local journeys
Access to work and skills
3.1
Improved sustainable transport access to work and training for young people
Universities 3.2
Increased use of sustainable transport among students and reduced congestion in adjacent points in the network
New developments
3.3
New sustainable travel habits among residents in new developments
20 Data collection strategies have been produced to collect the information identified above. Separate strategies have been produced for aggregate, area-wide data and for the four project areas:
Business engagement Local communities Public transport Transitions
The data collection strategies are included in the OMP (Appendices 8-20). The main emphasis in the data collection strategies is in collecting quantitative data on outputs, participation and outcomes, but some qualitative research will be conducted with target groups where this is considered to be particularly valuable in understanding reactions to and experiences of interventions.
Table 2.2 - Area-wide indicators, metrics, and data sources
Outcome Indicators Metrics Sources
“To improve
perceptions, attitudes, capabilities with respect to transport alternatives”
Attitudes towards using different travel modes
Attitudes towards using different travel modes for journey to work
YouGov commissioned online survey
“To improve
satisfaction with travel alternatives to single occupancy car use”
Satisfaction with transport alternatives
Satisfaction with transport services, facilities and information
National Highways Transport Survey
Bus satisfaction Bus passenger satisfaction Passenger Focus – Bus Passenger Satisfaction Survey
“To change travel behaviours/patterns with greater use of bus, walking, cycling and other alternatives to single occupancy car use”
Mode share Mode use frequency by journey purpose
National Highways Transport Survey Vehicle flows Annual average number of
vehicles/cars over 24 hours/7-10am
Traffic count data (ATCs and MCCs across 4 UAs)
Bus patronage (JLTP3 primary indicator)
Number of passengers per year
Provided by bus operators
Cycling flows (JLTP3 primary indicator)
Annual average weekly total of cycling counts
Cycle count data (ATCs and MCCs across 4 UAs)
Objective Indicators Metrics Sources
“To reduce the costs of congestion on the regional economy”
Journey time (JLTP3 secondary indicator)
Average AM peak journey time per mile
21
Outcome Indicators Metrics Sources
Journey time variability
Variation in journey time on key corridors
Trafficmaster data held in Strategis database Bus punctuality
(JLTP3 secondary indicator)
Proportion of buses starting on time, excess waiting time, and proportion of buses on time at intermediate and non-timing points
Data collected from operators by UAs and reported to DfT
“To tackle transport emissions of carbon dioxide”
Carbon emissions (JLTP3 primary indicator)
Carbon dioxide (CO2)
emissions per-capita associated with road transport
Data supplied by DECC
Low emission vehicles Number of new alternative fuel and conventional fuel vehicles
DVLA licensing data supplied by DfT
“To increase accessibility to employment and commercial centres”
Access to employment Total number of households able to access employment area within 20/40 mins using PT/walking and cycling
Accessibility model
Access to commercial centres
Total number of households able to access commercial centres within 20/40 mins using PT/walking and cycling
Accessibility model
Modal split at workplaces
Number of commuting trips by mode per 100 staff
Employee surveys (conducted in selected areas)
Journey to work satisfaction
Satisfaction with typical journey to work
Employee surveys (conducted in selected areas)
Proportion of WEST area in employment
Job Seekers Allowance (JSA) claimant numbers
West of England Labour Market Report
“To improve air quality, quality of life, and security”
Public perceptions of air quality
Perceptions of traffic pollution
Bristol Quality of Life survey
Nitrogen dioxide (NO2)
(JLTP3 secondary indicator)
NO2 concentration levels AQMA data
Road casualties (JLTP3 primary indicator)
Road casualty killed and seriously injured
22
Outcome Indicators Metrics Sources
“To promote physical activity through active travel”
Walking level per person
Walk for 30 mins or more, walk at all)
Active People Survey
Cycling level per person
Cycle for 30 mins or more, cycle at all
Active People Survey
Cycling level of Bristol residents
Cycle in last week, cycle to work
Bristol Quality of Life Survey
23
Project area Outcomes Key indicators Sources
Business Engagement
Area Travel Plans Decreased single
occupancy car journeys to work
Increased satisfaction with journey to work More positive attitude towards using different modes for journey to work
Modal split at workplaces
Satisfaction with journey to work
Consideration of using different transport modes for journey to work
Employee travel survey
Low Carbon Vehicles Increased usage of low carbon vehicles
Usage statistics Project monitoring
Freight Consolidation Reductions in emissions CO2, CO, NOx and PM
emissions saved
Freight consolidation centre monthly reports
Local Communities
Community Grants Increased walking and cycling
Number of new
walkers/cyclists and time spent walking/cycling
Community project grant monitoring forms
20mph Reduction in vehicle
speed
Average and percentile vehicle speeds
Key sites radar speed data
Reduction in road casualties
Road casualty killed and seriously injured
STATS19 data
Improved perceptions of traffic speed and road safety
Increased walking and cycling
Perceptions of traffic speed and road safety in local neighbourhood Frequency of walking and cycling
Household interview survey (before and after)
Cycling and Walking Infrastructure
Increased number of cyclists
Number of new cyclists and time spent cycling
Cycle counters and user intercept surveys
Public Transport
New/enhanced services
Increased satisfaction Satisfaction with service Bus passenger satisfaction survey Patronage sufficient for
long-term financial sustainability
Number of passengers per month
Bus patronage aggregated data supplied by operators
24
The Move to Secondary School
Decreased single
occupancy car journeys to school
Modal split at schools Hands up survey
Wheels to Work WEST Improved sustainable access to work and skills
Sustainable journeys to work/skills generated by project
Participant survey
Universities Decreased single
occupancy car journeys to university
Modal split at universities University students survey
New Developments Decreased single occupancy car journeys
Modal split at new developments
25
2.3
Annual Outputs Report
The Annual Outputs Report 2014/15 was submitted to the DfT in July 2015. It provides summary details about inputs and outputs delivered in the financial year, and is organised under the following categories:
Programme management and evaluation Business engagement
Cycling and walking infrastructure Bus service improvement measures Community engagement
Transitions
Marketing and communications
The information provided for each of the above categories included the number of people reached and a summary of achievements.
Reference to the Annual Outputs Report 2014/15 is made in this report where appropriate. In some cases, additional information on inputs and outputs (both in terms of infrastructure/activities and participation delivered in 2014/15) is included in this report.
26
3.
Area wide data
This section reports area-wide outcomes for the period 2010/11 to 2014/15 – with earlier historical results reported where available. The outcomes relate to:
Travel perceptions and satisfaction Travel behaviour
Congestion and reliability Carbon emissions
Access to employment and commercial centres Air quality and road casualties
Physical activity Economic activity
For the most part the results in this section are presented at the sub-regional level (West of England (WoE) area) or unitary authority (UA) level, although disaggregation to a more localised level will be reported where this is appropriate (for example, when investment has been focused on sub-areas).
3.1 Travel perceptions and satisfaction
The WEST programme is intended to increase positive perceptions and satisfaction with alternatives to single occupancy car use. This section reports results on travel perceptions and satisfaction from a number of different data sources.
NHTS – Satisfaction with transport alternatives
The National Highways and Transport Survey (NHTS) conducted by Ipsos MORI via a postal distribution of questionnaires to residential addresses in participating local authorities collects a variety of useful information at local authority level, including perceptions and satisfaction with local transport services, facilities and information (for different modes) and mode use frequency for different journey purposes. The survey has been conducted in the four UAs in WoE since it started in 2008, with response sample sizes in 2015 of 866 in BANES, 1068 in BCC, 882 in NSC and 787 in SGC. Mode use frequency is only available from 2011 onwards.
27
Cycling
Table 1 - Satisfaction with cycle parking
2008 2009 2010 2011 2012 2013 2014 2015
BANES 43.0 44.4 45.9 55.3 52.5 55.0 54.1 57.0
Bristol 41.9 47.0 49.0 56.0 54.6 53.4 52.8 52.0
North Somerset 43.5 44.0 47.9 51.8 51.0 52.3 51.5 55.0
South Gloucestershire 48.4 49.8 53.0 56.3 56.3 56.8 54.7 60.0
WoE sub-region 44.2 46.3 49.0 54.9 53.6 54.4 53.3 56.0
Table 2 - Satisfaction with location of cycle lanes
2008 2009 2010 2011 2012 2013 2014 2015
BANES N/A N/A N/A N/A 52.6 54.3 53.3 57.0
Bristol N/A N/A N/A N/A 53.8 53.7 51.1 51.0
North Somerset N/A N/A N/A N/A 56.1 57.0 57.2 60.0
South Gloucestershire N/A N/A N/A N/A 60.6 63.0 58.0 62.0
WoE sub-region N/A N/A N/A N/A 55.8 57.0 54.9 57.5
Table 3 - Satisfaction with number of cycle lanes
2008 2009 2010 2011 2012 2013 2014 2015
BANES 48.2 50.4 50.0 55.5 51.6 53.2 52.4 55.0
Bristol 49.5 51.6 53.8 57.3 56.8 53.6 51.9 53.0
North Somerset 51.3 53.4 57.7 57.7 55.6 56.2 56.6 60.0
South Gloucestershire 62.4 61.4 64.0 64.8 61.9 62.9 60.7 64.0
WoE sub-region 52.9 54.2 56.4 58.8 56.5 56.5 55.4 58.0
Table 4 - Satisfaction with cycle facilities at workplaces
2008 2009 2010 2011 2012 2013 2014 2015
BANES 48.4 51.0 53.1 54.7 53.5 53.5 54.2 58.0
Bristol 50.8 56.2 58.3 58.6 58.2 58.2 57.1 61.0
North Somerset 50.7 49.6 54.2 55.2 53.9 55.6 54.5 58.0
South Gloucestershire 55.2 56.1 58.3 60.2 60.2 59.8 59.2 61.0
28
Chart 1 - WoE sub-region levels of satisfaction with cycle provision
Note: For all analyses in this sub-section a satisfaction figure for the WoE sub-region has been estimated as the mean value of the individual authority figures. We are considering the development of a more precise population-weighted mean.
The results on satisfaction with cycling provision show a positive picture in the past year. In all categories, satisfaction with cycling has risen over the period 2014-2015 (Chart 1). This increase resumes the longer-term positive trend in satisfaction in these categories since 2008, which had plateaued in the previous year. Satisfaction in all categories is above that of the 2010 baseline, albeit by a relatively small amount.
Of the four authorities, respondents in South Gloucestershire reported the highest levels of satisfaction across the four categories. At the aggregate level, the greatest positive change in satisfaction since 2010 has been with the number of cycle parking facilities available (+7.0 percentage points), whilst the smallest change in satisfaction has been recorded with the number of cycle lanes available (+1.6 percentage points).
40.0 45.0 50.0 55.0 60.0 65.0
2008 2009 2010 2011 2012 2013 2014 2015
Per
ce
n
t
WoE satisfaction with cycling
Cycle parking
Number of cycle lanes
Facilities at workplaces
29
Buses
Table 5 - Satisfaction with bus fares
2008 2009 2010 2011 2012 2013 2014 2015
BANES 29.5 31.9 29.9 32.1 29.1 29.2 33.2 38.0
Bristol 19.8 23.8 23.7 22.8 22.0 20.6 40.3 37.0
North Somerset 36.9 39.9 41.2 40.5 40.0 40.5 44.2 46.0
South Gloucestershire 23.9 29.4 32.5 31.0 32.6 32.9 41.3 40.0
WoE sub-region 27.5 31.3 31.8 31.6 30.9 30.8 39.8 40.3
Table 6 - Satisfaction with bus service frequency
2008 2009 2010 2011 2012 2013 2014 2015
BANES 57.2 57.1 56.2 58.2 59.3 62.1 61.6 64.0
Bristol 47.3 56.0 57.9 57.1 57.1 57.9 59.3 56.0
North Somerset 55.4 61.2 59.4 58.6 59.0 62.6 61.3 61.0
South Gloucestershire 46.9 52.5 56.3 55.8 56.6 59.1 59.0 57.0
WoE sub-region 51.7 56.7 57.5 57.4 58.0 60.4 60.3 59.5
Table 7 - Satisfaction with bus service overall
2008 2009 2010 2011 2012 2013 2014 2015
BANES 54.0 54.7 54.5 57.3 57.5 60.1 61.2 64.0
Bristol 40.5 48.2 49.6 51.7 52.0 51.7 56.0 52.0
North Somerset 53.6 60.2 60.5 61.2 59.6 61.8 61.7 61.0
South Gloucestershire 44.3 51.8 55.3 58.6 57.8 59.3 58.5 56.0
WoE sub-region 48.1 53.7 55.0 57.2 56.7 58.2 59.4 58.3
Table 8 - Satisfaction with bus punctuality
2008 2009 2010 2011 2012 2013 2014 2015
BANES 52.0 53.9 50.6 55.8 57.2 59.1 57.4 56.0
Bristol 33.9 43.9 47.5 49.0 49.7 50.4 49.9 43.0
North Somerset 51.0 57.8 57.4 58.5 58.6 60.0 57.8 56.0
South Gloucestershire 41.7 49.6 54.2 56.9 57.4 57.1 54.4 48.0
30
Chart 2 - WoE sub-region satisfaction with bus service provision
The data for bus services demonstrate that levels of satisfaction have risen since the 2010 baseline in two of the three sub-categories: fares and service frequency (Chart 2). The most significant change to passenger satisfaction in this AOMR is the continued decline in satisfaction with punctuality, which had peaked in 2013 at 56.7%, but which over the past two reporting periods has declined to its current level of 50.8% (-5.9 percentage points since 2003). The 2015 result takes satisfaction with punctuality below the level of the 2010 baseline of 52.4%. Whilst it is still above the 2010 baseline level, there has also been a slight decline in satisfaction with bus service frequency over the past two reporting periods, in 2015, satisfaction in this category was 2.1 percentage points lower than its peak of 56.7% in 2013.
A further headline statistic is the continued (albeit slowed) positive trend in satisfaction with fares. This is suggested to be a reflection of the recent changes to the fare structure on First services in Bath, which mirrored those in Bristol the year before. It is evident that these changes have had a positive impact of this on passenger satisfaction, with BANES reporting a +4.8 percentage point rise in satisfaction with fares over the period 2014-2015. In the previous AOMR the headline statistic was Bristol’s drastic increase in satisfaction – possibly attributed to the fare changes – however in 2015 there has been a slight reduction in satisfaction on the 2014 figure (-3.3 percentage points), which may indicate a levelling out with satisfaction as passengers become used to the new fares. In the 2013 AOMR, satisfaction with bus fares was highlighted as a category in which the public were considerably less satisfied than in other areas. Whilst still lagging behind other factors in terms of satisfaction, it is fares that have made the most substantial positive increase across the sub-region since the 2010 baseline.
More generally, there have been gains in overall satisfaction with bus services in only one of the four UA areas over the past year: BANES (+1.8 percentage points). There have been decreases in overall satisfaction in Bristol, (-4.0 percentage points) North Somerset (-0.7 percentage points), and South Gloucestershire (-2.5 percentage points). At the aggregate level, overall satisfaction in 2015 fell slightly
20.0 25.0 30.0 35.0 40.0 45.0 50.0 55.0 60.0 65.0
2008 2009 2010 2011 2012 2013 2014 2015
Per
ce
n
t
WoE satisfaction with bus services
Bus fares
Service frequency
Overall service
32
[image:32.595.74.525.239.506.2]Public transport travel information
Table 9 - Satisfaction with public transport information provision
2008 2009 2010 2011 2012 2013 2014 2015
BANES 48.2 50.3 50.0 52.2 53.2 54.4 54.5 59.0
Bristol 45.5 50.7 51.3 52.4 50.8 51.8 53.9 52.0
North Somerset 49.6 52.1 53.1 56.3 55.8 57.6 57.2 57.0
South Gloucestershire 45.6 50.1 55.3 53.6 55.1 56.6 54.8 56.0
WoE sub-region 47.2 50.8 52.4 53.6 53.7 55.1 55.1 56.0
Chart 3 - WoE sub-region satisfaction with PT travel information provision
Satisfaction with public transport travel information provision has increased consistently from year to year since the 2010 baseline. Across the WoE sub-region, in 2015 there has been a change of +3.6 percentage points since 2010, and an increase of 0.9 percentage points on the 2014 figure. Since the last reporting period, Bristol and North Somerset have seen slight reductions in satisfaction, of -1.9 and -0.2 percentage points respectively, whilst BANES and South Gloucestershire both recorded increases in satisfaction of +4.5 and +1.2 percentage points respectively.
Passenger Focus Bus Passenger Satisfaction Survey – Bus satisfaction
Passenger Focus conducts a national annual survey of levels of satisfaction with bus services in the UK. These survey results are a valuable additional source of satisfaction data which can be used alongside the NHTS to create a fuller understanding of levels of public satisfaction with bus services. It needs to be noted that NHTS is conducted with residents while the Bus Passenger Satisfaction Survey (BPSS) is conducted with bus users. Data for 2014 will be available in the 2014/15 AOMR.
40.0 45.0 50.0 55.0 60.0
2008 2009 2010 2011 2012 2013 2014 2015
Per
ce
n
t
33
Table 10 - Passenger Focus - Bus Passenger Satisfaction Survey
2011 2012 2013 2014
Overall satisfaction 84 82 83 84
Value for money 43 35 48 60
Punctuality 69 69 69 67
Chart 4 - Bus passenger satisfaction survey results
Data from the BPSS is only available since 2011. The 2014 survey results suggest a slight increase in overall satisfaction (+2 percentage points) from 2012, but it now lies at 84%, the same as the 2001 baseline data.
Satisfaction with punctuality has declined slightly on the stable figure recorded in the previous three years, and now stands at 67% (-2.0 percentage points). This corresponds with a similar trend seen in the results of the NHTS.
The BPSS findings show a strong increase in satisfaction with fares: an increase in satisfaction of 25 percentage points in the period 2012-2014 to 60%. This result may be linked to a significant change to the fare structure for First buses travelling in Bristol, which came into effect in autumn of 2013, and the subsequent fare changes in Bath, which came into effect the following year.
0 10 20 30 40 50 60 70 80 90
2011 2012 2013 2014
Per
ce
n
t
Passenger Focus - Bus Passenger Satisfaction Survey Results
Overall satisfaction
Value for money
34
YouGov Attitudes Survey – Attitudes towards using different modes
This section contains results from the 2012 YouGov attitudes survey which was commissioned by the WEST project to explore public attitudes in the West of England towards different transport modes for journeys to work. The survey sample is members of the YouGov panel who live in West of England area and are in employment and who accepted the invitation to complete an on-line questionnaire. The intention is for there to be a follow-up survey conducted in 2015 to assess how attitudes have changed over the course of the LSTF project. While these baseline data have been reported in the previous reports, we repeat them here for reference. For the evaluation, responses to a number of relevant questions have been selected, with the focus on differences in attitudes to car travel and public transport use for work trips. Map 1 supplements this, and shows the postcode data collected in the survey. Over the course of the evaluation a spatial analysis of survey responses will be developed to explore how attitudes are distributed across the sub-region.
Table 11 - Consideration of public transport for work trips
Thinking about your journey to work, which of the following statements best describes your current thoughts about using public transport? (n = 554)
I haven’t really thought about using public transport 31.9%
I have thought about using public transport but decided not to 39.7% I am considering using public transport but haven’t thought about when I will start 0.9% I am considering using public transport more often sometime soon 0.7% I tried to use public transport previously, but decided not to continue 16.4%
35
36
Table 12 - Views and attitudes on car use (percent)
Definitely agree Tend to agree Neither agree or disagree Tend to disagre e Definitely disagree N/
A n
I enjoy driving 26.4 36.8 21.0 10.0 4.8 1.0 900
I find driving stressful 5.8 20.0 24.8 29.8 18.7 1.0 900
With rising costs, owning a car has become less appealing 15.8 47.6 19.8 12.2 3.9 .7 1000
If I could, I would gladly go without a car 11.5 22.9 16.0 24.5 24.5 .6 827
If I could, I would prefer to drive less than I do 12.0 31.2 28.2 18.6 8.7 1.3 827
There are no practical alternatives to travelling by car 33.0 32.2 13.3 13.5 7.7 .2 827
I would only travel by bus if I had no other choice 27.3 29.6 18.7 15.5 8.0 .9 1000
I think it is cheaper for me to go by car rather than use public transport 35.7 36.0 15.5 6.7 4.1 2.1 827
People should be able to use their cars as much as they like 24.3 33.9 19.6 15.8 6.0 .4 1000
[image:36.842.83.773.89.290.2]Restrictions and charges should be implemented to discourage driving 7.8 16.7 18.8 20.9 34.9 .9 1000
Table 13 - Views and attitudes on public transport use (percent)
Definitely agree Tend to agree Neither agree or disagree Tend to disagre e Definitely disagree N/
A n
I like travelling by bus 3.2 17.1 25.0 25.8 27.5 1.4 1000
I find travelling by bus stressful 18.3 32.3 22.0 18.6 6.6 2.2 1000
I find travelling by bus is expensive 48.2 32.6 10.5 4.6 1.4 2.7 1000
In general, when I have the choice I would rather walk or cycle than go by bus 32.3 34.6 16.9 11.4 3.9 .9 1000
Table 14 - Perceptions and experiences of consequences of not owning a car (percent)
Definitely agree Tend to agree Neither agree or disagree Tend to disagre e Definitely disagree N/
A n
Not having a car would seriously damage my career prospects 29.5 24.5 17.9 16.0 10.9 1.2 827
37
38 The results reflect the levels of car use and public transport use reported in the following section. Interestingly, in terms of members of the public considering public transport use, the highest proportions of respondents have considered using public transport for their journey to work but have decided not to do so (39.7%).
Some light is shed on this by looking at views and attitudes about car use. The majority of respondents enjoyed driving (63.2%) and did not find it stressful (48.5%). About half of respondents would prefer to keep their cars (49%), but 43.2% would like to drive less if possible. The majority of respondents nonetheless felt that there is no practical alternative to the car for them (65.2%); despite a majority also feeling that the car is becoming less appealing as costs rise (63.8%). There remains a perception amongst people who drive to work that public transport is more expensive than car travel (71.7%). Amongst all respondents the majority are in favour of people being able to use their cars as often as they wish (58.2%), and there is disagreement that restrictions and increased charges should be imposed on drivers to encourage less car use (55.8%). These results suggest a situation in which there is some opportunity to encourage drivers to use their cars less for work trips – mainly due to the rising costs of car use – however this opportunity will be difficult to realise as public transport is not seen by the majority as a practical alternative.
Looking at views and attitudes towards bus use, the majority of respondents did not like travelling by bus (53.3%) and found the bus to be stressful (50.6%). An even stronger majority of respondents found the bus to be expensive (80.8%), and this mirrors the fears of car drivers in r