An Investigation Into The
Function and Regulation
Of
ERG Exon 7b
Samantha Jumbe
A thesis submitted in partial fulfilment of the requirements of the University of the West of England, Bristol for the degree of Doctor of
Philosophy
A
BSTRACT
The ETS family transcription factor ERG is a key oncoprotein in bone, blood, vascular and most notably prostate cancer where it is activated in at least 50% of cases. Of the several splice isoforms of ERG with variable biological activity those that include the cassette exon 7b are associated with aggressiveness and progression of disease in prostate cancer. Inclusion of exon 7b adds 24 amino-acids in frame to the central ‘alternative domain’ which also contains binding sites for other transcriptional regulators.
A
CKNOWLEDGEMENTS
My sincere gratitude and appreciation go to my supervisors Dr Michael Ladomery, Dr Ian Wilson and Dr Bahareh Vahabi. Mike your tireless commitment and encouragement have been spurred me along and allowed me to develop my confidence and capabilities as a scientist. Thank you for your always open door, never ending time and patience and mostly for being there for me in the most difficult time. Ian for help with techniques and statistics and helping me remember that science is a creative discipline. For a listening ear and fresh perspectives - Bahareh thank you.
I would like to acknowledge and thank my collaborators. Dr Sebastian Oltean (University of Exeter) and Dr Sean Porazinski (Ladomery Lab) for the xenograft work, Dr Lee Spraggon for advice on design and testing of SSOs and the RNAomics Platform team at the University of Sherbrooke, Canada for the high-throughput PCR analysis.
I would like to thank the Malawi Government Scholarship Fund for funding this research and the University of the West of England for providing the research facilities to conduct the research in. Thank you to Kayla Friedman and Malcolm Morgan of the Centre for Sustainable Development, University of Cambridge, UK for producing the Microsoft Word thesis template used to produce this document.
So many friends who are like family – thank you for your prayers and so much more. My parents, sisters, brothers, nieces and nephew who are my most precious possession and have provided unsurpassable sustenance and wisdom. My niece Nina for always checking up on how my work on finding a cure for cancer was going (it’s still a work in progress). I could not be without all of your remarkable love and belief in me. A special mention for my late uncle Luke, and other men like him who fought prostate cancer. Your braveness was my inspiration to embark on this journey.
“To Him who is able to do immeasurably more than all we ask or imagine, according to his power that is at work within us”
A
BBREVIATIONS AND
A
CRONYMS
1,25D calcitriol the active metabolite of vitamin D3
AMKL acute megakaryoblastic leukaemia
AML acute myeloid leukaemia
AP1 activator protein 1
AS alternative splicing
ASO antisense oligonucleotide
ASPCR alternative splicing using endpoint PCR coupled with microcapillary electrophoresis
BCL-X B-cell lymphoma-extra-large
BPS branch point site
BRAF B-Raf Proto-Oncogene, Serine/Threonine Kinase
BRCA1 breast cancer 1
CDK cyclin dependent kinase
cDNA complementary DNA
CELF CUGBP ELAV-like family member
ChIP chromatin immunoprecipitation
CLK cdc2-like kinase
CRISPR-Cas 9 Clustered Regularly Interspaced Short Palindromic Repeats CRISPR associated protein 9
CXCL12 C-X-C motif chemokine ligand 12
CXCR4 C-X-C motif chemokine receptor 4
DAPI 4′,6-diamidino-2-phenylindole
DEF docking site for ERK
DMD Duchenne muscular dystrophy
DNA deoxyribonucleic acid
DSCAM Downs syndrome cell adhesion molecule
ELAVL1 ELAV Like RNA Binding Protein 1
EMT epithelial-mesenchymal transition
ENCODE The Encyclopedia of DNA Elements
ERG ETS-related gene or v-ets avian erythroblastosis virus E26 oncogene homolog
ERK extracellular signal-regulated kinase
ESE exonic splicing enhancer
FITC Fluorescein isothiocyanate
G4 G-quadruplex
GTEx Genotype-Tissue Expression
HDR homology-directed repair
hnRNP heterogeneous nuclear ribonucleoprotein
ISE intronic splicing enhancer
ISS intronic splicing silencer
kDa kilodalton
LPA lysophosphatidic acid
MAPK mitogen-activated protein kinase
mRNA messenger RNA
MSI2 musashi RNA binding protein 2
ng nanogram
NHEJ non-homologous end joining
nM nanomolar
NRG Neuroglian
Nucleic acid bases A adenosine, T thymine, G guanine, C cytosine and
U uracil
PCa prostate cancer
p-NP p-nitrophenol
p-NPP p-nitrophenylphosphate
PRAD prostate adenocarcinoma
Pre-mRNA pre-messenger RNA
PS phosphorothioate
PSI percent spliced in
PSM peptide spectrum match
PTBP1 polypyrimidine tract-binding protein 1
qPCR quantitative polymerase chain reaction
RBP RNA binding protein
RNAPII RNA polymerase II
RNA ribonucleic acid
RNA-seq RNA sequencing
RNPS1 RNA binding protein with serine rich domain 1
RPKM reads per kilobase transcript per million
SF3B4 splice factor 3b subunit 4
SFPQ Splicing factor proline and glutamine rich
siRNA small interfering RNA
Sm smith antigen
SMA Spinal muscular atrophy
smRNA small nuclear RNA
snRNP small nuclear ribonucleoprotein
SNW1 SNW domain containing 1
SR serine-arginine rich proteins
SR-A1 steroid receptor RNA activator 1
SRE splicing regulatory element
SRPK serine-arginine protein kinase
SRSF serine-arginine splice factor
SSO splice switching oligonucleotide
SXL Sex-lethal
T-ALL T-cell acute lymphoblastic leukaemia
TARBP1 transactivation response RNA-binding protein 1
TCGA The Cancer Genome Atlas
TCR T-cell receptor
UTR untranslated region
VDR vitamin D receptor
Wnt Wingless-related integration site
C
ONTENTS
1 Introduction ...21
1.1 Alternative splicing ...22
1.1.1 Prevalence of alternative splicing ... 24
1.1.2 Specificity and complexity of splicing ... 25
1.1.3 Splicing regulatory elements and proteins involved in splicing regulation ... 27
1.1.4 The splicing reaction ... 32
1.1.5 Alternative splicing and cancer ... 38
1.2 E26-transformation specific (ETS) family of transcription factors ...41
1.2.1 Transcription factors and gene expression ... 41
1.2.2 Structure and binding specificity of ETS transcription factors ... 43
1.2.3 Expression and biological function of ETS transcription factors ... 48
1.3 The ERG transcription factor ...50
1.3.1 Structure and isoforms ... 50
1.3.2 ERG and Cancer ... 53
1.3.3 Function of ERG ... 67
1.4 Aims of this Study ...72
2 Materials and Methods ...73
2.1.1 Cell counting and viability assessment ... 74
2.2 Cell treatments ...75
2.3 Designing and using splice switching oligonucleotides ...75
2.4 RNA extraction ...76
2.5 cDNA synthesis ...77
2.6 Standard PCR and Gel Electrophoresis ...78
2.7 Isolating and Sequencing PCR products ...79
2.8 Quantitative PCR ...79
2.9 RNAi high-throughput RT-PCR screen ...79
2.10 Protein isolation and preparation ...80
2.11 SDS-PAGE and Immunoblotting ...81
2.12 RNA Pull-Down ...81
2.13 siRNA knockdown of splice factors ...82
2.14 Resazurin cell viability assay ...83
2.15 Immunofluorescence analysis of Ki-67 ...84
2.16 Caspase 3/7 assay ...85
2.21 Bioinformatic analysis ...89
2.21.1 Databases used for expression analysis ... 89
2.21.2 Gene sequence annotation ... 89
2.21.3 Sequence alignments ... 90
2.21.4 Prediction of splicing regulatory elements ... 90
2.21.5 Splice factor binding prediction ... 90
2.22 Statistical Analysis ...90
3 Analysis of ERG exon 7b sequence and expression ...92
3.1 Introduction ...93
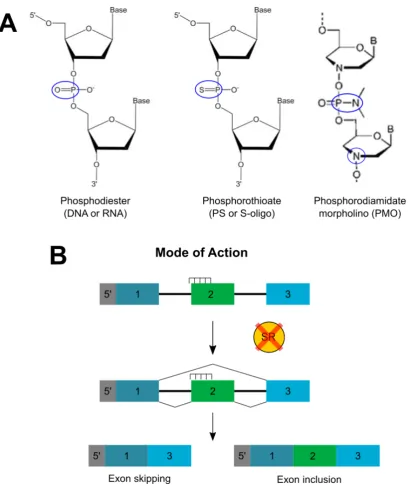
3.1.1 Modification of alternative splicing using splice switching oligonucleotides (SSOs) ... 98
3.2 ERG exon 7b is evolutionarily conserved in ERG orthologues ...104
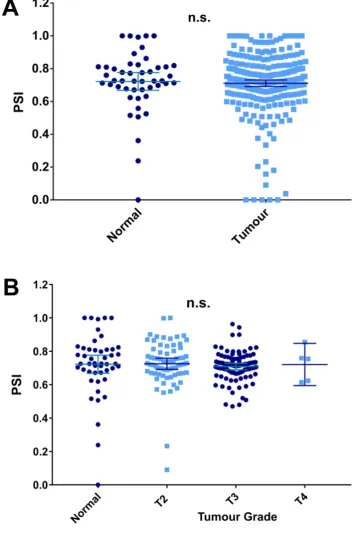
3.3 ERG exon 7b expression in prostate cancer ...115
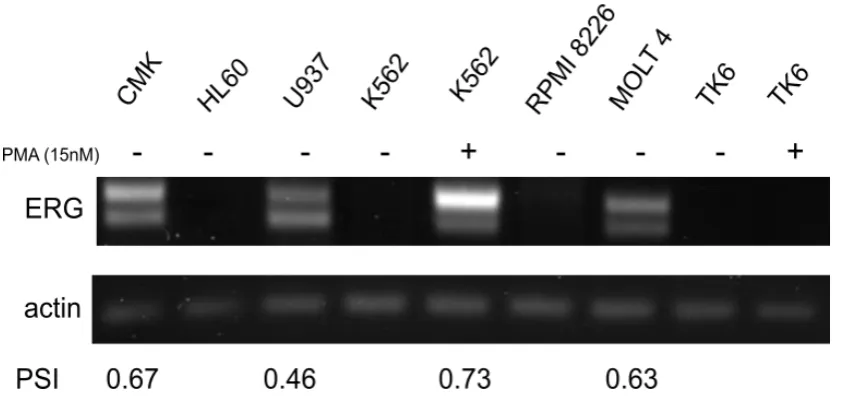
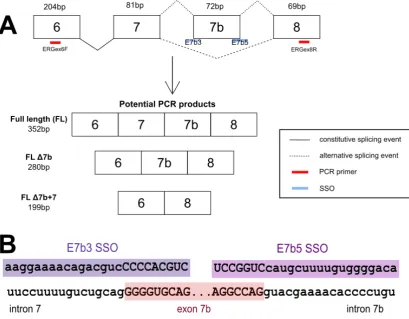
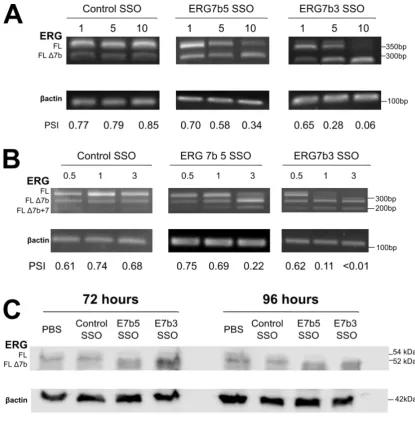
3.4 ERG exon 7b is alternatively spliced in several malignant cell lines 117 3.5 ERG exon 7b can be skipped with splice switching oligonucleotides (SSOs) targeted to the 5´ and 3´ splice sites ...121
3.6 Summary of findings ...125
4 Function of ERG exon 7b splice isoforms ...128
4.2 SSO-induced ERG exon 7b skipping alters cell growth in MG63 cells 131
4.3 SSO-induced ERG exon 7b skipping alters cell proliferation in MG63 cells 133
4.4 SSO-induced ERG exon 7b skipping induces apoptosis in MG63 cells 139
4.5 SSO-induced ERG exon 7b skipping alters cell migration in MG63 cells 143
4.6 SSO-induced ERG exon 7b skipping alters cell invasion in MG63 cell 145
5.4 Prediction of potential trans-acting splice factors that regulate exon 7b
splicing ...170
5.5 The knockdown of several RBPs significantly changes ERG exon 7b splicing in MCF7 cells ...174
5.6 Several proteins interact with the 3´ splice site of ERG exon 7b exon in vitro 176 5.7 Knockdown of PTBP1, SRSF5 and hnRNPF did not significantly alter ERG exon 7b splicing ...180
5.8 Summary of findings ...183
6 Discussion and Future Work ...186
6.1 Evolutionary conservation of ERG and its exon 7b...188
6.2 Role of ERG exon 7b in oncogenic processes ...190
6.3 Therapeutic potential of SSOs ...195
6.4 Role of exon 7b in osteoblast maturation ...197
6.5 Regulation of exon 7b inclusion ...200
6.6 Main conclusions ...203
6.7 Future Work ...205
7 References ...211
8 Appendices ...261
Sequences of primers used in this study ...262
Sequencing results for PCR products in this this study ...263
Normalisation and quantification procedure for qPCR ...264
PSI and ΔPSI values for high throughput RNAi experiment ...268
Proteins identified in mass spectrometry of RNA pull down ...270
Summary of splicing regulatory proteins identified in this study ...273
L
IST OF
T
ABLES
Table 1 Gene names and locations of the ETS transcription family (adapted from Yates et al., 2017) ... 45 Table 2 RBPs from mass spectrometry of RNA pull down of exon 7b acceptor
L
IST OF
F
IGURES
Figure 1.1 The splicing reaction ... Error! Bookmark not defined. Figure 1.2 The regulation and patterns of alternative splicing (adapted from Park
et al., 2018) ... Error! Bookmark not defined. Figure 1.3 Antisense oligonucleotide chemistry and mode of action ... Error!
Bookmark not defined.
Figure 1.4 The ETS transcription factor family (adapted from Wei et al., 2010 and Hollenhorst et al., 2011) ... 44 Figure 1.5 ERG: gene structure and isoforms ... 52 Figure 3.1 ERG expression in human tissues according to the Genotype-Tissue
Figure 3.10 Schematic of ERG exon 7b splicing pattern and SSO sequences used in this study ... 123 Figure 3.11 Titration of ERG exon 7b SSOs in MOLT4 and MG63 cells ... 124 Figure 4.1 Growth curve of MG63 cells treated with ERG exon 7b SSO ... 132 Figure 4.2 Proliferation index of PRAD patients from TCGA database ... 135 Figure 4.3 Proliferation of MG63 cells following SSO treatment ... 136 Figure 4.4 Ki-67 expression in MG63 cells following 72 hours of SSO
treatment ... 138 Figure 4.5 Caspase 3/7 expression following 48 hours of SSO treatment in
MG63 cells ... 141 Figure 4.6 Caspase 3/7 expression following 72 hours of SSO treatment in
MG63 cells ... 142 Figure 4.7 ERG exon 7b skipping causes reduction in MG63 cell migration 144 Figure 4.8 ERG exon 7b skipping causes reduction in MG63 cell invasion . 146 Figure 4.9 Growth of MG63 xenograft mouse model tumours treated with ERG
exon 7b SSO ... 148 Figure 4.10 TNSALP expression is attenuated after 48 hours of SSO induced
ERG exon 7b skipping in MG63 cells ... 151 Figure 4.11 TNSALP expression is attenuated after 72 hours of SSO induced
ERG exon 7b skipping in MG63 cells ... 152 Figure 4.12 TNSALP expression is attenuated after 96 hours of SSO induced
Figure 4.13 Expression of TNSALP, OPN and RUNX2 genes after 48h of 1,25D and FHBP co-treatment in the presence of SSOs. ... 156 Figure 4.14 ERG binds to the promoter of TNSALP ... 157 Figure 5.1 ERG exon 7b splice sites compared across metazoan species .. 166 Figure 5.2 ESE prediction analysis for ERG exon 7b ... 169 Figure 5.3 RBPs predicted to bind to ERG exon 7b and its flanking introns 172 Figure 5.4 Predicted SF and RBP regulators of ERG exon 7b alternative splicing ... 173 Figure 5.5 RNAi knockdown of RBPs change ERG exon 7b inclusion in MCF-7
cells ... 175 Figure 5.6 RNA pull down of ERG exon 7b acceptor site and surrounding
sequence ... 178 Figure 5.7 RNAi knockdown of SRSF5, hnRNPF and PTBP1 does not change
L
IST OF
A
PPENDICES
1.1 Alternative splicing
The information of almost all living organisms is stored as DNA (deoxyribonucleic acid), a very stable molecule. However, the expression of the genetic information held in DNA requires the synthesis (transcription) of a more unstable and dynamic molecule called RNA (ribonucleic acid). Similar to DNA in structure, RNA has a different base (uracil, U in place of thymine, T) and sugar backbone where the hydroxyl group is in the 2´ position making RNA more chemically reactive (Holley et al., 1965). DNA is transcribed into RNA and this can then be translated into proteins where necessary. This fascinating mechanism of molecular biology is the means by which our genetic information is expressed. We now know that one gene can produce several proteins and this is because RNA is not a straightforward copy of the DNA but rather it undergoes processing allowing for the production of different RNA molecules from the one gene.
together very precisely. However, further research revealed that alternative RNA transcripts can be made from a single processed primary transcript (Berget et al., 1978). This process of defining which sequences constitute the final RNA transcript is alternative splicing (AS).
1.1.1 Prevalence of alternative splicing
1.1.2 Specificity and complexity of splicing
The expression of isoforms is dependent on the conditions in and around the cell. This means some isoforms require external cues to be expressed or are only expressed during a certain developmental stage or in a specific tissue type. A number of Drosophila genes have been revealed to be tissue specific. The determination of sex requires the presence of Sex-lethal (SXL) and other slice factors (Penalva and Sánchez, 2003). ELAV-like protein 1 (ELAVL1) is a neuron-specific RBP that was identified as a regulator of Neuroglian (NRG) splicing, being required for the production of the neural specific isoform (Koushika, Lisbin and White, 1996).
1.1.3 Splicing regulatory elements and proteins involved in splicing
regulation
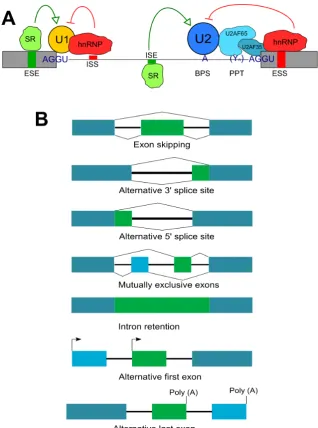
There are several modes of AS; exon skipping, mutually exclusive exons splicing, alternative usage of the 3´ and 5´ splice site and intron retention. The most common is exon skipping (Keren et al., 2010, Figure 1.2A). The mode of AS that occurs is influenced by the splicing regulatory elements (SREs) that exist within both intron and exon sequences. These and additional regulatory sequences can be referred to as cis-acting regulatory elements. They function to recruit splice factor (SF) proteins that may enhance or silence splicing. Hence the sequences are termed as follows: exonic splicing enhancers (ESEs), intronic splicing enhancers (ISEs), exonic splicing silencers (ESSs) and intronic splicing silencers (ISSs) (Lee and Donald C. Rio, 2015). As with splice site strength, bioinformatic tools have been developed to predict potential SREs and these tools can be informative for experimental validation (Fairbrother et al., 2004; Desmet et al., 2009).
Figure 1.1 The regulation and patterns of alternative splicing (adapted from Park et al., 2018)
ESEs close to splice site can encourage the binding of the U1 and U2AF snRNPs to their respective splice sites. When SR proteins are bound to an ESE they can recruit other splice factors that interact with the arginine and serine residue rich RS domain on the SR protein (Graveley, 2000). This generally increases exon inclusion. SR-depletion of splicing extracts showed that two SR proteins, SRSF1 and SRSF2 are required for pre-mRNA splicing, splice site selection and splice switching (Fu and Maniatis, 1990; Ge and Manley, 1990; Krainer, Conway and Kozak, 1990).
However, ESEs may have a wider ranging function in pre-mRNA splicing as they are expressed in constitutive exons (ones that are consistently conserved after splicing) as well as alternative ones. ISEs are equally important for enhancing splicing. The terminal exon in the Calcitonin gene has a conserved ISE that constitutes part of the sequence of a 5´ cryptic splice site facilitating the recognition of a 3´ splice site required for exon inclusion (Lou et al., 1995). Overall enhancer SREs are able to activate and define both alternative and constitutive exons as well as weak and strong splice site by appropriately recruiting SR proteins and other splice factors.
for producing RNA or DNA strands that bind a specific target ligand, and this method has been used to identify silencers. U1 binding to the 5´ss was shown to be altered by the presence of splicing silencers affecting splice site choice (Yu et al., 2008).
Whereas cis-acting element tend to either repress or enhance splicing, studies have revealed trans-acting proteins are actually able to perform both functions depending on the binding motif sequence and position of the binding site. An example of this is hnRNPL which was initially thought to only repress CD45 exon 4 splicing (House and Lynch, 2006) but has been shown to also enhance exon 4 and 5 inclusion by binding to weak splice sites (Motta-Mena, Heyd and Lynch, 2010). In addition the action of RBPs may involve interactions with snRNPs like U1 during spliceosome assembly and modulate their binding to the ss. PTBP1 represses splicing of the N1 exon in the proto-oncogene c-SRC through direct binding to U1 when it is part of the snRNP complex (Sharma et al., 2011).
1.1.3.1 Splicing, Transcription and RNA processing
1.1.4 The splicing reaction
snRNP binds across the branch point site (BPS) containing a conserved A flanked by a degenerate sequence (YNYURAY) (Query, Moore and Sharp, 1994).
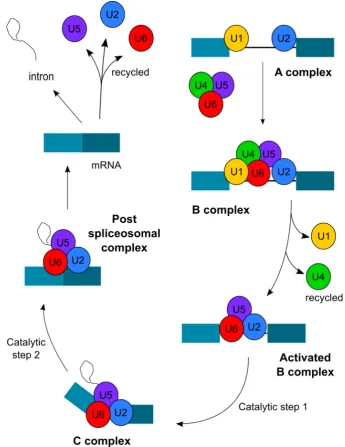
commonly via the U2 dependent spliceosome made up of U1, U2, U5 and U4/U6 snRNPs and other non snRNP proteins. A snRNP is a made up of a small nuclear RNA (snRNA) in close association with so-called smith antigen (Sm) proteins and other particle-specific proteins. There are seven Sm proteins, SmB/B’, SmD, SmE, SmF, SmG, SmN, of decreasing magnitude and they are named after Stephanie Smith, the lupus patient in whom they were first discovered (Séraphin, 1995).
Figure 1.2 The splicing reaction
1.1.4.1 Secondary RNA structure, chromatin modification and splicing
Changes in RNA-RNA binding caused by secondary structure and chromatin changes affect AS mechanisms. Even though RNA is single stranded it is able to form secondary and tertiary structures as a result of interactions between many hundreds of nucleotides within the molecule. The effect of the structure can be both enhancement and repression of splicing as SREs or splice site may be concealed.
An example of this is the splicing regulation of the exon 6 cluster in the Drosophila Downs syndrome cell adhesion molecule (DSCAM) gene which has over 38,000 alternative mRNA transcripts. The RNA molecule has a binding site and selector sequence in the exon 6 region. Each of the 48 mutually exclusive exons of the exon 6 cluster has a unique selector sequence and this can base pair with the docking site forming a secondary structure of 1,000-14,000 nucleotides in size. This interaction is responsible for driving the mutually exclusive exon pairing in the gene (Graveley, 2005).
1.1.5 Alternative splicing and cancer
We know that many human diseases have a genetic origin or contribution, therefore the process of AS which is so crucial to gene expression is an obvious process that may be a target of some of these mutations. Not only splice site but also SREs and other cis-acting elements have been shown to have disease associated mutations in them. Changes in these sequences can prevent splicing, recruit a different profile of trans-acting splicing regulators or activate cryptic splice sites. Furthermore, mutation in the genes that encode for the splicing machinery, RBPs and even transcriptional proteins all have potential to change AS patterns and contribute to disease. However in the case of trans-acting splicing factors the effects of mutations may be masked by functional redundancy. It has been evidenced that splice factors from the same family may have similar functions at the same motif (Barberan-Soler et al., 2011) or in the same tissue (Kuroyanagi et al., 2007). Therefore loss of function in a splice factor can be rescued by another splicing factor in the same family and is why there is a low prevalence of disease as a result of such mutations.
(Woolard et al., 2004). Identifying which splicing events produce these advantageous proteins is important but equally understanding how a splicing event is regulated can provide a potential diagnostic marker or therapeutic target (Le et al., 2015). A comprehensive study, using high throughput reverse transcription PCR, of 600 cancer-associated genes found 41 alternative splicing events that were differentially expressed in breast cancer tissues compared to normal tissues. These changes were associated with increased cell survival and proliferation and some events could be stratified according to tumour grade meaning they had potential as biomarkers (Venables et al., 2008).
1.2 E26-transformation specific (ETS) family of transcription
factors
1.2.1 Transcription factors and gene expression
Gene expression relies on the process of DNA transcription, in which DNA binding trans-factors better known as transcription factors play a regulatory role. By binding to DNA cis-elements such as enhancers (sequences that promote gene transcription), transcription factors can recruit co-factors and the transcriptional enzyme RNAPII and regulate the expression of the target gene (Ihn Lee and Young, 2013). A co-factor may activate or repress gene expression depending on whether a transcription factor regulates initiation or elongation of genes (Lelli, Slattery and Mann, 2012). In the case of transcription factors that regulate initiation co-activators are recruited with the P300 mediator complex (Malik and Roeder, 2010). Once RNAPII has begun transcribing the gene it will come to a pause 50 base pairs in, and whether it continues into elongation or terminates can be controlled by transcription factors (Adelman and Lis, 2012). The c-Myc transcription factor can stimulate positive transcription elongation factor b which restarts paused RNAPII via phosphorylation (Rahl et al., 2010; Luo et al., 2012).
Hochedlinger, 2011). Remodelling of the chromatin may be required to allow for gene activation and this can involve enzymes such as histone methylases, acetylases (Bannister and Kouzarides, 2011) and remodelling complexes such as the SWItch/Sucrose Non-Fermentable (SWI/SNF) family to allow transcription factors to bind their intended DNA target (Hargreaves and Crabtree, 2011). The crosstalk between chromatin structure and transcription factors adds an additional layer of complexity to the regulation of transcription. A gene can have a number of promoter elements with varying proximity to its target gene that can be bound by various transcription factors (Krivega and Dean, 2012). Each transcription factor can recognise and preferentially bind a set of binding motifs present in the promoter elements of a gene (Inukai, Kock and Bulyk, 2017). Moreover, every specific cell type will have a specific gene expression program dependent on the position, profile and number of transcription factors bound to the promoter and DNA sequence of a set of genes.
factors themselves can all contribute to the aberrant gene expression seen in diseases especially cancer.
1.2.2 Structure and binding specificity of ETS transcription factors
It must be acknowledged that many of the recognised oncogenes are actually transcription factors (Introna and Golay, 1999). The ETS transcription factor family is an example of oncogenic transcription factors involved in the pathogenesis of a number of human cancers. The ETS gene family is thought to have arisen from an ancestral gene duplication that pre-dates the emergence of chordates. Thus ETS members are present in both vertebrates and invertebrates (Seth et al., 1992) and found in species across the metazoan phyla (Degnan et al., 1993).
Figure 1.3 The ETS transcription factor family (adapted from Wei et al., 2010 and Hollenhorst et al., 2011)
Gene
Symbol Full Name Chromosome location
EHF ETS homologous factor 11p13
ELF1 E74 like ETS transcription factor 1 13q14.11
ELF2 E74 like ETS transcription factor 2 4q31.1
ELF3 E74 like ETS transcription factor 3 1q32.1
ELF4 E74 like ETS transcription factor 4 Xq26.1
ELF5 E74 like ETS transcription factor 5 11p13
ELK1 ETS-like transcription factor 1 Xp11.23
ELK3 ETS-like transcription factor 3 12q23.1
ELK4 ETS-like transcription factor 4 1q32.1
ERF ETS2 repressor factor 19q13.2
ERG ETS related gene 21q22.2
ETS1 v-ets erythroblastosis virus E26 oncogene homolog 1 11q24.3 ETS2 v-ets erythroblastosis virus E26 oncogene homolog 2 21q22.2 ETV1 ETS variant 1 7p21.2
ETV2 ETS variant 2 19q13.12
ETV3 ETS variant 3 1q23.1
ETV3L ETS variant 3 like 1q23.1
ETV4 ETS variant 4 17q21.31
ETV5 ETS variant 5 3q27.2
ETV6 ETS variant 6 12p13.2
ETV7 ETS variant 7 6p21.31
FEV Fifth Ewing variant 2q35
FLI1 Friend leukaemia virus integration 1 11q24.3
GABPA GA binding protein transcription factor subunit alpha 21q21.3 SPDEF SAM pointed domain-containing ETS transcription factor 6p21.31 SPIB Spleen focus forming virus proviral integration B 19q13.33
SPIC Spleen focus forming virus proviral integration C 12q23.2
[image:49.595.102.501.90.598.2]The structure of the ETS domain has been resolved using high resolution X-ray crystallography (Suwa et al., 2008) as well as NMR (Liang et al., 1994; Werner et al., 1997) and reveals an 85 amino acid helix-loop-helix structure of three alpha helices and four antiparallel beta sheets. The core recognition motif is GGA (A/T) (Karim et al., 1990). The sequence that flanks this core motif determines the binding specificity of each ETS transcription factor allowing for activation of specific gene targets (Seth et al., 1992; Donaldson et al., 1996; Shore et al., 1996). The two G residues interact with two conserved arginine residues found in the third alpha helix and a conserved tyrosine that interacts with the A base is also found in the same helix (Cooper et al., 2015).
1.2.3 Expression and biological function of ETS transcription factors
Generally ETS transcription factors are expressed in all tissues (Hollenhorst, Jones and Graves, 2004) and function as either transcriptional activators or repressors (Sharrocks et al., 1997). It is estimated that ETS binding sites are present in 25% of human promoters and although not all of them are necessarily functional, this proposes that the ETS family is important for regulating gene expression (Hollenhorst, McIntosh and Graves, 2011). Post-translational modifications of ETS proteins as effectors of signalling cascades modulate the proteins activity and can dictate whether the ETS transcription factor acts as an activator or repressor when it binds a promoter. For example, an ERK/MAPK phosphorylation site in the B box of TCF facilitates the formation of a complex with serum response factor that binds to serum responses elements in the Fos proto-oncogene, AP-1 transcription factor subunit (c-fos) promoter (Gille, Sharrocks and Shaw, 1992). The signalling pathway may also recruit transcriptional co-regulatory proteins. Auto-inhibition of ETS1 occurs when the protein is phosphorylated but this can be reversed with cooperation with Runt-related transcription factor 1 (RUNX1) which relieves the inhibition at specific sites (Hollenhorst, McIntosh and Graves, 2011).
1.3 The ERG transcription factor
1.3.1 Structure and isoforms
The ERG gene (ETS-related gene, also v-ets avian erythroblastosis virus E26 oncogene homolog) was discovered in 1987 while investigating human oncogene homologues that belong to the ETS (erythroblast transformation specific) family of transcription factors. The ETS domain is a highly conserved DNA-binding domain present in ERG and other ETS family members (Watson et al., 1985). The 1987 study screened a human complementary DNA (cDNA) library derived from COLO320 cells (derived from colorectal adenocarcinoma) with a probe comprising the conserved ETS domain from the E26 virus known to cause erythroblastoid leukaemia in chicken (Reddy et al., 1987).
The ERG gene is located on chromosome 21 and is 300kb in size. When ERG was first discovered two mRNA transcripts were identified; these were named erg 1 and erg 2 producing a 41kDa and 52kDa polypeptide respectively (Rao et al. 1987). Two studies have sought to annotate ERG isoforms and now it is predicted that there are around 30 isoforms, although not all of them encode functional proteins, with 16 splice isoforms currently characterised (Owczarek et al. 2004; Zammarchi et al. 2013). The main open reading frame produces an mRNA transcript of 18 exons and encodes for a full length protein 486 amino acids long with a mass of 54.6kDa (Zammarchi et al. 2013; Owczarek et al. 2004).
splice isoforms. There are also other cassette exons such as exon 7 but these are less commonly spliced (Zammarchi et al. 2013). It is not surprising that ERG is so thoroughly alternatively spliced considering its complex biological roles. The existence of so many isoforms can contribute to imparting a certain level of specificity as well as diversity to the transcriptional functions of ERG.
The ERG protein can form homodimers and heterodimers with FLI-1, ETS2 and SPI1 ETS transcription factors and this is aided by the pointed domain (Carrère et al., 1998). In addition to the ETS and pointed domains, ERG also has two transcriptional activation domains - one located in between the pointedand ETS domain (AD) and another in the C-terminus of the protein (cAD). Both the AD and cAD encourage the binding of proteins to increase ERG transcriptional activation (Siddique et al., 1993). Therefore, whereas the role of the ETS domain is to localise ERG, the AD is there to recruit and interact with transcriptional machinery.
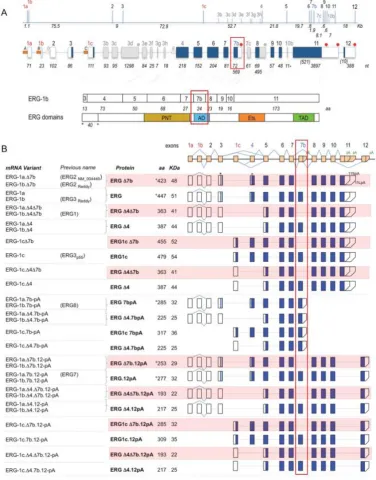
Figure 1.4 ERG: gene structure and isoforms (© Zammarchi et al., 2013)
A. Top: The ∼300 Kb human ERG locus, roughly to scale with intron and exon (bars) sizes
in Kb are shown. Red: first exons; blue: common alternative ones and grey uncommon ones. Middle: Exon structure, with exon sizes at the bottom. Blue boxes indicate the main predicted ORFs, white boxes the untranslated regions and grey the uncommon exons. Red circles indicate polyA sites. Bottom: alignment of the exons (7b in the red box) forming the main ORF (ERG-1b) with the protein’s domains. Numbers indicate size in amino acids. PNT = pointed domain, AD = alternative domain, Ets = Ets domain, TAD = transactivation domain. Asterisk and circle indicate position of the first and second ATG. B. Human ERG
1.3.2 ERG and Cancer
Cancer can be described as uncontrollable growth of cells and although this is true in part there are other key features that cells must develop to give them oncogenic properties. Loss of senescence, evasion of growth control signals and apoptosis, epithelial-mesenchymal transition (EMT) facilitating cell motility and angiogenesis are all additional attributes of cancerous development. Hanahan and Weinberg (2011) ascribe ten “biological capabilities” (originally six) to the stepwise progressive development of cancer. More recent evidence suggests that cell metabolism can be reprogrammed to better fuel tumorigenesis. Moreover, cells are able to evade detection and destruction by the immune system.
1.3.2.1 Ewing’s sarcoma
Ewing’s sarcoma, commonly afflicting children and adolescents, is a group of bone cancers with neurogenic origin and is characterised by undifferentiated small round cells (Ozaki, 2015). It is named after Dr James Ewing who first described it in the early 20th century (Ewing, 1921). When present in the bone
the main sites of malignancy are ribs, pelvis and femur however tumours can also develop in other sites such as the back and lower leg. Survival varies but worsens if metastases are present with a slightly reduced estimated 5 year survival of 58% in such cases compared to 68% overall (Ozaki, 2015). The pathogenesis of the malignancy has been linked to the formation of chromosomal rearrangements that result in the production of oncogenic fusion proteins that drive tumorigenic transformation in the tissue (Lessnick and Ladanyi, 2012). As the development of the disease is significantly linked to the chromosomal translocations present they pose a clear potential therapy target. As a result, much effort has been put into identifying and characterising the molecular landscape of Ewing sarcoma.
interacts with RNAPII and transcription factors (Bertolotti et al., 1998; Cantile et al., 2013). The protein is therefore thought to act as a bridge between gene transcription and splicing. EWS also has important roles as an RNA and nucleic acid binding protein facilitated by the RNA binding domains and the RGG domain that favour polyU and polyG nucleic acid sequences.
6-(Lin et al., 1999). Fusion variants that have been described for are EWS-ERG 7/6, EWS-ERG 7/8, EWS-ERG 7/9 and EWS-ERG 10/6 (Zucman et al., 1993). Although the EWS-ERG fusion has not been as well characterised as EWS-FLI, the oncogenic ability of EWS-ERG has been confirmed by several studies. The transcriptional activity of ERG is maintained and in combination with the conserved transactivation domain of EWS, it is thought the fusion protein functions as a dysfunctional transcription factor. The altered activation of downstream target genes contributes to the oncogenic activity of EWS-ERG in Ewing sarcoma. The structural similarities would support the hypothesis that both fusions have very similar functions. Indeed a study confirmed this assumption by comparing EWS-FLI1 and EWS-ERG patients and found no significant differences in their clinical statistics, disease, progression or survival (Ginsberg et al., 1999). The transformative potential of EWS-ERG was further evidenced by the colony forming ability of the fibroblast-derived cell line NIH3T3 although no tumours were made in a xenograft mouse model (Braunreiter et al., 2006).
EWS-ERG also involves interaction with RNAPII (Matsui et al., 2003). Lamin β-3 encodes for a chain in the lamin 5 glycoprotein which is involved in cell migration, differentiation and adhesion. ASO repression of EWS-ERG resulted in reduced transcription of lamin β-3 providing a possible target that may drive oncogenic cell development.
1.3.2.2 Haematological cancers
A role for ERG in the regulation of normal haematopoiesis is well established, as it was found that homozygous mutant ERG mice did not survive past E13.5. Furthermore, one of the characteristics of heterozygous mice was decreased levels of less committed progenitor cells. Eventually ERG was shown to be critical to the regulation of haematopoietic stem cell maintenance (Loughran et al., 2008). This is supported by the observation that endothelial stem cell differentiation is similarly dependent on ERG activity (Nikolova-Krstevski et al., 2009). In addition to its regulation of haematopoiesis ERG is an oncogene in several haematological malignancies (Salek-Ardakani et al., 2009; Adamo and Ladomery, 2015).
promoters and enhancers is diminished. It was further found that the fusion protein interacts with and alters the activity of a heptad of transcription factors consisting of ERG, TAL1/SCL, GATA2, LYL1, LMO2, RUNX1 and FLI1 (Sotoca et al. 2015). Overexpression of ERG is one markers used for the classification of a specific complex AML karyotype (Marcucci et al. 2005). Therefore, the regulation of the transcriptional activity of ERG is an important contributor to AML and possibly other leukaemia.
Another translocation t(X;21)(q25–26;q22) fusing the N-terminus of the ETS transcription factor E74 Like ETS Transcription Factor 4 (ELF4) to the C-terminus of ERG was reported in an AML patient. Exon 2 of ELF4 fuses to exon 2 of ERG mean the majority of the protein sequence in this fusion is attributed to ERG. Therefore it was suggested that its function would likely be similar to native ERG and as of yet no other AML cases have been reported to harbour this mutation (Moore et al., 2006).
trisomy 21 associated AMKL and since different ETS transcription factors can work cooperatively this may be an additional way to enhance megakaryopoiesis and AMKL development (Sumarsono et al., 1996; Stankiewicz and Crispino, 2009).
In addition to this ERG overexpression has been observed in T-cell acute lymphoblastic leukaemia (T-ALL) and was associated with poor relapse free survival (Baldus et al., 2006). This overexpression profile has been linked to the leukaemia-specific and transient use of the +85 enhancer in the ERG promoter, and the transcription factor heptad associated with FUS-ERG was shown to bind as well (Thoms et al., 2011). At a protein level several serine phosphorylation sites were found on ERG in both AML and T-ALL cells. However, one site S283 stood out as it was phosphorylated significantly more than other haematopoietic cells and it was shown to promote use of the +85 enhancer and increase cell proliferation. The phosphorylation at S283 is mediated by ERK which activates the RAS/MAPK signalling pathway and required a DEF domain located in exon 7b (Y. Huang et al., 2016).
change in transactivation of ERG that this splicing event leads to (Bohne et al., 2009).
1.3.2.3 Prostate cancer
The discovery of the TMPRSS2-ERG fusion gene, found in a remarkable proportion i.e. 50% of PCa cases, was reported by Tomlins et al. (2005). The TMPRSS2-ERG fusion gene occurs as a consequence of an interstitial deletion or translocation between ERG and the transmembrane protease serine 2 (TMPRSS2) gene, which is found in three megabases (Mb) upstream of ERG and encodes for an androgen responsive serine protease (Tomlins et al., 2005). The mutation combines the promoter of TMPRSS2 and the coding region of ERG leading to the androgen responsive production of an ERG protein (Clark et al., 2007).
disease (J. Wang et al., 2008; Rickman et al., 2010; Wu et al., 2013; Tian et al., 2014).
C-X-C Motif Chemokine Receptor 4 (CXCR4), a chemoreceptor whose chemokine is stromal cell derived factor 1 (SDF1), is transcriptionally activated by ERG and mediates increased cell invasion and metastasis specifically to bone tissue (Singareddy et al., 2013). Invasiveness is also promoted via the involvement of ERG with matrix metalloproteases and WNT- signalling (Butticè et al., 1996; Brase et al., 2011; Wu et al., 2013). Moreover ERG affects EMT by promoting the loss of VE-cadherin and epigenetic regulation of migration via histone deacetylase 6 (Mohamed et al., 2011; Birdsey et al., 2012).
In addition to this it has been suggested that the loss of phosphatase and tensin homologue (PTEN), which is associated with Protein kinase B (called AKT) overexpression, may play a role in the initiation of PCa. PTEN is a tumour suppressor gene that supresses AKT under normal physiology and is very frequently mutated in human cancers. AKT is part of a signalling pathway that promotes cell survival and proliferation (Carver et al., 2009; Squire, 2009). Several studies suggest that the concomitant loss of PTEN and the presence of TMPRSS2-ERG are also associated with PCa progression, aggressive disease and a poor prognosis (Carver et al., 2009; Leinonen et al., 2013; Barbieri et al., 2013; Figure 2). This may be because ERG may repress PTEN when bound to its promoter (Adamo et al., 2017).
true when the N terminus of EWS was fused to ERG but a EWS interaction domain in the C terminus of ERG was also validated, which when mutated, reduced cell migration and colony formation ability. The interaction between the two proteins was shown to be required for transcriptional activity. Furthermore, when EWS was knocked down or the EWS interaction domain in ERG was mutated, there was a significant reduction in transcription of target genes. This data would suggest the EWS is a crucial co-activator of ETS transcription factors including ERG target genes (Kedage et al., 2016).
Contrastingly other large cohort investigations have found no significant correlation between TMPRRS2-ERG and poor prognosis or disease progression. Gopalan et al. (2009) found that although TMPRSS2-ERG positive patients did overexpress ERG, the fusion gene was associated with low grade tumours and there was no association with outcome. They also suggested that associations with poor outcome may be due to general aneuploidy often found in cancer patients. Another study looked at the histological pathology of prostate tumour samples expressing TMPRSS2-ERG and found that samples positive for the rearrangement had a lower Gleason score in comparison to those without (Fine et al., 2010). Therefore, there is some debate as to whether the gene rearrangement can be used as a diagnostic or prognostic marker.
recent estimates show that there are nearly 20 TMPRSS2-ERG variants (Clark et al., 2007; Zammarchi, Boutsalis and Cartegni, 2013). The most common variant is a hybrid of exon 1 of TMPRSS2 and exon 4 of ERG often referred to as T1:E4 (Clark et al., 2007). The protein product of each variant is either type I ERG, a near full length product with the ETS domain, or the truncated protein lacking the ETS domain known as type II ERG (Clark et al., 2007; Rastogi et al., 2014).
Interestingly Hagen et al. (2011) examined the expression of exon 7 and 7b in PCa patient samples. The splice isoform ratios of exon 7 and exon 7b inclusion and exclusion were compared in benign tissues, T2 localised tumours and stage T3a and T3b cancer tumour and, advanced stage tumours. The study reported that both exon 7 and 7b are increasingly included as disease progresses (Hagen et al. 2014). As previously detailed, studies using prostate cancer cell lines identified more oncogenic behaviour in ERG splice variants that included this 72 base pair exon which encodes part of the AD (J. Wang et al., 2008; Yin et al., 2011) and may therefore encourage the transcription of pro-tumorigenic genes.
1.3.3 Function of ERG
Compared to other ETS transcription factors ERG is highly expressed in endothelial cells, and significant research has revealed the several important roles that ERG supports in endothelial development and function (Baltzinger, Mager-Heckel and Remy, 1999; Hollenhorst, Jones and Graves, 2004; Nikolova-Krstevski et al., 2009). As the mouse embryo develops, endothelial cells, haematopoietic and cartilage tissue all express ERG (Mohamed et al., 2010). In humans other tissue that express ERG include chondrocytes (Iwamoto et al., 2000), both B and T lymphocytes, myeloid cells and megakaryocytes (Rainis et al., 2005). ERG is generally a nuclear protein but the ERG8 isoform was shown to localise to the cytosol (Hoesel et al., 2016).
1.3.3.1 ERG as an activator and repressor of transcription
In an in vivo mouse model for haematopoiesis ERG was shown to be a positive regulator of the RUNX1 and GATA2 genes. The expression of both genes was downregulated when functional ERG was knocked down and ERG was observed to occupy enhancer sequences in the promoters of both genes in foetal liver where expression of these genes was high. This regulatory pathway was shown to be vital to maintaining haematopoietic stem cells and thus embryonic development (Taoudi et al., 2011).
at the promoter as a result of this binding (Birdsey et al., 2008). Further research revealed that ERG-dependent regulation of VE-cadherin affects vascular stability, that is the control of endothelial cell cytoskeleton and junction integrity, and angiogenesis through the canonical Wingless-related integration site (Wnt) signalling pathway (Birdsey et al., 2015).
Leukocyte recruitment and adhesion is important in inflammatory disease and has been shown to be influenced by the expression of intercellular adhesion molecule 1 (ICAM-1) and vascular cell adhesion molecule (VCAM) as well as the cytokine interleukin-8 (IL-8). ERG directly binds to the ICAM-1 promoter and represses gene transcription suggesting an anti-inflammatory role for ERG. Repressed expression of IL-8 and VCAM was also observed. This was shown to be the case in vivo using a murine model where inflammation was induced by causing swelling the paws of mice. Normally tumour necrosis factor α (TNFα) stimulates inflammation and upregulates ICAM-1 gene expression. However when ERG was overexpressed inflammation was reduced in a TNFα – dependent manner (Sperone et al., 2010).
1.3.3.2 Function of ERG exon 7b isoforms
Although both studies identified the 72 bp exon, one called it exon 12 (Owczarek) whilst the other called it exon 7b (Zammarchi, Boutsalis and Cartegni, 2013). In this study the Zammarchi et al. naming system will be used. However, studies use variable naming systems and where a different one is used clarification will be made.
In chicken there are two main isoforms of ERG, chERG that when expressed includes all three exons in the 222 base pair (bp) variable region (these exon are exon 7 (81 bp), exon 7b (72 bp) and exon 8 (69 bp)). The other main isoform is C-1-1 which lacks exon 7. This variant has been cloned and characterised across several organisms (Baltzinger et al. 1999). In developing epiphyseal chondrocytes of chicks, the C-1-1 variant is preferentially expressed, and overexpression of this variant imparts stabilizing and anti-maturation abilities to the cells when compared to chERG (Iwamoto et al. 2000).
and suggest that ERG may be a potential target for the development of new anti-arthritic intervention development therapies.
To better understand the biological role of the various splice isoforms of TMPRSS2-ERG expression a study by Wang et al. (2008) transiently expressed several TMPRSS2-ERG transcripts in PNT1a prostatic epithelial cells which do not normally express ERG. They particularly focussed on exon 7b (denoted 72bp for this in the study) and found that the VCaP cell line expressed the type III isoform of TMPRSS2-ERG (exon 1 of TMPRSS2 bound fused to exon 4 of ERG) +/- exon 7b. Their finding showed that inclusion of exon 7b increased proliferation, increased invasive ability invasion (as assessed by the Matrigel assay), and increased motility (assessed using the wound healing assay). Although they were able to confirm that all isoforms can form heterodimers and homodimers, the isoforms including exon 7b bound significantly more protein suggesting that this the exon imparts an increased potential for exhibited stronger protein-protein interactions (Wang et al. 2008).
1.4 Aims of this Study
The aim of this study was to gain an understanding of the biological function of the ERG exon 7b splice isoforms and how the inclusion of this exon is regulated. The rationale for focusing on this cassette exon was based on the literature that indicates that its inclusion makes ERG more oncogenic. Exon 7b adds, in frame, 24 amino-acids to the transactivation domain a crucial part of ERG that influences its interactions and transcriptional activity. Presumably this splicing event leads to the selective expression of the full transactivation domain and is a specific mechanism for altering ERG activity. To explore this hypothesis, the project will used splice switching oligonucleotides to reduce exon 7b inclusion and therefore ablate the expression of the full transactivation domain isoforms of ERG. Upon successful achievement of exon skipping a series of functional assays were performed to characterise the oncogenic potential of the isoforms expressed in the cell model.
2 Materials and
2.1 Cell Lines
MOLT4 (obtained from ECACC, Public Health England), CMK, TK6 and K562 (kindly provided by Dr Ruth Morse) cells were grown in RPMI media supplemented with 10% foetal bovine serum (FBS) and 4mM L-glutamine at 37°C, 5% CO2 in a humidified incubator. Cells were sub-cultured every 2-3 days.
MG63 cells (kindly provided by Dr Jason Mansell) were grown in DMEM supplemented with 10% FBS at 37°C, 5% CO2 in a humidified incubator and sub-cultured every 3- 4 days. Where serum starvation was required cells were cultured in DMEM:F12 supplemented with essential amino acids.
2.1.1 Cell counting and viability assessment
Cells were counted using a haemocytometer using the Trypan Blue exclusion assay to determine viability. A 10μL aliquot of cell suspension was diluted 1:1, 1:3, 1:5 or 1:10 depending on cell confluence with 0.4% Trypan Blue and loaded into the haemocytometer. The haemocytometer was observed on a light microscope using a x10 objective. Dead cells appeared blue as they took up the trypan blue dye whereas viable cells appeared bright and unstained. Viable cells and total cells were counted and viability was determined using the following equation:
% 𝑣𝑖𝑎𝑏𝑖𝑙𝑖𝑡𝑦 =(𝑛𝑢𝑚𝑏𝑒𝑟 𝑜𝑓 𝑣𝑖𝑎𝑏𝑙𝑒 𝑐𝑒𝑙𝑙𝑠)
2.2 Cell treatments
Phorbol myristate acetate (PMA) is a highly potent activator of protein kinase C. Changes in the downstream signalling pathways has been observed to increase the expression of several transcription factors. K562 and TK6 cells, which do not ordinarily express ERG, were treated with 15nM PMA for 72 hours to assess if the expression of ERG could be induced. All experiments also included a dimethyl sulfoxide (DMSO) control for which cells were treated with 0.5% DMSO as this was the maximum amount of DMSO ever used for each experiment.
2.3 Designing and using splice switching oligonucleotides
2.4 RNA extraction
Total RNA was extracted using the Absolutely RNA Miniprep Kit (Agilent Limited) according to the manufacturer’s protocol. Samples were DNase treated on-column using kit provided RNase-free DNase I.
For samples containing less than 500,000 cells RNA was extracted using the genesig easy DNA/RNA extraction kit (Primerdesign) and DNase treatment was performed with the Precision DNase kit (Primerdesign) according to manufacturer protocols.
RNA preparation for quantitative PCR was carried out using a phenol chloroform based method as follows. Cells were lysed in lysis buffer (0.1 M Tris pH 8.0, 5 mM EDTA pH 8.0, 0.1 M NaCl, 0.5% sodium dodecyl sulfate (SDS), 1% β 2-mercaptoethanol was added just before use) and homogenised using a 21-23 gauge needle and syringe. An equal volume of UltraPure™ Phenol:Chloroform:Isoamyl Alcohol (25:24:1, v/v) (Thermofisher) was added to each sample. Samples were vortexed thoroughly and spun at maximum speed on a bench top centrifuge (13,000 x g) for 5 minutes. The aqueous phase was removed and put into a fresh tube. An equal volume of chloroform was added to the sample which was then vortexed and incubated at room temperature for 2-3 minutes. The samples were then centrifuged at 12,000 x g for 15 minutes at 4°C. This process was repeated.
overnight to precipitate the RNA pellet. The samples were then centrifuged at 12,000 x g for 30 minutes at 4°C. The RNA pellet was washed in ice cold ethanol, excess ethanol was aspirated and then the pellet was left to air dry. Pellets were resuspended in nuclease-free water. To remove gDNA contamination an appropriate volume of 10x DNase reaction buffer and 2U of DNase I (New England Biolabs, NEB) was added to the sample which was then incubated at 37°C for 10 minutes. To deactivate the DNase EDTA to a final concentration of 5mM was added and the sample was incubated at 75°C for 10 minutes.
All RNA samples were quantified using a Nanodrop 2000 (Thermofisher) and aliquots were made prior to cDNA synthesis and storage at -80°C.
2.5 cDNA synthesis
transcribed using 30U T3 RNA polymerase with 50U RNase inhibitor, rNTP mix (2 mM final concentration), 10 μL 5x transcription buffer made up to a 50 μL reaction volume with nuclease-free water. The reaction was incubated at 37°C overnight before the in vitro transcribed RNA was purified using the phenol: chloroform method described above. The RNA was DNase treated, further purified using the phenol: chloroform method, quantified using the Nanodrop 2000 and the final concentration was adjusted to make 10 μL aliquots with 1μg of RNA in each. These were stored at -80°C.
2.6 Standard PCR and Gel Electrophoresis
Hot Start Taq 2X master mix (NEB) was used for standard PCR reactions to determine gene expression. Reactions were set up at room temperature with 1-2μL undiluted cDNA template and had a final reaction volume of 25 µL. The sequences for the primers in the appendix. The annealing temperature was calculated using the NEB Tm calculator (available on https://tmcalculator.neb.com/#!/main). The final concentration for each primer in the reaction was 0.4µM. PCRs were run as follows: initial denaturation 95°C for 30 seconds, then 30-40 cycles of 95°C for 30 seconds, the annealing temperature for 1 minute, 68°C for 1 minute and a final extension at 68°C for 5 minutes. The PCR samples were stored a 4°C until they could be run on an agarose gel.
Lite software (Licor, available from https://www.licor.com/bio/products/ software/ image_studio _lite/). The percent spliced in (PSI) was calculated by
𝑃𝑆𝐼 =𝑠𝑖𝑔𝑛𝑎𝑙 𝑓𝑜𝑟 𝑠𝑝𝑙𝑖𝑐𝑒 𝑖𝑠𝑜𝑓𝑜𝑟𝑚 𝑜𝑓 𝑖𝑛𝑡𝑒𝑟𝑒𝑠𝑡 𝑡𝑜𝑡𝑎𝑙 𝑠𝑖𝑔𝑛𝑎𝑙 𝑓𝑜𝑟 𝑎𝑙𝑙 𝑠𝑝𝑙𝑖𝑐𝑒 𝑖𝑠𝑜𝑓𝑜𝑟𝑚𝑠 × 1
2.7 Isolating and Sequencing PCR products
PCR bands were excised under UV light. The QIAquick Gel Extraction kit (Qiagen) was used to purify the PCR products for sequencing according to the manufacturer’s protocol. Samples were sent to Eurofins Genomic Service for sequencing. The sequencing results for ERG can be found in the appendix.
2.8 Quantitative PCR
of RNA binding protein knockdowns. This assay amplifies full length and exon 7b skipped ERG isoforms using cDNA from 56 RNA binding protein siRNA knockdowns that have been carried out in MCF-7 cells. A lipofectamine transfection reagent control (siCTRL) was included for each set of knockdowns. The analysis of alternative splicing was determined using endpoint PCR coupled with microcapillary electrophoresis. PSIs were then calculated and the change in PSI (PSI) was determined by the following formula:
ΔPSI = 𝑃𝑆𝐼 𝑠𝑖𝑅𝑁𝐴
𝑃𝑆𝐼 𝑠𝑖𝐶𝑇𝑅𝐿 × 1
PSI and calculated ΔPSI values for all 56 siCTRL and siRNA MCF7 cell samples tested are included in the appendix. Any PSI values with no useable control or an error were not included in analyses.
2.10 Protein isolation and preparation
Cells were washed twice with ice-cold PBS, and whole cell protein lysates were prepared using an appropriate volume of RIPA buffer (10 mM Tris-Cl (pH 8.0), 1 mM EDTA, 1% Triton X-100, 0.1% sodium deoxycholate, 0.1% SDS and 140 mM NaCl) supplemented with protease inhibitor tablets (ThermoFisher). After a 30 minute incubation, with periodical vortexing, lysates were centrifuged for 15 min at 12,000 x g at 4°C for clarification. Samples were transferred to fresh tubes and quantified using the bicinchoninic acid (BCA) kit (Thermofisher) and a bovine serum albumin protein standard curve.
on ice for 30 minutes. This was followed by centrifugation and the leftover pellet (the nuclear fraction) was sonicated in a nuclear lysis buffer. The lysate was quantified using the BCA kit, aliquoted and stored at -80°C.
2.11 SDS-PAGE and Immunoblotting
Immunoblotting was carried out using 10 to 20μg of total cell lysate. Samples were added to 2x Laemelli Sample Buffer and heated for 5 minutes at 100 °C. Proteins were separated by hand cast SDS-polyacrylamide gel electrophoresis (PAGE) or TruPAGE™ Precast Gels and electro-transferred to polyvinylidene difluoride (PVDF) membrane (Thermofisher). The membranes were blocked for
1 hour at room temperature using 5% skimmed milk powder made in Tris-buffered saline with 0.1% Tween-20 (TBST) then probed with primary antibodies against target proteins diluted in TBS-T overnight at 4 °C. The
following antibodies used in this study: ERG (1:500-1000, ab92513), anti-beta-actin (1:10,000, ab8229), both antibodies were from Abcam. Following three TBST washes the membranes were then incubated with an appropriate
RNA oligonucleotide corresponding to the 3´ splice site of ERG exon 7b (gucuuuccuuuugucugcagGGGGUGCAGCUUUUAUUUUC, -20 to 20; ThermoFisher) was ligated with desthiobiotinylated cytidine bisphosphate at the 3' end and then purified by ethanol precipitation. Subsequently, labelled RNA was bound to streptavidin magnetic beads at room temperature followed by incubation with 100 μg MOLT4 nuclear extract at 4 °C for 2 hours with agitation. After incubation, the magnetic beads were washed three times with wash buffer (20 mM Tris (pH 7.5), 10 mM NaCl, 0.1% Tween-20) and the bound proteins were eluted using biotin elution buffer. Bound proteins were separated by SDS-PAGE and visualised by coomassie blue staining. Following imaging of gels, bands were excised using sterile scalpels and sent off for trypsin digestion prior to mass spectrometry analysis (Proteomics Facility, University of Bristol). The list of proteins identified using mass spectrometry can be found in the appendix.
2.13 siRNA knockdown of splice factors
RNAi was used to knockdown protein levels for candidate splice factors to establish if they have a role in regulating the expression of ERG exon 7b. MG63 cells (5 x 10⁵ in 500 µL per well) were seeded in DMEM media without serum
wise and the plate was gently swirled. After 4.5 hours of incubation at 37°C 1mL of complete DMEM media was added. After 24 hours cells were sub-cultured into T-25 flasks for a further 24 hours at which point RNA and protein were isolated from the cells.
2.14 Resazurin cell viability assay
The conversion of resazurin is carried out by enzymes in viable cells and can be measured colorimetrically. The activity of the metabolic enzymes within the cells allow for the assessment of both cell viability and proliferation. A 10mg/mL stock solution of resazurin was used to make a fresh working stock at 0.04mg/mL concentration every two weeks. All stocks were made in PBS. The resazurin reagent was added 1:10v/v to cells treated wells as well as to negative control wells (made up to the equivalent of the media volume) 2-4 hours prior to the end of the experimental incubation period in order to assess cell viability. The plates were then read at 570nm and 630nm in a plate reader (FLUOstar OPTIMA, BMG Labtech) to obtain readings for cell viability determination. The following equation was used to determine the percentage reduction of resazurin to resofurin.
% reduction of resazurin =(Eoxi630 × A570) – (Eoxi570 × A630)
(Ered570 × C630) – (Ered630 × C570)× 100
Ered570 = E of reduced resazurin reagent at 570nm = 155677
C630 = absorbance of negative control well (media, resazurin reagent, no cells) at 630nm
Ered630 = E of reduced resazurin reagent at 630nm = 5494
C570 = absorbance of negative control well at 570nm
The percentage viability was determined by correcting the other percentage reductions against the media only or PBS treated cells which were considered to be 100% viable.
2.15 Immunofluorescence analysis of Ki-67
the using the 20x objective on the Eclipse 80i microscope (Nikon). An image using the Texas red fluorescent filter and the 4′,6-diamidino-2-phenylindole (DAPI) filter setting were taken for each field of view.
2.16 Caspase 3/7 assay
The process of apoptosis has two main pathways; the intrinsic and extrinsic pathway. These pathways converge at the activation of effector caspases which are a type of protease (Lamkanfi and Kanneganti, 2010). Measurement of the activity of caspase 3 and 7 allows reveals cells that are committed to the final events of the apoptotic process as the cleavage of substrates by caspase 3 and 7 initiates key structural and biochemical changes cell.
After seeding in 6 well plates, MG63 cells were treated with SSOs or PBS for 48 hours and 72 hours and 45 minutes prior to the end of the incubation period the Cell Event Caspase 3/7 reagent made in pre-warmed PBS was added to cells. Images of 6 fields of view per treatment were taken using the 20x objective on the Eclipse 80i microscope. An image using the green fluorescein isothiocyanate (FITC) fluorescent filter and the phase contrast setting were taken for each field of view.
2.17 Transwell invasion and migration assay
For the invasion assay polyethylene terephthalate inserts (membrane pore size, 8 μm; Millipore) were coated with 50uL of Geltrex® Matrix (ThermoFisher) diluted 1:1 in serum-free medium for at least 2 hours and up to 24 hours to create an artificial basement membrane to facilitate cell invasion. Uncoated inserts were used for the migration assay. Inserts were set up in 24 well plates for both migration and invasion assays. MG63 cells were treated with SSOs or PBS for 24 hours and then were harvested. Subsequently 1 × 10⁵ cells in 100
μL serum-free medium was added to the upper chamber of the insert with (invasion) or without (migration) Geltrex® Matrix and 600 μL of medium supplemented with 10% FBS was added to the lower chamber of a 24-per well. Following 24 hours of culture at 37 °C, the cells remaining on the upper membrane of the insert were removed and inserts were washed in PBS. After 15 minutes fixation in methanol and 2 minutes staining with haematoxylin the inserts were air dried prior to imaging of six representative fields of view using a camera attached to a light microscope (x20 objective). The number of cells adhering to the lower membrane of the inserts was counted. All experiments were carried out in triplicate.
2.18 Alkaline Phosphatase assay
lysophosphatidic acid (LPA), (3S)1-fluoro-3-hydroxy-4-(oleoyloxy)butyl-1-phosphonate (FHBP) and calcitriol, the active metabolite of vitamin D3 (1,25D), were added to the relevant wells as well as an additional dose of SSO to maintain the expression of ERG exon 7b skipped isoforms. Following another 24 hour incubation resazurin reagent was added to treated wells as well as to empty control wells 2-4 hours prior to the end of the incubation period in order to assess cell viability. The plates were then analysed to obtain readings for cell viability determination.
Chromatin Immunoprecipitation Kit (Sigma, UK) according to the manufacturer’s protocol. Briefly, 1x10⁶ MG63 cells were incubated for 10
minutes with 1% formaldehyde at room temperature to allow DNA to be cross-linked to the protein. Cells were then lysed and DNA sheared to produce fragments of about 1000bp using a sonicator six pulses for 15 seconds at 50% power output followed by incub