A Comparison of Data Collection
Methods for Spatial Analysis
Scope
This report looks at three methods for capturing the geometry of buildings and
their elements to be used in the generation of energy models of those
buildings. A heritage building in Salford, UK, is used as a case study, receiving
each data collection method. Energy models developed based upon data
collected for this building is analysed for variations in geometry and
predictions of energy performance.
Aims
The aims of this report are as follows:
1.
To provide a basic introduction to the processes involved in data
collection using:
a.
A measured building survey.
b.
Laser scanning.
c.
Aerial Photogrammetry.
2.
To demonstrate, through the use of a case study, the process of building
energy models using collected data from each method.
Table of Contents
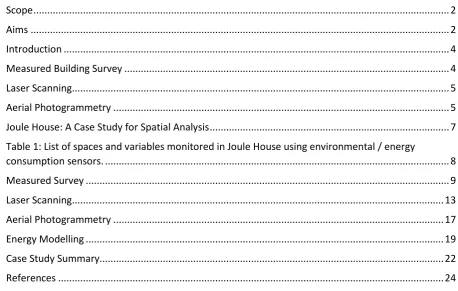
Scope ... 2
Aims ... 2
Introduction ... 4
Measured Building Survey ... 4
Laser Scanning... 5
Aerial Photogrammetry ... 5
[image:3.595.66.525.111.402.2]Joule House: A Case Study for Spatial Analysis ... 7
Table 1: List of spaces and variables monitored in Joule House using environmental / energy consumption sensors. ... 8
Measured Survey ... 9
Laser Scanning... 13
Aerial Photogrammetry ... 17
Energy Modelling ... 19
Case Study Summary... 22
Introduction
The ability to accurately capture a building’s geometry and its features is important in the process of developing energy models for predictions of energy performance. In terms of HBIM, it is even more important to be able to capture a building’s current physical condition given that significant changes may have occurred since its conception. Being able to monitor the change of a building’s fabric over time is also key to recognising the impact of climate change on heritage buildings – the core theme of this HBIM project.
Measured Building Survey
Measured surveys can be made up of a combination of three types of survey: topographic, building and underground utility (RICS, 2014). The measured building survey is the focus of this document. RICS (2014) give a checklist for the surveyor to follow, beginning with an indication of survey accuracy, the required outputs from the survey, and the components making up the survey itself. The checklist is broken into the following categories:
- Accuracy Band - Survey Output
- Building Survey Features - Structure - Fitting Out
- Heights / Levels Annotation - Services
- Roofs
- Internal Roof Spaces and Ceiling Voids - External Features
- Areas and Dimensions - Cross-Section Features - Elevations Features
Each category and sub category are listed with suggested details (e.g. doors, windows, columns and beams in the structure category).
Accuracy bands are dependent on the level of detail in the survey and is attached to a plot scale for the final output. RICS surveying document sets out a table of bands with examples for varying degrees of accuracy. The highest accuracy offered is ±2mm, used for “high accuracy engineering setting out and fabrication surveys”. The lowest accuracy is given as ±1000mm and is used for “Low accuracy route/corridor planning surveys” and “large area GIS asset mapping”. The scale of drawings range from 1:5 at the most accurate level to 1:5000 at the lowest accuracy. Accuracy bands apply to both plan and height details.
Surveyors are advised to predetermine the output requirements of their client, with the main outputs of building surveys being:
- Drawings
- Wireframe Model - Surface Model - Solid Model - BIM
- Point Clouds
By understanding the client’s requirements, surveyors can better decide upon the details to capture within the survey. The surveyor also decides upon which deliverable type should be used to present their outputs (e.g. CAD in *.dxf, point clouds in *.LAS and BIM in *.rvt). While providing extensive lists of details to capture, the RICS checklist is meant to be informative, not exhaustive.
Laser Scanning
There are many applications of laser scanning: civil engineering; defining mechanical, electrical and plumbing components; construction management; and for scanning indoor environments, where in each case, the application of laser scanning has varying rates of success (Balado et al., 2018; Bosche et al., 2015; Tang et al., 2010; and Yoon et al., 2015).
Laser scanning can also be used to capture the facades of buildings, to be used for spatial analysis (Previtali et al., 2014). To capture the facades of a whole building, several scans of the same building are required at different locations. Careful planning is required to ensure each of these locations permits the capture of required data. Obstructions, surface conditions and weather conditions should all be planned in advance to reduce the risk of insufficiency.
A test scan is always recommended to ensure the correct settings are being used for the overall laser scanning method. This is to gauge the properties of each scan in terms of data quantity, data quality and time taken to complete the scan. High quality data collection tends to be intensive on the quantity of data and the time taken to collect it; this has significant impact on the cost of projects. The larger the building being scanned, the more beneficial it is to lower the quality of the scan. Scans are completed in two parts. First a laser performs a scan around the scanner, a camera then takes images in the same field. A point cloud and a series of images are stored for each scan. Once the full set of scans are completed, they can be processed into a 3D model.
The post-capture process of point clouds and images from the laser scan of a building begins with the combination of point clouds. Software is available to carry out this procedure automatically or manually, which involves the visual alignment of individual point clouds on the horizontal and vertical plane. Pairs of point clouds are aligned successively until all clouds overlap. An automatic process reduces the distance between similar points to reduce the error in the alignment. Once this has been carried out, the captured images from each scan can be attached at relevant points within the cloud to generate a 3D mesh.
Aerial Photogrammetry
Photogrammetry is described as a way to derive geometric information of an object from
2012; Golparvar-Fard et al., 2009 & 2014). Aerial photogrammetry in this case however, considers the use of UAVs (drones) in capturing images of a building for the purpose of spatial analysis. Limitations apply to aerial photogrammetry in terms of legislation on the activities of UAVs and drones. Restrictions to safe altitudes and an inability to fly over built up areas, despite training, are examples of barriers imposed by outdated legislation (Clarke, 2017). Where flight is permitted however, this data collection method can prove to be extremely beneficial for building surveying; the method is less time and cost intensive than both measured surveys and laser scans.
Capturing images for photogrammetry can be a simple, streamlined process lasting less than an hour, depending on the size and complexity of the building being surveyed. Due to the restrictions on drone activity, careful planning is necessary to avoid any complications. It is beneficial to conduct flights as early as possible to reduce the possibility of individuals within the flight area. Calm weather conditions also promote efficiency in the process.
During the flight, images are captured at timed intervals. The time between these intervals will determine the number of overall images that can be used post-capture. For complex buildings and to capture greater quality for detail, a more frequent image capture is recommended, however for basic structures with no significant detail to the facades a lower frequency can be used. A flight path over the surveyed building determines the angles at which images are taken. Linear sweeps are often used, with a final orbit around the building. The altitude of the flight will determine the angle at which the images are taken and will impact slightly on the post-capture processing of the images. Once the capture is complete, the images can be processed using photogrammetry software. Photogrammetry involves three main stages: aerotriangulation, point cloud generation and 3D mesh generation.
Aerotriangulation is similar to the alignment of point clouds in laser scanning. Individual images are examined for similarities, such as corners of walls, doors, windows etc. Pairs of images with similar features are used to determine the position of the camera as it took those images. Common points are also linked between the pairs of images. Successive pairs are processed, resulting in a 3D grid of camera positions and linked points.
The linked points from aerotriangulation assists in the extrapolation of further points within each image. The process is repeated to form a larger point cloud, which contains data points around the external façade of captured objects across the entire captured area.
Joule House: A Case Study for Spatial Analysis
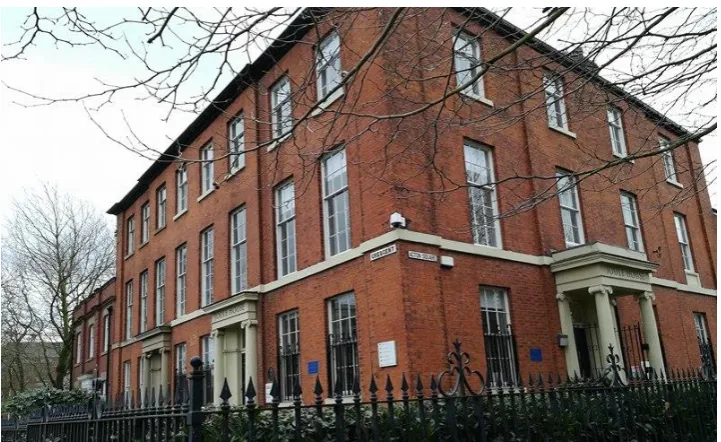
[image:7.595.118.479.230.451.2]Joule House is a three storey early 19th century building situated in Salford, UK. The solid brick outer envelope of the building is adorned with numerous fifteen and twelve-pane sash windows, Ionic door cases, Welsh roof slate, and an excess of intricate features. The building’s initial function was residential and was home to the famous scientist James Prescott Joule (1819 – 1854). During his occupation, Joule conducted a number of significant experiments in the basement of the building. Joule House was given listed Grade II status in 1952. Figure 1 shows the north and east facades.
Figure 1: Joule House situated in Salford, UK.
Joule House was originally constructed as two individual homes, but has since been converted into a single unit, currently functioning as offices for the University of Salford. An additional two-storey structure has also been added to the rear of the building. Since 2016, the building has been used as a case study for the investigation of climate change impact on heritage buildings. Included in this investigation was the collection of data concerning the building’s physical condition, environmental condition and energy performance.
To obtain the physical condition of the building, three methods of data collection were applied: a measured survey, laser scanning and an aerial photogrammetry. Energy models were generated using a spatial analysis of those data.
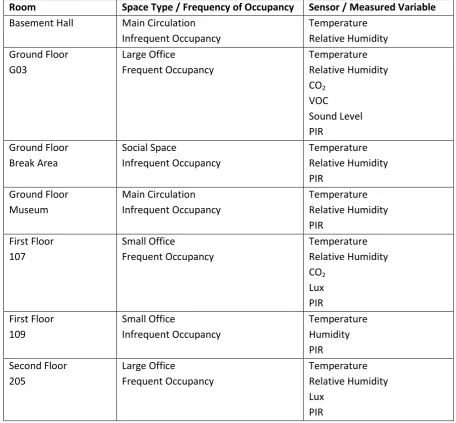
A network of sensors were installed in parallel to record the evolution of environmental conditions and energy use within Joule House during that time. Measured internal conditions included air temperature, relative humidity, PIR (passive infrared for occupancy), CO2 concentration, lux, sound
with less frequent occupancy, such as the museum, storage areas and social spaces. Pulse meters were also placed to measure the consumption of gas and electricity within the building. Table 1 lists the spaces and conditions monitored in those spaces.
Room Space Type / Frequency of Occupancy Sensor / Measured Variable
[image:8.595.63.520.152.575.2]Basement Hall Main Circulation Infrequent Occupancy Temperature Relative Humidity Ground Floor G03 Large Office Frequent Occupancy Temperature Relative Humidity CO2 VOC Sound Level PIR Ground Floor Break Area Social Space Infrequent Occupancy Temperature Relative Humidity PIR Ground Floor Museum Main Circulation Infrequent Occupancy Temperature Relative Humidity PIR First Floor 107 Small Office Frequent Occupancy Temperature Relative Humidity CO2 Lux PIR First Floor 109 Small Office Infrequent Occupancy Temperature Humidity PIR Second Floor 205 Large Office Frequent Occupancy Temperature Relative Humidity Lux PIR
Table 1: List of spaces and variables monitored in Joule House using environmental / energy consumption sensors.
Measured Survey
A measured building survey was carried out on Joule House by a chartered building surveyor. All drawings were done to a 1:50 scale, indicating accuracy band D in both plan and height, with an accuracy of ±10mm on all dimensions.
The outputs required from the measured building survey were floor plan and roof plan drawings, cross sections and elevations, and a 3D solid model; all of these outputs were combined into a single BIM file and exported in Revit.
The following details were recorded during the survey: - Structure
- Beams - Ceilings - Columns - Doors - Floors - Stairs - Walls - Windows - Fitting Out
- Partitions - Uneven Floors - Height / Level Annotation
- Floor Levels - Roofs
- Chimney Outline - Fire Escape - External Features
- Gardens
- Perimeter Hedge / Fence - Areas and Dimensions
- Room Areas - Cross-Section Features
- Principal Heights - Elevation Features
- Principal Heights
- Floor Level Indication with Broken Lines
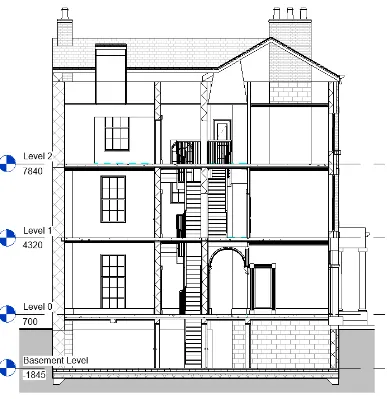
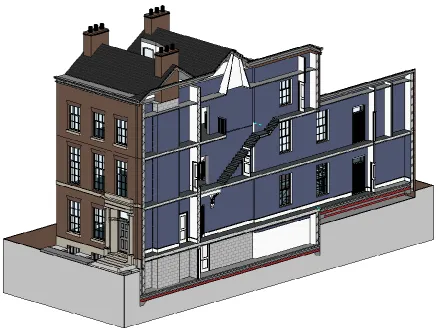
Figure 3: Cross-section of the Joule House BIM model.
Floorplans for each level of Joule House were exported as a *.dxf file and imported into
Figure 4: Tracing the floorplans of a building survey to create geometry in Designbuilder.
Laser Scanning
Scanning was carried out using a Leica C10 Scan Station. In preparation for the scan, the grounds of Joule House were first reviewed so that an appropriate number of scans could be taken to
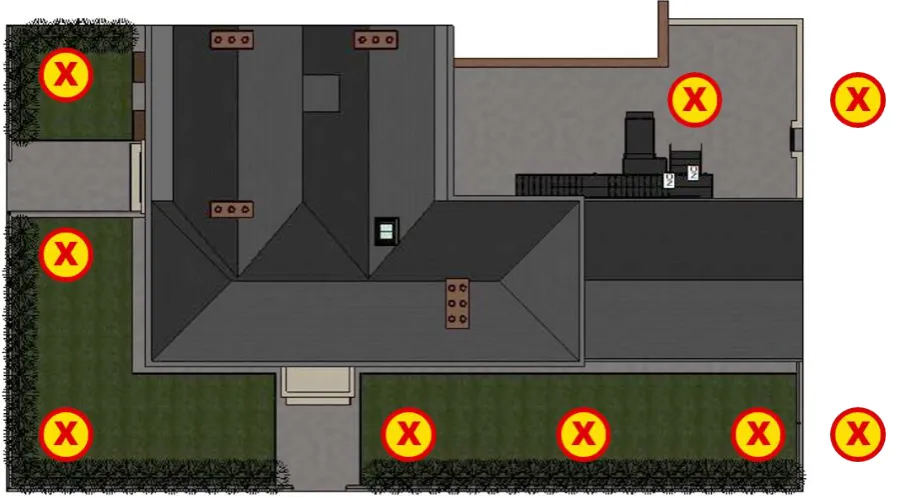
[image:13.595.78.527.182.431.2]incorporate as much of the external envelope as possible. Nine locations, as indicated in figure 5, were chosen to achieve this.
Figure 5: Scan Station locations during the laser scan of Joule House.
Due to the quantity of data collected in each scan, a conscious effort was made to maximise the area captured during the scan, while minimising the overall number of data to be processed. This bears in mind the fact that each scan collects 360o of data around the scan station, meaning only a
proportion of that scan is relevant. Processing these data would consider all data points and images, and so large quantities of data from a large number of scans would increase the computational intensiveness of the procedure.
The same quantity of data was captured with each scan, lasting just under 10 minutes each on a medium level scan, the resolution details of which are given in table 2.
Resolution Parameter Specification
Horizontal x Vertical Points Per Scan 6282 x 2356 Horizontal x Vertical Pixels Per Scan 960 x 960
Each scan exists as an individual set of points and images. The post-capture process of all scans involves the combination of scans, the generation of a single point cloud and the generation of a resultant 3D mesh, from which the geometry for energy models can be taken. Leica’s own software, Cyclone, was used to accomplish this.
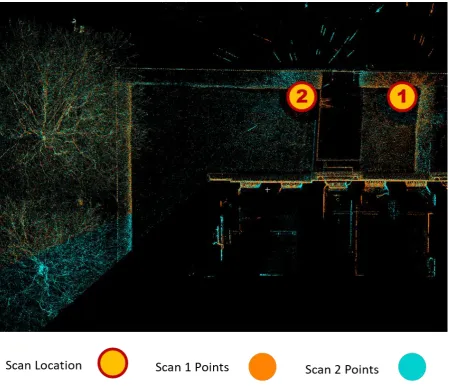
The process of combining scans involved the alignment of scan pairs on the vertical and horizontal plane. To align scans, common points, lines and objects were sought in each so that similar scan points could be placed as close to each other as possible. This was performed 8 times for each pair of scans out of the total 9 scans. Figure 6 shows the horizontal alignment of a pair of scans
[image:14.595.75.526.259.648.2]performed to the North face of Joule House, note the additional information in the scan present outside the grounds.
Figure 6: Procedure of combining a pair of point clouds for Joule House.
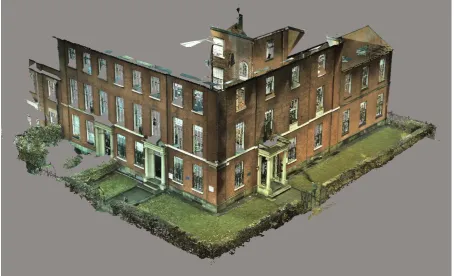
Figure 7: 3D mesh generated from 9 scans of Joule House.
The geometry of the building was taken from this 3D model in order to build Joule House in
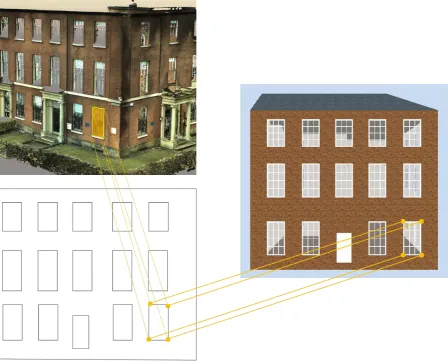
Figure 8: Process of measuring geometry of details from the Joule House point cloud model for the
generation of an energy model in Designbuilder.
Aerial Photogrammetry
Aerial photogrammetry of Joule House was carried out using a DJI Inspire 2 drone. High definition images (4K) were captured at intervals of 10s during the 15 minute survey, which used a
[image:17.595.109.490.161.459.2]combination of linear sweeps, with a final circular orbit as shown in figure 9.
Figure 9: Path taken by drone during aerial photogrammetry of Joule House.
The collection of images obtained from aerial photogrammetry were compiled in software capable of performing photogrammetry – Context Capture. Photogrammetry is a multi-stage process that takes groups of related images and generates a 3D mesh of objects contained within those images, in this case Joule House.
Figure 10: 3D mesh of Joule House generated from aerial photogrammetry.
As the aerial photogrammetry is conducted from up to 120m from the ground, the roof of Joule House has been captured in detail, a feature not found in the laser scan. The consequence of this however is that flight obstruction due to the presence of trees has caused some distortion of the mesh. The east façade of Joule House demonstrates this quite well, where an abundance of trees has caused the windows and door of that façade to become blurred. This becomes problematic when geometric measurements are made of this mesh to be used in generating an energy model. The same process of physically measuring building and detail geometry, and creation of a *.dxf for import into Designbuilder was followed as described for laser scanning.
Energy Modelling
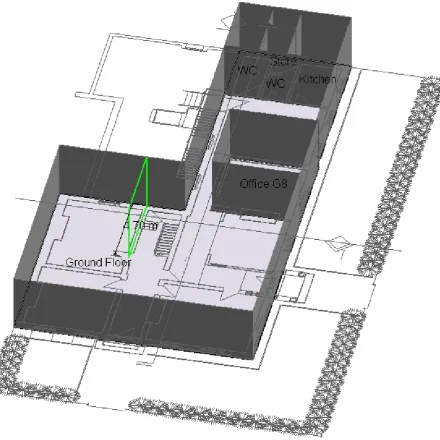
[image:19.595.66.524.206.467.2]Energy models were generated using the geometry available from each of the methods of data collection: a measured survey, laser scanning and aerial photogrammetry. For laser scanning and aerial photogrammetry methods, a single zone was modelled given that the external elements of the building were the only measured parts in each process. The measured survey however, allowed for greater complexity of the model, with each room modelled individually. Figure 11 shows the floor plan for each model at ground floor level.
Figure 11: Comparison of ground floor level floor plans of each energy model of Joule House.
The model generated from the measured survey has the benefit of increased complexity – and so the possibility of clearly defining the individual spaces within the entire building. However, with that increase in complexity comes an increase in uncertainty with the definition of each room.
While appearing similar in floorplan, the models generated using laser scanning and aerial photogrammetry methods demonstrate variations in their geometry, specifically in the assumed roof geometry of laser scanning.
Parameter Condition Reference
Occupancy (Office) Occupied from 07:00 to 19:00 on weekdays.
UK NCM (NCM, 2008).
Heating (Office) Heated from 05:00 to 19:00 on weekdays.
UK NCM (NCM, 2008).
Outer Wall Composition 420mm Solid Brick Wall 13mm Internal Plastering.
Measured Survey
Roof Composition 38mm Slate
25mm felt
100mm insulation 150mm trusses.
Measured Survey
Heating System Auto-sized gas central heating system.
-
Weather Salford, UK Measured on-site.
Adjacent Building Assumed occupied – adiabatic adjacent surfaces.
-
[image:20.595.66.518.70.417.2]Infiltration Not modelled Unknown
Table 3: List of assumptions for Joule House.
A building’s geometry, in particular the features of the outer envelope of that building, are instrumental in determining energy performance. The following properties are significant in understanding where variation in models between each data collection method can arise and the potential impact on energy balance in each case:
Internal air volume: Impacts the energy required to heat the building.
External wall surface area: Impacts the energy loss through walls of the building envelope. Roof surface area: Impacts energy loss through the roof.
Window area: Impacts energy loss through windows.
Design heating capacity: The ideal capacity of the heating system.
Parameter Measured Survey Model
Laser Scanning
Model
Aerial
Photogrammetry
Model
Internal Air Volume (m3) 2677 2376 2387
External Surface Area (m2) 884 678 686
Roof Surface Area (m2) 311 290 283
Window Area (m2) 106 109 107
[image:21.595.65.520.72.237.2]Design Heating Capacity (kW) 34.5 30.6 30.9
Table 4: Energy model parameters for each data collection method.
Table 4 shows significant variation in the measured building survey model compared to the other models. This is a result of those other data collection methods being limited to above-ground measurements. The additional internal volume and external surface area found in the measured building survey model comes from the basement of Joule House.
[image:21.595.79.525.443.613.2]The component of heat flow through external walls was observed to be higher due to the additional surface area given by the basement. Figure 12 shows the composition of steady state heat loss from Joule House and the proportionality of each in relation to the overall predicted heat loss.
Figure 12: Heat loss composition of Joule House for each data collection method.
Although the heat flow through external walls is significantly higher for the measured building survey model, components of heat loss through the roof and through glazing are also higher. This resulted in the proportionality between each heat loss component being maintained in each case. Although there is a similarity here, the design heating capacity is considerably higher for the
to the increased surface area found in this model as opposed to the observed variations in window or roof area. This is despite the fact that the basement of Joule House is largely unoccupied. The ability to capture subterranean structures has shown to be crucial in predicting the energy performance of a building; in the case of Joule House, a difference of 11% is observed. This presents a substantial weakness of data capture methods using laser scanning or aerial photogrammetry, where subterranean structures are present.
Each data collection method used for the spatial analysis of Joule House offered unique strengths and weaknesses, summarised in table 5.
Data Collection Method Strength Weakness
Measured Survey Internal geometry was captured.
Individual spaces could be parameterised.
Survey was time intensive. Survey / modelling was cost intensive.
Laser Scanning Faster data collection method than a measured survey. Relatively cheap processing of collected data.
Scanning equipment was expensive.
Size of data collection limited the detail captured.
Ground level data capture only – roof geometry not captured.
Aerial Photogrammetry Fastest data collection method.
Relatively inexpensive equipment.
Vastly inexpensive method of data collection / processing.
Restricted by legislation (no possibility for surveying in built up areas).
[image:22.595.66.519.238.584.2]Definition lost where obstacles interfered with data capture.
Table 5: Strengths and weaknesses of data collection methods for spatial analysis of Joule House.
Case Study Summary
It was possible to extract similar values for the roof and window surface area in each model, with a maximum variation of 4%. A major difference is found however, when looking at the internal air volume and external wall surface area determined for the measured building survey. A variation of up to 13% is found the instance of the external wall surface area. Given that this type of building element dominates heat loss from the building, it is a significant discrepancy. The discrepancy is found in the inability of laser scanning and aerial photogrammetry to investigate subterranean structures (the basement).
The proportionality of heat loss through external walls, the roof and windows remains similar for each data collection method, but a significant discrepancy is observed in the models’ ability to predict the energy performance of Joule House. Models created using laser scanning and aerial photogrammetry observe an 11% lower prediction of the design heating capacity than for that using the measured building survey. It is expected that this discrepancy will introduce variance and inaccuracy when model parameters are used in the dynamic simulation of Joule House. Future work is planned to investigate the variation in dynamic predictions of energy performance using a
comparison with in-situ measured data.
References
Ahmed, M., Haas, C., and Haas, R., (2011). Toward low-cost 3D automatic pavement distress surveying: the close-range photogrammetry approach, Can. J. Civ. Eng. 38 (12) 1301–1313. Ahmed, M., Haas, C., and Haas, R., (2012) Using digital photogrammetry for pipe-works progress tracking. Canadian Journal for Civil Engineering Special Issue Construction Engineering Management 39 (9) 1062–1071.
Balado, J., Diaz-Vilarino, L., Arias, P. and Gonzalez-Jorge, H. (2018) Automatic classification of urban ground elements from mobile laser scanning data. Automation in Construction, 86: 226-239, 2018 Bosche, F., Ahmed, M., Turkan, Y., Haas, C.T. and Haas, R. (2015) The value of integrating scan-to-BIM and scan-vs-scan-to-BIM techniques for construction monitoring using laser scanning and scan-to-BIM: the case of cylindrical MEP components. Automation in Construction, 49: 201-213, 2015
Clarke, J., 2017. The effectiveness of implementing unmanned aerial vehicles to survey
buildings. Journal of Building Survey, Appraisal & Valuation, 6(2), pp.158-170.Golparvar-Fard, M., Pena-Mora, F. and Savarese, S. (2009) Application of D4AR — a 4-Dimensional augmented reality model for automating construction progress monitoring data collection, processing and
communication. Journal of Information Technology in Construction. 14: 129–153.
Golparvar-Fard, M., Pena-Mora, F. and Savarese, S. (2014) Automated progress monitoring using unordered daily construction photographs and IFC-based building information models. ASCE Journal of Computing in Civil Engineering. http://dx.doi.org/10.1061/(ASCE)CP.1943-5487.0000205.
Klein, L., Li, N. and Becerik-Gerber, B. (2012) Imaged-based verification of as-built documentation of operational buildings, Automation in Construction 21: 161–171,
http://dx.doi.org/10.1016/j.autcon.2011.05.023
Previtali, M., Barazzetti, L., Brumana, R., Cuca, B., Oreni, B., Roncoroni, F. and Scaioni, M. (2014) Automatic façade modelling using point cloud data for energy-efficient retrofitting, Appl. Geomatics 6: 95–113, http://dx.doi.org/10.1007/s12518-014-0129-9.
RICS, 2014. Measured Surveys of Land, Buildings and Utilities, 3rd Edition. Royal Institute of Chartered Surveyors, London.
Tang, P., Huber, D., Akinci, B., Lipman, R. and Lytle, A. (2010) Automatic reconstruction of as-built building information models from laser-scanned point clouds: a review of related techniques, Automation in Construction 19 (7) 829–843