Reading
EFFECTIVE TEACHING
AND LEARNING
Published by the National Research and Development Centre for Adult Literacy and Numeracy
This document is also available in pdf and text-only format from the NRDC's website, www.nrdc.org.uk
For information on alternative formats, please contact:
Emily Brewer
Marketing and Publications Officer Institute of Education
University of London Tel: 020 7911 5501 Email: [email protected]
We welcome feedback on the content and accessibility of this publication. This should be sent to:
Publications NRDC
Institute of Education 20 Bedford Way London WC1H 0AL
Telephone: +44 (0)20 7612 6476 Fax: +44 (0)20 7612 6671 email: [email protected]
ISBN 1-905188-30-7
© Crown Copyright 2007
Extracts from this publication may be used or reproduced for non-commercial, research, teaching or training purposes on condition that the source is acknowledged.
NRDC is a consortium of partners led by the Institute of Education, University of London (see back cover for a list of members) and is part of the Bedford Group for Lifecourse and Statistical Studies at the IoE. www.ioe.ac.uk/bedfordgroup
Reading
EFFECTIVE TEACHING
AND LEARNING
RESEARCH TEAM
Greg Brooks, Maxine Burton, Pam Cole, Marcin Szczerbin´ski
SERIES EDITOR John Vorhaus
CONTENTS
ACKNOWLEDGEMENTS 5
PREFACE 6
1 EXECUTIVE SUMMARY 7
1.1 The Effective Practice Studies 7
1.2 The reading study 7
1.3 Main findings 8
1.4 Recommendations 10
1.5 Limitations to this research 12
2 CONTEXT 13
2.1 The policy background 13
2.2 The Effective Practice Studies 13
2.3 Features of this study 14
2.4 Aims 14
2.5 Scope 14
2.6 Literature review 14
2.7 Brief account of method 16
2.8 Structure of this report 19
3 LOCAL CHARACTERISTICS – THE PROVIDERS AND SETTINGS 20
3.1 The providers 20
3.2 The settings 20
3.3 Single-purpose and integrated classes 20
4 THE LEARNERS AND THEIR EXPERIENCE 21
4.1 The learners 21
4.2 Note on ethnicity, nationality and language 21
4.3 The learners’ previous experience of provision 23
4.4 Learners’ voices 23
4.5 Learners with learning difficulties or disabilities 25 4.6 Returners, drop-outs and the representativeness of the retained sample 25
5 LEARNERS’ PROGRESS 27
5.1 Learners’ achievement of accreditation, and progression to further study 27
5.3 Did progress in reading depend on initial reading level? 28
5.4 Error analysis 29
5.5 Exploring individual differences in changes in reading attainment 29 5.6 Findings from the attitudes questionnaire and correlations between
reading attainment and learners’ attitudes 30
5.7 Were changes in reading attainment related to amount of self-study
between sessions? 32
5.8 Attendance 32
5.9 Summary 33
6 TEACHERS’ PRACTICE 35
6.1 Teachers’ profiles 35
6.2 The teachers’ concerns 39
6.3 Issues arising from consultations 41
6.4 Classroom organisation 42
6.5 Groupings 44
6.6 Patterns of classroom activity 2003/04 and their implications 45
6.7 Patterns of classroom activity 2004/05 46
6.8 General teaching strategies and opportunities for learner involvement 46
6.9 Specific teaching strategies 47
6.10 A case study of a class of adult learners with Down syndrome 48
6.11 What was notseen? 49
6.12 Summary 50
7 TEACHING AND LEARNING 51
7.1 Teachers’ profiles and changes in reading scores 51
7.2 Availability of assistance in the classroom and changes in
reading scores 51
7.3 Class groupings and changes in reading scores 51
7.4 Patterns of activity in class and changes in reading scores and attitudes 52 7.5 General teaching strategies and opportunities for learner involvement,
and changes in reading scores 52
7.6 Specific teaching strategies and changes in reading scores 53
7.7 Summary 53
8 INSIGHTS FROM THE PRACTITIONER-RESEARCHERS 54
8.1 Origin and topics of the individual analyses 54
8.2 Teachers’ perceptions of learners’ progress, and the impact of the core
curriculum on the nature of this assessment 54
8.3 Writing which supports reading 55
8.4 Observed use of ICT 58
8.5 Benefits to the practitioner-researchers’ professional development 61
8.6 Conclusion 65
9 SUMMARY OF FINDINGS AND RECOMMENDATIONS 66
9.1 Findings 66
9.2 Recommendations 68
9.3 Limitations to this research 70
Acknowledgements
Project team
All University of Sheffield
All School of Education except Marcin Szczerbin´ski
Professor Greg Brooks, project director Dr Maxine Burton, research fellow Pam Cole, research fellow
Jacquie Gillott, project secretary
Dr Sam Roberts, assistant project statistician (now at Department of Psychology, University of Liverpool)
Dr Marcin Szczerbin´ski, Human Communication Sciences Department, project statistician Practitioner-researchers, 2003/04:
Colette Beazley Judy Davey
Richard Finnigan (now at University of Nottingham) Yvonne Spare
Jan Wainwright
Practitioner-researchers, 2004/05: The 2003/04 team, plus: Gill Fuller
John Harman Margaret Harman Liz Heydon Naomi Horrocks Gaye Houghton
Peer review
This report was peer reviewed. The critical reviewers were:
Sandie Stratford, Boston College Anne Lee, TUC Learning Services Carol Woods, Freelance Researcher
Preface
The Skills for Life Strategy in England has led to unprecedented investment in adult literacy,
language and numeracy (LLN), major reforms of teacher education and training, and the introduction of national standards, core curricula and assessment to inform teaching and learning. We have a unique opportunity to make a step change in improving levels of adult skills. But until recently too little was known about effective teaching and learning practices, and reports from Ofsted and the Adult Learning Inspectorate repeatedly drew attention to the quality of teaching, and the need for standards to improve.
It has been a strategic priority at the National Development Centre for Adult Literacy and Numeracy (NRDC) to investigate teaching and learning practices in all the subject areas and settings in Skills for Life, to report on the most promising and effective practices, and to provide teachers and trainers, along with policy-makers and researchers, with an unparalleled evidence base on which to build on the progress already made.
Our findings and recommendations are reported here, and in the four companion reports covering writing, numeracy, ESOL and ICT. The five studies, which have been co-ordinated by NRDC Associate Director John Vorhaus, provide material for improving the quality of teaching and learning, and for informing developments in initial teacher education and continuing professional development (CPD). We are also preparing a range of practitioner guides and development materials, as a major new resource for teachers and teacher educators. They will explore and develop the examples of good and promising practice documented in these pages.
The study of effective practice in the teaching of reading to adult learners reported here was the largest such study to date in Britain, involving 454 learners in 59 classes across England and over 470 hours of observation. The findings have important implications for policy, practice and professional development, and above all on the need to provide learners with more active learning time devoted to reading.
1 Executive Summary
1.1 The Effective Practice Studies
The five NRDC Effective Practice Studies explore teaching and learning in reading, writing, numeracy, ESOL and ICT, and they set out to answer two questions:
1. How can teaching and learning literacy, numeracy, ESOL and ICT be improved? 2. Which factors contribute to successful learning?
Even before NRDC was set up it was apparent from reviews of the field (Brooks et al., 2001a; Kruidenier, 2002) that there was little reliable research-based evidence to answer these questions. Various NRDC reviews showed that progress in amassing such evidence, though welcome where it was occurring, was slow (Coben et al., 2003; Barton and Pitt, 2003; Torgerson et al., 2003, 2004, 2005). Four preliminary studies on reading, writing, ESOL and ICT, were undertaken between 2002 and 2004 (Besser et al., 2004; Kelly et al., 2004; Roberts et al., 2004; Mellar et al., 2004). However, we recognised the urgent need to build on these in order greatly to increase the research base for the practice of teaching these subjects.
The inspiration for the design of the five projects was a study in the USA of the effectiveness of teaching of literacy and English language to adult learners for whom English is an additional language (Condelli et al., 2003). This study was the first of its kind, and the lead author, Larry Condelli of the American Institutes for Research, has acted as an expert adviser on all five NRDC projects.
The research began in July 2003 and was completed in March 2006. It set out to recruit and gather information on 500 learners in each study, assess their attainment and attitudes at two points during the year in which they were participating in the study, interview both learners and teachers, observe the strategies their teachers used, and correlate those strategies with changes in the learners’ attainment and attitudes.
The ICT study differed from the others in that its first phase was developmental, its sample size was smaller, and it had a shorter timescale, completing in March 2005.
1.2 The reading study
1.3 Main Findings
Progress
Learners are progressing and achieving: many learners achieved an externally accredited qualification at the end of their course (163 out of 265), and many went on to further study (171 out of 265). Progress was supported by regular attendance.
Pair and group work encourages progress:
■ Learners who spent more time working in pairs made better progress; and learners who spent less time working alone in class made better progress. Learners need time to work in pairs and small groups, and teachers need to know how to facilitate that.
■ However, the most frequent patterns of classroom activity observed were either a whole-class opening section followed by individual practice or entirely based on individual work. In both cases learners worked alone for substantial amounts of time – this was the most frequent grouping strategy, corresponding with silent reading as the most frequent specific teaching strategy.
■ The influence of the core curriculum was mentioned by many teachers as the reason for making greater use of group teaching.
We found that:
■ Women made slightly better progress than men
■ Employed people made better progress than the unemployed
■ People with an FE/NVQ qualification made better progress than those with no qualifications.
Learners’ progress wasnotaffected or inhibited by many factors which might otherwise be thought of as having an impact on their achievement:
■ age ■ ethnicity
■ English as first or additional language ■ age of leaving full-time education ■ time since last course
■ having dyslexia
■ pre-test scores in reading.
The importance of improving learners’ self-esteem and confidence is well known; we found evidence of a significant increase in confidence amongst learners.
Time to learn
There is more to literacy provision than taught hours and contact time: self-study is also essential if learners are to persist and progress. We found that learners who reported more self-study between classes made better progress, and this is re-enforced by similar findings from the Longitudinal Study of Adult Learning in Oregon (Reder, 2005).
Learners need enough time to learn:
2001b), many learners had attended for 50 or more hours between the two assessments, and those learners made the greatest average progress. Evidence from the National Centre for the Study of Adult Learning and Literacy (NCSALL) suggests that learners require in the region of 150–200 hours if they are to progress by one level within the Skills for Life qualifications framework.
■ We found no significant differences between the mid- and post-assessments in either year (although in 2004/05 there was a gain between pre- and mid-assessment). The evidence suggests that learners in this study would have gone on to make more progress if the gap between assessments had been longer.
Teaching strategies
Although a wide range of teaching quality was observed, most teaching was of high or fairly high quality. Few classes were judged to be middling or poor. The instrument used was adapted from the authoritative Condelli study (Condelli et al., 2003) and covered teaching strategies and apparatus for learner engagement.
Very frequent teaching strategies were:
■ giving appraisal/feedback immediately ■ discussion of vocabulary during a reading
■ other word study (e.g., word lists, puzzles, word searches) ■ and using a dictionary to find word meanings.
Several approaches which the literature suggests are effective were rarely seen:
■ encouragement of fluent oral reading. Early findings from the development project on
encouraging fluent oral reading suggest that it can re-engage reluctant readers, produce some excellent progress, and provide more active reading in class than is currently the case
■ reciprocal teaching (where pairs of learners take turns to be ‘tutor’ and ‘student’) ■ explicit comprehension strategies
■ accurate phonics teaching ■ language experience approaches.
These approaches are priorities for further development, and their rarity helps explain why progress was in some cases limited.
Teachers should allow more time for learners to engage in ‘active reading’ – or reading aloud – as opposed to reading silently or non-reading activities. On average, active reading tuition occupied less than half the class time.
The adult literacy core curriculum
Most teachers were positive, speaking of the curriculum as being more ‘structured’, ‘focused’, generating ‘good ideas’, raising the profile of adult literacy, increasing teachers’ confidence and clarifying issues of differentiation. Highest praise came from those who had been teaching adult literacy a relatively short time.
Teachers’ qualifications
Current standards now expect adult literacy teachers to have both a full teaching certificate and a Level 4 subject-specialist qualification. Two of the teachers were fully qualified in this way as literacy teachers, but the data were gathered at a time when few teachers had yet had the opportunity to acquire the new Level 4 qualifications. One other teacher was fully qualified, but as a numeracy teacher.
Twelve of the 47 teachers had both a generic teaching qualification (Cert Ed, PGCE or equivalent) and a subject-specific literacy teaching qualification in the form of the ‘old’ City & Guilds 9285. A further 11 teachers had qualifications of both types, but one or other, or both, of the qualifications was of an introductory nature only.
Thirteen teachers had a full generic teaching certificate, but no qualifications in teaching adult literacy. A further two teachers had less than full versions of generic teaching qualifications, also with no literacy teaching qualifications.
Three teachers had qualifications in teaching adult literacy, but no generic teaching qualifications.
Three teachers were not interviewed about their qualifications.
Of the 31 teachers with full generic teaching qualifications, 20 were in the context of training to teach in schools.
We make no assumptions here about how the status of teaching qualifications has affected teaching skills.
1.4 Recommendations
Development work and quality improvement
It is a priority for initial teacher training and for continuing professional development to provide teachers with specific and general strategies for teaching reading, and in particular:
1. oral fluency
2. explicit comprehension strategies 3. reciprocal teaching
4. phonics
5. language experience approaches.
Initial teacher training and continuing professional development should provide support for teachers in making more creative use of curriculum materials.
Teachers in training need to be shown in more detail how to teach reading in ways adapted to their learners’ needs, and therefore how to assess those needs, especially where learners have ‘spiky profiles’ of achievement.
1. self-study, which will both increase time on task and encourage learners to take responsibility for their own learning
2. distance learning 3. ICT-supported study 4. intensive provision.
Learners would benefit from spending more time working in small groups during course time, rather than most of their time working alone.
There is a need to support teachers in developing strategies for balancing pair and group work with time given over to learners working alone. These strategies should be developed and introduced into initial teacher education and continuing professional development programmes.
At the level of classroom practice, the most practicable ways to reduce the amount of time learners spend working alone are to increase whole-class work and opportunities for learners to work in pairs – for example, in a buddy system.
Teachers already in the field appear to have little opportunity for reflection on their practice. Our practitioner-researchers’ accounts suggest that more opportunities need to be provided for teachers to observe in other practitioners’ classrooms.
Policy
There is every reason to continue to make provision for learners of a range of ages and
ethnicities, with English as their first or an additional language, who left school at different ages and/or have spent varying lengths of time away from education, and who may or may not have dyslexia.
As the field expands, the availability of more classes should be built on to differentiate learner groups by initial attainment in reading and writing – currently, most classes have to cater for a range of levels.
Research
Approaches which have been found to be effective elsewhere (mainly in North America) should be tried out and their effectiveness investigated. Examples include teaching reading fluency and accurate phonics teaching. NRDC is undertaking field trials of incorporating practice in oral reading fluency into classroom activities.
A detailed development and research project should be carried out on phonics teaching in adult literacy. Further professional development activity is needed to train adult literacy teachers to use phonics, and to assess the effectiveness of phonics teaching in the adult literacy classroom.
We should explore comparisons between:
■ intensive courses and the typical pattern of extended provision ■ large and small amounts of whole-class teaching
1.5 Limitations to this research
We acknowledge the following limitations to our research:
■ The amount of time between assessments is likely to have been too short for evidence of substantial progress to emerge.
■ The assessment instrument assessed only comprehension at text level; no data were gathered on progress in other aspects of reading, such as word recognition.
■ Active reading tuition was found to occupy less than half the average class time, and not all classes were only focused on reading.
■ Some basic aspects of reading were not assessed; word recognition, for example. ■ Several effective teaching strategies were rarely seen.
■ The assessment tool used was a pilot tool.
2 Context
2.1 The policy background
In most English-speaking countries rather high proportions of adults are thought to have less than functional literacy. In England, the British Government’s response was to establish the
Skills for Lifeinitiative (GB DfEE, 2001), with targets for increasing adult literacy, language and
numeracy (LLN) enrolments and qualifications by 2004, 2007 and 2010. Within Skills for Life, the Government also established the NRDC. Part of NRDC’s remit was a focus on effective practice.
2.2 The Effective Practice Studies
The five NRDC Effective Practice Studies explore teaching and learning in reading, writing, numeracy, ESOL and ICT, and they set out to answer two questions:
1. How can teaching and learning literacy, numeracy, ESOL and ICT be improved? 2. Which factors contribute to successful learning?
Even before NRDC was set up it was apparent from reviews of the field (Brooks et al., 2001a; Kruidenier, 2002) that there was little reliable research-based evidence to answer these questions. Various NRDC reviews showed that progress in amassing such evidence, though welcome where it was occurring, was slow (Coben et al., 2003; Barton and Pitt, 2003;
Torgerson et al., 2003, 2004, 2005). Four preliminary studies on reading, writing, ESOL and ICT were undertaken between 2002 and 2004 (Besser et al., 2004; Kelly et al., 2004; Roberts et al., 2004; Mellar et al., 2004). However, we recognised the urgent need to build on these in order greatly to increase the research base for the practice of teaching these subjects.
The inspiration for the design of the five projects was a study in the USA of the teaching of literacy and English language to adult learners for whom English is an additional language (Condelli et al., 2003). This study was the first of its kind, and the lead author, Larry Condelli, has acted as an expert adviser on all five NRDC projects.
The research began in July 2003 and was completed in March 2006. It set out to recruit and gather information on 500 learners in each study, assess their attainment and attitudes at two points during the year in which they were participating in the study, interview both learners and teachers, observe the strategies their teachers used, and correlate those strategies with changes in the learners’ attainment and attitudes.
2.3 Features of this study
The reading study largely conformed to the description just given, except that:
■ The learners were assessed at three points instead of two. The reason for having three assessments was to strengthen the statistical analyses by allowing not just pre/post comparisons but also trend analyses.
■ No interviews with learners were conducted. At an early stage, because of resource limitations, a choice had to be made between having three assessment points and
interviewing learners. In order to match the design of the Condelli study and strengthen the statistical analyses, we chose the former.
2.4 Aims
The overall aim of the reading study was to gain some purchase on what enables learners to make progress and/or develop more positive attitudes. The principal specific aims were to investigate in depth:
■ the range of pedagogical practices which occur ‘naturally’, that is in the normal course of events and not as part of intervention studies, in the teaching of reading to adult learners in England;
■ changes in adult learners’ attainment in and attitudes to reading over the course of a year; and ■ the correlation between the different pedagogical practices and any such changes;
and make recommendations to the profession about effective practices.
2.5 Scope
The statistical design required an achieved sample of learners of about 250, and a target for initial recruitment was set at 500.
Five practitioner-researchers (fieldworkers) and one of the research fellows gathered data in 2003/04, and they were joined by six more fieldworkers in 2004/05. They recruited 454 learners in 59 classes. All 454 learners completed a consent form, a learner profile and a pre-questionnaire on attitudes to literacy, and 440 completed a reading pre-assessment. Across the two years, 338 learners (74 per cent) returned for the mid-assessment and 322 (71 per cent) for the post-assessment, and full data were obtained on 298 (66 per cent). This is the largest sample ever achieved in a study of this sort in this country, and sufficient to support robust statistical analyses.
2.6 Literature review
This review of the literature on teaching reading to adult learners is brief, because the literature is fairly scant and because two comprehensive reviews were carried out a few years ago.
which had been thoroughly covered in England was surveys of the scale of need; the general conclusions were that very few adults could be considered illiterate, but many had less than functional literacy (defined as below Level 1) – possibly as many as 7 million, the figure the Moser committee had settled on (GB DfEE, 1999).
Brooks et al. (2001a) also found that there had been only two national surveys of adult learners’ progress in literacy in England; neither had attempted to correlate progress in attainment with strategies for teaching. There was almost no information on what adult literacy teaching was actually like on the ground.
Besser et al. (2004) studied 53 adult literacy learners’ difficulties in reading. They found that a range of strategies was being used to address the issue, but there appeared to be a less than perfect match between learners’ difficulties and pedagogy. Intensive, focused reading instruction did not comprise a significant amount of teaching. In particular, little work at sentence level or on comprehension beyond the literal was seen. The assessment data showed that most of these learners had poor phonological awareness. Much of the phonics teaching observed was done on the spur of the moment, and there were instances of inaccurate phonics teaching.
Kruidenier (2002) in the USA produced a large review focusing on adults’ reading skills. He also used findings from school-level research but, in the summary of his conclusions given below, only the more reliable findings from adult-level research are listed.
What works?
That is, what does the available evidence say about effective pedagogy? What counts as evidence depends on what the research question is. If the research question is, ‘What factors in teaching causelearners to make progress in learning?’ only randomised controlled trials (RCTs) have the potential to provide robust evidence, because only RCTs purport to control all possible extraneous causes of measured progress.
It is still legitimate, however, to ask what findings can be derived from other forms of evidence addressing different research questions. For example:
■ What factors in teaching adult literacy and numeracy are known to correlatewith better progress in learning?
■ What evidence is there that ICT enables adults to make better progress?
■ How much instructional time do learners need to make educationally significant progress?
Findings from randomised and other controlled trials
This section is based entirely on NRDC systematic reviews carried out by Torgerson et al. (2004). They found just enough evidence to demonstrate that receiving adult literacy tuition produces more progress than not receiving it. Though this is intuitively obvious, this was the first time it had been rigorously demonstrated.
Factors that are known to correlate with better progress
Sticht et al. (1987) reported on the US Army’s Functional Literacy (FLIT) programme, which focused on training related reading quickly. This produced not only greater gains for job-related reading than either no literacy training or general literacy programmes, but also gains in general reading that were greater than from no literacy training and, more significantly, on average better than those delivered by general literacy programmes.
An early piece of research commissioned by the Basic Skills Agency (BSA, 1997) found that, in further education, the provision of adult literacy support reduced drop-out rates and
increased completion rates.
The Basic Skills Agency (BSA, 2000) summarised quantitative evidence showing that effective programmes have high expectations of learners’ achievements, as well as enabling learners to gain credit and accreditation for their learning and to move into further study if they wish.
Brooks et al. (2001b) carried out a large-scale study for the BSA of the progress in literacy made by adult learners in England and Wales. Average progress in reading was slow and modest, and in writing almost non-existent. Factors associated with better progress in reading (none were found for writing) were:
■ all the tutors in an area having qualified teacher status ■ tutors having assistance in the classroom
■ regular attendance by learners.
Kruidenier’s (2002) review of research on reading in adult literacy suggested that adult learners may benefit from being taught word attack skills, fluency in reading aloud, repeated reading and explicit comprehension strategies.
What evidence is there that ICT enables adults to make better progress?
There is no convincing evidence of benefits from ICT over conventional instruction (Kruidenier, 2002; Torgerson et al.,2004). However, the NRDC Effective Teaching and Learning: Using ICT study did find that ICT teaching strategies improved literacy skills, although our ICT study did not focus on reading alone.
Instructional time needed to make significant progress
Comings (2003) summarised the US evidence on this – learners need to attend at least 100 hours to make progress equivalent to one US grade level. For England and Wales, the Basic Skills Agency (2000) provided estimates of the amounts of tuition time learners take to move up one level of the (pre-2001) BSA Standards; these varied from about 100 hours to over 250. However, in both countries learners are on average in provision for fewer than 70 hours in a year.
2.7 Brief account of method
(A fuller account of the methods used is given in Appendix A of the full report of the study, which will be available on the NRDC website.)
what enables learners to make progress and/or develop more positive attitudes. Adult learners’ attainment in reading and attitudes to literacy were assessed three times and, between the first two assessments, the strategies their teachers used were observed.
Two of the observed classes were intensive, that is they provided several hours of class a week for just a few weeks. The rest followed the usual pattern – about two hours a week for most of the teaching year. In general, the initial (‘pre-’) assessments of the learners, including gathering information on their background characteristics, took place in the autumn terms of 2003 and 2004. The second and third (‘mid-’ and ‘post-’) assessments were carried out in the spring and summer terms of 2004 and 2005. (The timetable for the two intensive classes was, of course, much shorter.)
The observations were conducted between the pre- and mid-assessments, that is mainly between November 2003 and March 2004 and between October 2004 and February 2005; the exact dates were determined according to local circumstances. Four observations were conducted in each of the 59 classes, making 236 observations in all. Since the average duration of the classes was two hours, the total amount of observation time was about 472 hours. In addition, a series of double observations was carried out in order to ensure consistency between the fieldworkers.
The reading assessment instrument used was specifically designed for NRDC by the National Foundation for Educational Research in 2003. It was aligned in detail with the Adult Literacy Core Curriculum and National Standards and, therefore, also with the national tests for which many learners were being prepared. It tested reading comprehension, in line with the
project’s definition of reading as ‘creating or deriving meaning from text’. Other aspects of reading, e.g., word identification, were not assessed. The instrument was designed to be appropriate for learners from Entry level 1 to Level 2. There were 30 items, which were a mixture of multiple-choice and open-ended (‘supply’) types, and referenced to the National Standards and Core Curriculum. An example of a test passage that was developed for a pilot version but not retained in the final version used in this project is shown in Figure 2.1. The text is followed by two questions based on it.
Figure 2.1 Example of a reading passage and question types
Animal facts
A missing parrot told RSPCA officers his name! Now he is safely back home. His relieved owner said, ‘Joey always copies what he hears.’
Kelly is the smallest police dog in the world. He is only 22 centimetres tall! He works in Holland, finding robbers and missing persons. A police spokesman said, ‘A small dog is useful. Kelly can search easily under cars. He eats much less than a big dog.’
Police rescued a man in Canada after his cat went mad and trapped him in a bathroom. Fluff the cat was snarling and hissing at the bathroom door when the police arrived. The trapped man suffered scratches in the incident.
A pensioner in Brazil got the shock of his life when an alligator suddenly landed in his backyard. The five-foot-long reptile had fallen from a balcony where it was being kept as a pet by his neighbours. The startled pensioner said, ‘When I phoned the police asking for help, no one believed me. They asked if I was dreaming!’
Entry Level 3 item focusing on finding information:
Find the names of these animals: ■ the smallest police dog
■ the mad cat ■ the missing parrot.
Entry level 1 item focusing on following narrative/understanding main events:
Why did a man wrap a snake round his middle?
At the mid- and post-assessments in 2003/04, and all three occasions in 2004/05, the final version of the reading comprehension instrument was used. However, at the pre-assessment in 2003/04, a pilot version was used. It is theoretically possible that the difference in
instruments may have contributed to the fall in average reading scores in the first year.
Each of the three assessment occasions also included an attitudes questionnaire. This contained questions on:
■ learners’ self-confidence in various language-, literacy- and learning-related situations (10 items)
■ the frequency with which learners engaged in a few literacy activities (4 items) ■ the learners’ enjoyment of some literacy activities (6 items).
In addition, a learner profile (age, gender, etc.) and a learner consent form were completed by learners at the start.
Information was also gathered from the teachers on their teaching background, aims for the session and, where this was known, data on learners’ achievement of an accredited
qualification and progression to further study.
Four observations were carried out in each class. The observations involved:
■ Background information on the session and on the learners:
– the physical circumstances, who was present (including any volunteers or assistants) – the layout of the room
– information gathered from the teacher beforehand about the aims of the session, etc. – information gathered from the teacher afterwards about how the session went.
■ A timed log. This sought to capture as many as possible of the teacher’s teaching strategies and of the learners’ activities as they occurred. It covered, among other things:
– whole class, small group and individual groupings, and changes between these – the content and style of the teaching
– the materials used (copies of which were acquired whenever possible) – the time spent on each activity, logged to the minute as far as possible.
■ An analysis of the session against a classification of teaching strategies and activities. The observations were coded into general and specific strategies. There were 19 codes for general strategies (those that could apply to any teaching, e.g., teacher explaining the purpose of the lesson, opportunities for learner involvement) and 54 for specific strategies (those directed at the teaching and learning of reading).
The methods used to analyse the data are described at appropriate points in the report.
2.8 Structure of this report
3 Local characteristics – the providers and the
settings
3.1 The providers
The providers of the 59 courses in this study were as follows:
34 by further education (FE) colleges (of which 1 was Learndirect) 19 by local education authorities (LEAs) (including one delivered by FE) 3 by a charity
2 by training providers 1 by a prison (delivered by FE)
Overall, the classes were fairly representative of mainstream adult literacy provision, but not of the full range. For instance, there were no classes in workplaces (even though we
contacted several in an attempt to recruit them) or young offender institutions, and only one in a prison.
3.2 The settings
All 59 classes were held in England, mainly in an area bounded by Liverpool, Chorley, Leeds, Louth and Swadlincote. There were also three outlying classes, in Norfolk and West Sussex. Most of the classes were in urban or suburban settings, but some were in small towns or rural areas.
Of the 59 courses, 39 were held in the daytime and 20 in the evening.
The classes were held in a wide variety of venues, with FE main college sites and FE ‘other sites’ providing the majority, followed by LEA adult education centres.
3.3 Single-purpose and integrated classes
4 The learners and their experience
4.1 The learners
This chapter looks first at the characteristics of the learners and then at the representativeness of the sample.
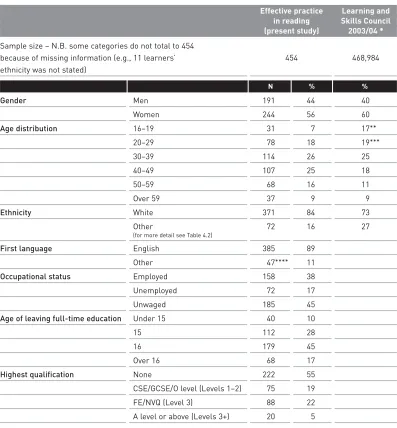
Characteristics of the 454 learners who formed the initial sample are shown in Table 4.1. For some categories, comparative national Learning and Skills Council (LSC) data for 2003/04 (the year when the first phase of this study was carried out) are shown. These figures cover most learners enrolled in LSC-funded adult literacy that year, except that those studying for GCSE English or key skills qualifications have been excluded. LSC data for 2004/05 were not yet available at the time of writing, but would probably show similar percentages to those for 2003/04.
Not all the cells in Table 4.1 are filled, because the present study collected more detailed data than LSC. The gender balance in this study was quite similar to the national picture. In broad terms, so was the age distribution, except that nationally there were more young people in adult literacy provision. The higher percentage of people of white ethnicity in this study than nationally arose because this study sampled only a few areas with high ethnic minority populations, and in particular none in the London area.
The predominance of 15 and 16 as ages of leaving full-time education was as would be expected. Much less expected was the proportion who left full-time education before age 15 – some may have had their school education abroad. Some of those who stayed on in full-time education after 16 may have been people with learning difficulties or disabilities. For more on this topic, see Section 4.5.
4.2 Note on ethnicity, nationality and language
Learners come from many different ethnic, national and linguistic backgrounds and, for pedagogic and equal opportunity reasons, one or more of these was recorded by the various effective practice projects, depending on their usefulness for the particular project. However, available categories do not necessarily fit with people’s own sense of identity. Ethnicity and nationality are highly problematic, contested, and historically variable concepts. Ethnicity, in particular, is constructed out of overlapping categories based on colour, nationality, religion, culture and language. People often move strategically between ethnicities by using
bilingualism, dual nationality, multiple identities and repertoires of cultural knowledge (White, 2002: 4). A fixed category can stereotype and give ethnicity or nationality an emphasis over and above other social categories that people belong to. In addition, most monitoring systems do not reflect the changes in immigration patterns which have led to ‘hyper-diversity’
Table 4.1 Background characteristics of the sample of learners
Effective practice Learning and in reading Skills Council (present study) 2003/04 *
Sample size – N.B. some categories do not total to 454
because of missing information (e.g., 11 learners’ 454 468,984
ethnicity was not stated)
N % %
Gender Men 191 44 40
Women 244 56 60
Age distribution 16–19 31 7 17**
20–29 78 18 19***
30–39 114 26 25
40–49 107 25 18
50–59 68 16 11
Over 59 37 9 9
Ethnicity White 371 84 73
Other 72 16 27
(for more detail see Table 4.2)
First language English 385 89
Other 47**** 11
Occupational status Employed 158 38
Unemployed 72 17
Unwaged 185 45
Age of leaving full-time education Under 15 40 10
15 112 28
16 179 45
Over 16 68 17
Highest qualification None 222 55
CSE/GCSE/O level (Levels 1–2) 75 19
FE/NVQ (Level 3) 88 22
A level or above (Levels 3+) 20 5
* Source: Learning and Skills Council database for 2003/04 (All adult LLN learners with a learning aim in literacy other than GCSE English or key skills)
** 15–20 *** 21–29
**** The 47 learners with English as an additional language had 33 mother tongues between them.
Recording language background is also difficult as there is no straightforward link between ethnic category, nationality, ethnic identity and language. Learners’ stated language backgrounds are often a mix of languages they are expert in, languages they have an attachment to, and languages which are part of their inheritance (Rampton, 1990). Also they may use non-standard or historic varieties of these languages, or only their written or spoken forms.
Table 4.2 Learners’ declared ethnicities
Percent
Ethnicity Number Separate % Grouped % Learning and Skills
Council 2003/04 (%)
Black – African 13 2.9
Black – British 12 2.7 8.1 8.3
Black – Caribbean 11 2.5
Bangladeshi 1 0.2
Indian 8 1.8 2.7 9.2
Pakistani 3 0.7
Chinese 5 1.1 0.7
Mixed heritage 13 2.9 1.7
White 371 83.7 73.2
Other 6 1.4 6.9
Total 443 100.0 100.0
4.3 The learners’ previous experience of provision
The distribution of answers to the question, ‘How long is it since you last did a course like this?’ is shown in Table 4.3. The classes had attracted a fair number of people who had not been on a course for some time.
Table 4.3 Length of time since last course
More than 10 years 22 %
6–10 years 6 %
2–5 years 16 %
Less than 2 years 56 %
4.4 Learners’ voices
Six learners attended the second of the three consultation/feedback days held at the
University of Sheffield (described in Section 6.3), and their responses to various questions are set out below. It should be noted that these learners cannot be regarded as a representative sample, in that it is more likely to be the confident and successful ones who are willing to share their experience in this way.
How do you think you did in the assessment?
■ One learner said she had liked it and thought she had done well. When asked if she had found it ‘intimidating’ she immediately responded with a ‘no’.
■ Another learner also said that she thought she’d done well and had found it ‘interesting’.
[image:23.842.264.464.634.694.2]What milestones do you see as marking your own progress?
■ One learner said he had now read his first book (The Hitchhiker’s Guide to the Galaxyby Douglas Adams) and had just finished a second. (His teacher said that the ‘most fantastic thing’ for her was when he came in and said he had read that first book.) In terms of writing, he said he was now prepared to persevere, writing it out about five times to get it right, even although he still found the process difficult.
■ Another learner said that she could now understand ‘how they want me to answer certain questions’. She also said she read more, and not just the TV magazines but things she wouldn’t have read before. With writing, what was key was the realisation that everyone has to do rough drafts first – her teacher had explained this to her. The first big step was actually going to class. Two learners spoke about this. Doing this built up confidence. One learner described how she had to pluck up courage even to enquire about what classes were available.
■ With some prompting from their teachers, the other learners were happy to share their achievements with the group, which included:
– writing the first letter ever to her brother (‘He was shocked and said, don’t let that be the only letter you write to me!’)
– writing a book review for the first time (‘I was quite proud of that’) – achieving National Test levels 1 and 2 and about to start GCSE English.
This same learner had also got a new job in a college as a learning support worker for learners with profound learning difficulties; she could now write a CV; and she had had a story printed in the Daily Mail. (This story features in the extract from the transcript at the end of this section.)
How important are the National Tests?
The learners seemed to be in favour of them, even although they were aware that there was always the chance of failure. One learner said ‘I’d rather have a go and fail than not have a go.’ One explanation given was that a requirement for many jobs was Level 2 English.
Are there factors which get in the way of learning?
This was not a question that the learners seemed able to answer, not even in terms of practical considerations such as childcare, although the teachers and practitioner-researchers were able to make various suggestions (see Section 6.3).
Was there any specific thing that had helped?
The final question about any other barriers or specific things that had helped the learners was again met with silence. One teacher suggested that for one pre-Entry learner (not present) having one-to-one help from a volunteer had been crucial.
■ Thus prompted, two learners indicated their teacher and said that she had helped them a lot and was more like a friend. It was not like at school. The one-to-one help was ‘tremendous’ and had helped build confidence and self-esteem.
The following extract (Vignette 4.1) about one learner’s experience from the transcript of the session illustrates the pride felt by learners in their achievements.
Vignette 4.1 One learner’s statement of the benefits she gained
One learner talked about how she was so nervous that it took her about 40 minutes of pacing up and down outside before she dared to go in to enquire about what help she could get with her reading and writing. When she was given the forms, she didn’t have her glasses with her (‘Yes, really’) and joked about how often people would have heard that excuse! (‘It was the best thing I’ve ever done in my life.’)
She said that last year she had been made redundant after 17 years working in a factory and she thought she would not be able to get another job. ‘Now I have done my English Levels 1 and 2 and maths Level 1, have just signed on to do GCSE English and I’ve just got a job in a college as a learning support worker for learners with profound learning difficulties. I’m able to write a CV’.
She also talked about how she had never written a letter, but, ‘five weeks ago I emailed a complaint to the Daily Mail. I’d now got the confidence to do that, even though it took me about three hours sitting with my dictionary, but I was so passionate about it I had to do it….They didn’t print it but they did send me a reply and the next day it was in the Daily Mail as a story, word for word.’
She said that it was not attributed to her, but her tutor agreed that it was what she had sent and, as she gleefully added, ‘They had not even had to change her spelling because she had spent so long getting it right!’
Both from these comments and general experience, it is clear that measuring progress in reading is more complex than any tests devised by researchers or awarding bodies. A worthwhile research topic would be to investigate more systematically what learners perceive as markers of their progress.
4.5 Learners with learning difficulties or disabilities
Most classes had no observed learners with learning difficulties or disabilities, but 20 classes had at least one such learner. Two classes consisted entirely of such learners, another of five people with Down syndrome and two with severe learning difficulties (on this class, see Section 6.10), and a fourth entirely of people recovering from mental health problems. A total of 108 other learners were said to have dyslexia, of whom 50 had been formally assessed, and the rest were judged by their teachers to have dyslexia. In all, there were at least 170 learners with some form of learning difficulty or disability (37 per cent) in the sample.
4.6 Returners, drop-outs and representativeness of the retained sample
However, of more importance for the validity of the study was the representativeness of the retained samples, because if the learners who dropped out and those who stayed differed significantly, the generalisability of the findings even to the original sample would be limited. Of the 454 learners who had provided data at the pre-assessment, full data were gathered on 298 (66 per cent of the original sample). This group are referred to as the ‘returners’.
Though the retention rate was satisfactory, were the returners representative of the original sample? To investigate this, statistical comparisons between the returners and the drop-outs were undertaken, looking for possible differences on:
■ each of the background characteristics, as gathered through the learner profile; ■ their levels of reading attainment as measured in the pre-assessment;
■ their attitudes to reading as measured in the pre-questionnaire.
5 Learners’ progress
Except where stated, the statistical findings reported in this chapter are based on returners only.
5.1 Learners’ achievement of accreditation and progression to further study
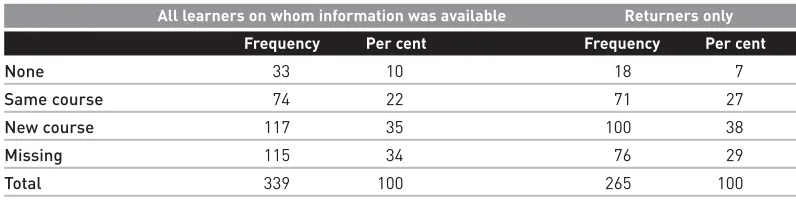
In both years, teachers were asked at the end of the year for information on whether their learners had achieved an accredited qualification and/or gone on to a further course of study. The results for the two cohorts together are shown in Tables 5.1 and 5.2. Inevitably (because the information was gathered when courses were already over) there were larger than usual gaps in the data, especially on further study.
Table 5.1 Accredited qualification achieved, both cohorts
All learners on whom information was available Returners only
Frequency Per cent Frequency Per cent
None 147 43 102 38
Entry level 83 24 68 26
Level 1 or 2 109 32 95 36
[image:27.842.263.661.679.781.2]Total 339 100 265 100
Table 5.2 Further course of study, both cohorts
All learners on whom information was available Returners only
Frequency Per cent Frequency Per cent
None 33 10 18 7
Same course 74 22 71 27
New course 117 35 100 38
Missing 115 34 76 29
Total 339 100 265 100
The number of returners overall was 298, so data on achievement of a qualification were available on 89 per cent of returners; 62 per cent of this group (163 out of 265) had achieved a qualification. Also, 171 returners out of 265 (65 per cent) had either returned to continue the same course or started a new one. At first sight, the finding on accreditations achieved is remarkably positive – but it does contrast with the reading data gathered by the study reported in the following section. It may be that the accreditations achieved were actually certifying where learners already were, rather than attesting to progress.
5.2 Reading attainment across the three occasions
by cohort. The scaled scores were standardised on a 0–100 scale with a national average of 50 and standard deviation of 10. The average scores for this study were all somewhat below the national average, though probably not significantly so. However, the standard deviations were all much larger than 10. This suggests that our samples were much more diverse than the sample on which the reading assessment instrument was normed. Consistent with this, the ranges of scores were very wide: on all six occasions there was at least one learner whose scaled score was zero, and on four occasions there was at least one learner who got so many questions right that their scaled score was the maximum, 100.
[image:28.842.193.597.520.612.2]It is important to note that there was a technical difference between the test used at the assessment in the first year and the versions used on all five other occasions: the first pre-assessment used a pilot version of the tests, and the scaling of scores from it was derived differently. This does not affect analyses against sub-samples, but does mean that the over-time difference between the pre- and mid-assessments for the first year may not be fully reliable, and the first cohort’s pre-score is therefore not reported.
Table 5.3 Reading attainment, by cohort
Occasion
Cohort Pre- Mid-
Post-2003/04 (N = 123) Average scaled score 43.1 41.9
(SD) (24.9) (25.6)
2004/05 (N = 179) Average scaled score 40.0 46.5 46.2
(SD) (22.9) (23.6) (25.0)
N = sample size; SD = standard deviation
Analysis of the reading assessment data showed no significant differences between the mid-and post-assessments in either year. However, in 2004/05 there was a statistically significant gain between pre- and mid-assessment (p<0.05).
The point was made at a consultation day (see Section 6.3) that ‘assessment fatigue’ seemed to have set in by the third occasion. This may help explain why the mid- and post-scores did not differ significantly.
These findings immediately raise the question, ‘Were there any factors which appeared to correlate with better progress?’ This question was pursued in various ways: via an analysis of the errors learners made on the reading assessment and correlations with initial scores, the learners’ background characteristics, the attitudes questionnaire, amount of self-study between classes, and attendance. These factors are now investigated in turn.
5.3 Did progress in reading depend on initial reading level?
5.4 Error analysis
An analysis was carried out of the errors made by learners in the first cohort at the pre- and post-assessments, using just the 13 open-ended items common to both occasions. There were 226 analysable incorrect responses in the pre-tests, and 133 in the post-tests. Three categories of error emerged as the most frequent:
1. Logical answer based on misunderstood text, i.e., the learner had difficulty reading the item and therefore guessed.
2. Limited understanding of text/item, e.g., the learner picked out a word or phrase but from the correct item – sometimes apparently at random or, at best, with only a tenuous connection. 3. Scanning of text for key words contained in original item and copying out of words
immediately following those key words.
While the proportion of category 1 errors dropped between pre- and post- (from 15.9 per cent to 5.9 per cent of total errors made), there was a rise in the proportions both of Category 2 errors (from 13.7 per cent to 28.9 per cent) and of Category 3 errors (from 15.5 per cent to 19.2 per cent).
Contrary to what might be expected, the comparison between the types of errors made on the pre- and post-assessments would seem on the surface to reflect less understanding on the post- than on the pre-assessment.
It is possible to speculate about the reasons for this change: learners’ reading ability may have decreased between assessments, which seems highly unlikely, or learners’ motivation may have decreased by the third assessment, in some way affecting their responses – but these possibilities seem inconsistent with the findings on attitudes (see Section 5.6). Conversely, it may be that confidence and ability increased and learners felt able to attempt the more complex questions, and thus made more basic errors as they were working at the limit of their ability level.
5.5 Exploring individual differences in changes in reading attainment
A series of correlations between changes in reading attainment and learners’ background characteristics was carried out.
■ Gender:Women made slightly but significantly more progress than men.
■ Age: There were no significant differences in progress between age bands (for the age bands see Table 4.1).
■ Ethnicity: The detailed ethnic profile of the sample was presented in Table 4.2. Because the numbers of ethnic minority learners were small, for purposes of analysis all ethnicities other than white were collapsed into a single category. White learners performed better than others at pre-test and at post-test, but neither group made significantly greater loss or gain than the other.
■ Home language: The amount of progress made by learners with English as an additional language did not differ from that of the majority whose first language was English.
■ Age of leaving full-time education: There was no relationship between the age of leaving full-time education and change in reading scores.
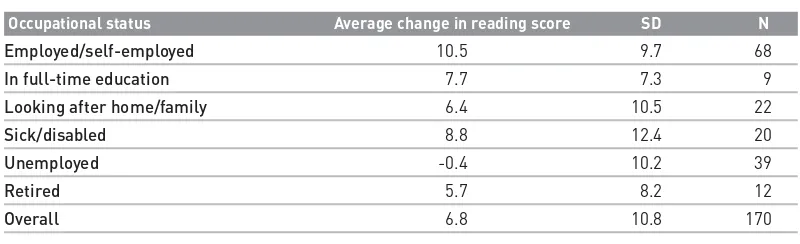
■ Qualifications:In the 2004–05 cohort only, learners with any further education or NVQ qualification on average made particularly good progress – see Table 5.5. Their improvement was significantly greater than that made by those with no qualifications or CSE/GCSE/O Level. ■ Time since last course:It made no difference (on average) how long it had been since
learners had been on a course.
■ Dyslexia: There was no significant difference in change in reading scores between those who had dyslexia and those who did not.
[image:30.842.195.595.493.615.2]■ Having been diagnosed with dyslexia: There was no significant difference in change in reading scores between those who had been assessed as having dyslexia and those who had not.
Table 5.4 Changes in average reading scores between pre- and post-test, 2004/05 cohort, by occupational status
Occupational status Average change in reading score SD N
Employed/self-employed 10.5 9.7 68
In full-time education 7.7 7.3 9
Looking after home/family 6.4 10.5 22
Sick/disabled 8.8 12.4 20
Unemployed -0.4 10.2 39
Retired 5.7 8.2 12
Overall 6.8 10.8 170
N = sample size; SD = standard deviation
Table 5.5 Changes in average scores between pre- and post-test, 2004/05 cohort, by educational qualifications
Level of educational qualifications Average change in reading score SD N
None 5.9 11.3 95
CSE/GCSE/O Level 3.8 11.1 36
Any FE qualification/NVQ 11.5 9.9 36
A Level or above 6.7 6.7 6
Overall 6.7 11.1 173
N = sample size; SD = standard deviation
5.6 Findings from the attitudes questionnaire and correlations between reading attainment and learners’ attitudes
Statistical analyses were not carried out on the 20 individual items separately, but on the three parts of the questionnaire (see Section 2.7).
There were no significant changes in either frequency of literacy activities or attitudes to literacy (parts 2 and 3 of the questionnaire). However, there was a significant improvement in learners’ self-confidence (part 1 of the questionnaire) – see Table 5.6 and Figure 5.1.
[image:30.842.195.595.676.768.2]only one learner on any occasion was at either end of this distribution (see the outliers at pre-assessment in the 2003–04 cohort). All of the average self-ratings clustered around the mid-point of 25.
Table 5.6 Changes in learners’ self-confidence
Occasion
Cohort Pre Mid Post
2003/04 (N = 119) Average change in self-confidence 24.3 24.9 25.9
(SD) (5.8) (5.1) (5.3)
2004/05 (N = 179) Average change in self-confidence 23.4 24.8 25.9
(SD) (6.0) (5.5) (5.5)
Overall (N = 298) Average change in self-confidence 23.8 24.9 25.9
(SD) (5.9) (5.3) (5.4)
N = sample size; SD = standard deviation
NB The small circles with numerals indicate individual learners with ‘outlying’ self-ratings.
But was there any relationship between changes in reading attainment and learners’ self-ratings? Only a weak and inconsistent one.
Rather surprisingly, the improvement in learners’ self-confidence was not related to the changes in reading scores; nor were their self-ratings on frequency of literacy activities.
Only Part 3 of the questionnaire (items 15–20, asking about enjoyment derived from literacy) showed a fairly consistent relationship with change in reading scores. Learners whose reading benefited more from the classes reported slightly but significantly greater enjoyment of literacy at post-test than at pre-test, and had higher self-ratings than others on this at post-test. These relationships were very weak, however (less than two per cent of shared variance).
Figure 5.1 Changes in learners’ self-confidence
Pre Mid Post
Cohort
10.00 15.00 20.00 25.00 30.00 35.00 40.00
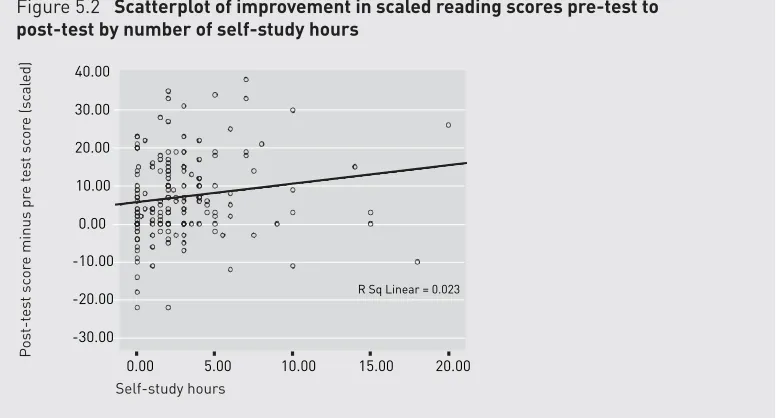
[image:31.842.264.661.412.705.2]5.7 Were changes in reading attainment related to amount of self-study between sessions?
Yes. Learners who reported more self-study between classes made better progress. This has also emerged as an important factor in the Longitudinal Study of Adult Learning in Oregon (Reder, 2005). Data on this factor were gathered only in the second year, but 178 learners (all but one of the returners in that year) provided relevant information. Though the correlation was not very strong, its effect can be clearly seen in Figure 5.2.
5.8 Attendance
Did the changes in reading attainment relate to regularity of attendance?
Yes. The relationship was positive and significant (more regular attendance was associated with greater improvement), but very weak.
However, learners for whom both pre-to-mid and mid-to-post attendance data were available (N = 278) attended, on average, around 30 hours in those two periods combined, even though the interval between the pre- and post-assessments had been designed to allow up to 50 hours’ attendance. This figure does notfully represent the attendance of the typical learner in a year, for two reasons. First, it does not include the three assessment sessions themselves – two-thirds of the learners in the study attended all three, and about six hours should be added to the average for the year on this basis. Secondly, it does not include any sessions attended before the pre-assessment or after the post-assessment. This would particularly affect the figure for 2003/04, because the pre-assessments in that year occurred somewhat later than those in 2004/05 – none earlier than November 2003 and some as late as January 2004.
[image:32.842.203.591.384.593.2]The project team estimated that the average length of time between the pre- and post-assessments across the two years was about six months (26 weeks); taking out four weeks for the Christmas and Easter breaks and two more weeks for a half-term and the mid-assessment would leave 20 weeks. Given that the maximum amount of attendance in 20 weeks would therefore be 40 hours, an average of 30 hours would actually represent quite
Figure 5.2 Scatterplot of improvement in scaled reading scores pre-test to post-test by number of self-study hours
P o s t-t es t sc or
e minus pr
e t e s t sc or e (sc al ed) Self-study hours 20.00 15.00 10.00 5.00 0.00 40.00 30.00 20.00 10.00 0.00 -10.00 -20.00 -30.00
regular attendance. Because the pre-tests in the second year were carried out rather earlier in the academic year, both the maximum attendance possible and the average actual
attendance would have been greater in that year. In the Progress in Adult Literacystudy (Brooks et al., 2001b) in 1998–99, many learners had attended for 50 or more hours between the two assessments, and those learners made the greatest average progress. It is therefore possible that learners in this study would have gone on to make more progress if the gap between assessments could have been longer.
Did the changes in reading attainment depend on the class attended?
Probably. The classes differed markedly in average change in reading scores. In the 2003/04 cohort, the best class had an average improvement of almost five scale points, while the worst experienced an almost 12 point decrease. Similarly, in the 2004/05 cohort, the best class improved by 19 points, while the worst got worse by three points. So, although the classes were very small, differences between them were probably not just random fluctuations. However, the numbers of learners in each class were so small (range 4–15 on roll, but numbers attending were almost always lower, with eight classes running for at least one session with only two or three learners; see Table 6.1) that statistical tests would not show these differences to be statistically significant.
Were changes in reading attainment related to other provision attended during the course?
No. Somewhat fewer than half of the learners were also attending some other provision. There was no correlation between attending other provision or not and change in reading scores.
5.9 Summary
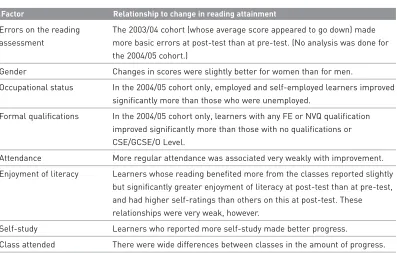
Table 5.7 Summary of factors associated with change in reading attainment
Factor Relationship to change in reading attainment
Errors on the reading The 2003/04 cohort (whose average score appeared to go down) made assessment more basic errors at post-test than at pre-test. (No analysis was done for
the 2004/05 cohort.)
Gender Changes in scores were slightly better for women than for men.
Occupational status In the 2004/05 cohort only, employed and self-employed learners improved significantly more than those who were unemployed.
Formal qualifications In the 2004/05 cohort only, learners with any FE or NVQ qualification improved significantly more than those with no qualifications or CSE/GCSE/O Level.
Attendance More regular attendance was associated very weakly with improvement.
Enjoyment of literacy Learners whose reading benefited more from the classes reported slightly but significantly greater enjoyment of literacy at post-test than at pre-test, and had higher self-ratings than others on this at post-test. These relationships were very weak, however.
Self-study Learners who reported more self-study made better progress.
Class attended There were wide differences between classes in the amount of progress.
6 Teachers’ practice
The focus in this chapter is firstly on building up a profile of the observed teachers (Section 6.1). Then their concerns as teachers are analysed (6.2) and further issues arising from the feedback/consultation days are explored (6.3). We then move onto classroom practice, with an examination of classroom layouts and teaching materials (6.4), groupings (6.5), and patterns of classroom activity (6.6-7). Two further sections cover general teaching strategies and opportunities for learner involvement (6.8) and specific strategies for the teaching and learning of reading (6.9). A case study of a class of adult learners with Down syndrome is presented in Section 6.10, followed by a short section on what was notseen during the observations (6.11).
6.1 Teachers’ profiles
Across the two years, 47 teachers were involved in teaching the 59 classes (several taught more than one, either in the same year or in consecutive years, or both). Information gathered from all 47 included gender, whether English was their first or an additional language, whether they had received Core Curriculum training, whether they had any teaching
assistants, and the numbers of learners in their classes. Three (covering three classes) could not be interviewed. Semi-structured interviews were conducted with the other 44 teachers (covering 56 classes), and the information from those interviews, and on gender, teaching assistants and the numbers of learners for all 47 teachers, is tabulated in Table 6.1.
Gender
Of the 47 teachers, 36 were women and 11 were men, and the great majority of classes observed were given by female teachers (46 out of 59).
First language
English was the first language of all but one teacher.
Experience
Over three-quarters of those interviewed (34) had additional teaching experience in other subjects. Nearly half of these teachers (16 of the 34) had infant or primary school experience. All but two had previous adult literacy teaching experience, which varied from one year to 28 years, with a mean of nearly nine years.
Assistants
In 26 of the 59 classes, the teacher had either no teaching assistant or very little help. In 23 classes, the regular number of assistants was one or two, and in the remaining ten, there was often or sometimes more help. Some implications of the availability of assistance in the classroom are discussed in Sections 6.2, 6.5 and 7.3.
Learner numbers
Table 6.1 Profiles of the observed teachers
041 F Not interviewed 1 11–15 051 F PGCE 9282, 9285 Maths GCSE/ 12 1 8–11
A Level
052, 055 F PGCE 9285 Primary, 26 052 – 1–2 6–10 secondary 055 – 1 6–8 053, 054, 057 M Teaching Cert, Dip 9282/3 Primary, 3–4 053 – 2–3 3–6 special/ remedial secondary; 054 – none 2–8 ed badminton, 057 – none 6–8
history, (except carer geography for 1 learner)
056 F PGCE 9281/2/5 ESOL (children); 8 1–2 10–14 psychology
058 F PGCE, T30, 9282/5 GCSE/A Level 12 1–2 5–13 maths
081, 086 F PGCE None Infants 22 081 – none 4–7 086 – none 3–5 082 F Cert Ed None Infant 13 1 7–9 083 M Cert Ed None ESOL New 1 4–7
No CC training*
084 F Cert Ed, 7407, None None 3 None 9–11 085 F PGCE Level 4 None Nearly 1–2 4–9
numeracy 2
091, 092 F PGCE TEFL Secondary 6 091 – 4–5 6–8 French 092 – 4 8–10 111 F PGCE 9282 Primary and 5 None 3–6
secondary adult ed (langs)
112 F Cert Ed 9285 PE (secondary) 17 1–2 5–8 113 F Cert Ed 9282/3 Primary 5 1–2 5 114 M 7307 9282/3 None (except 4 3–4 6–7
short time as volunteer)
115 F Cert Ed Primary None Primary 4–5 2 3–6 116 F PGCE None Primary 3 2 7–8 121 F 7307 9282/5 None 9 1 5–6 171,172 F Cert Ed, B.Ed None Primary/ 2 171 – None 4
secondary/ FE 172 – none 4–7 173, 178 F None 9282/3, 9285 Work-based New 173 – 1 5
training teacher 178 – none 5–7 174, 176 F Cert Ed None Primary 20 174 – none 5–7 176 – none 6–9 175 F None RSA diploma None 20 1 7–9 177 F PGCE None Primary; 3 None 6–9
secondary (special needs)
T
eacher’
s clas
s ID and
gender Generic In adult liter
acy
Pr
e
vious teaching
Year
s of e
xperienc
e in
adult liter
acy
Number of r
egular
as
sis
tants
Range of l
earner
number
s (total in clas
s,
including those not in project)
Teaching qualifications